“In science and philosophy, ad hoc means the addition of extraneous hypotheses to a theory to save it from being falsified. Ad hoc hypotheses compensate for anomalies not anticipated by the theory in its unmodified form. Scientists are often skeptical of scientific theories that rely on frequent, unsupported adjustments to sustain them. Ad hoc hypotheses are often characteristic of pseudoscientific subjects such as homeopathy.” — Wikipedia on the scientific definition of ad hoc hypotheses
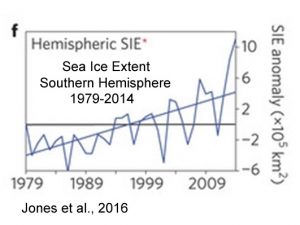
Observational evidence indicates that Antarctic sea ice has been advancing in recent decades, a trend that has puzzled climate modelers who assume that a warming globe will inhibit sea ice growth. About 86% of all climate models have indicated that sea ice would show a declining trend for Antarctica, and just 14% (1 out of every 7) concluded sea ice extent would advance. The average observed growth has been +1.29 (x 105 km2/decade) during the satellite era (since 1979), whereas the models projected a decline of -3.36 (x 105 km2/decade) on average.
Forty-nine models, almost all of the CMIP5 climate models and earth system models with historical simulation, are used. For the Antarctic, multi-model ensemble mean (MME) results can give good climatology of sea ice extent (SIE), but the linear trend is incorrect. The linear trend of satellite-observed Antarctic SIE [sea ice extent] is +1.29 (±0.57) × 105 km2 decade−1 ; only about 1/7 CMIP5 models show increasing trends, and the [modeled] linear trend of CMIP5 MME is negative with the value of −3.36 (±0.15) × 105 km2 decade−1 .
Not willing to countenance the fact that their modeling was so terribly wrong, advocates of alarming anthropogenic global warming recently decided it was time to get creative in explaining why their modeling could still be quite right after all. Of course, these advocates could not and would not admit that decades of growing sea ice trends would indicate that Antarctica and the surrounding Southern Ocean have not been warming, but cooling, during the last 3 decades in concert with the facile principle that cooler surface waters allow more sea ice to form.
Sea-ice growth and melt are determined by the heat balance between the OHF [ocean heat flux] and the conductive heat transfer through the overlying ice cover. … Low atmospheric temperatures drive sea-ice formation, while relatively high ocean temperatures that can limit ice growth are a principal cause of sea-ice melt in the Antarctic.
Acknowledging that the southern pole has been cooling since the 1980s would serve to undermine the paradigm that says the entire globe has been steadily warming due to human activity. In other words, a cooling Antarctica and Southern Ocean doesn’t advance the cause.
So instead of acknowledging that Antarctica and the surrounding Southern Ocean have been not been warming recently (as observational evidence clearly indicates), these advocates decided to issue a convoluted explanation about why sea ice grows in a warming world. Well, in the Southern Hemisphere, anyway. In the Northern Hemisphere, it is wholly accepted that warming causes sea ice to decline, which has been observed in the Arctic in recent decades. In the Southern Hemisphere, warming causes sea ice to grow. Confused? We’re just getting started.
As mentioned, advocates of the position that human-caused global warming causes sea ice to grow in the Southern Hemisphere first deny that Antarctica and the Southern Ocean have been cooling in recent decades (despite the observational evidence). Instead, they claim that the region has continued to warm, consistent with climate modeling and anthropogenic global warming expectations. They then can claim that a warming Southern Ocean and Antarctic continent have led to enhanced land ice melt along the coasts of Antarctica. This enhanced land ice melt has meant that the seas near the coasts have had new “cold, fresh layer” (from additional land ice meltwater) gliding over the surface of the ocean. This “cold, fresh layer” of run-off water from enhanced land ice melt keeps the warming oceans from warming up too much, and this “cold, fresh layer” travels far and wide, suppressing the ability of the warming surface waters to limit sea ice growth. In this way, the warming waters with a “cold, fresh layer” on top from all the additional land ice meltwater could be said to have caused the sea ice to grow. Again, this process only works in the Southern Hemisphere. It doesn’t work in the Northern Hemisphere, where the enhanced land ice melt in the Arctic does not result in sea ice growth, but a dramatic sea ice decline.
Surely this convoluted, ad hoc “explanation” for why anthropogenic global warming causes sea ice growth would not be taken seriously. Right? Well, actually, it has been taken very seriously. No less than the journal Nature embraced it. NSIDC’s director Mark Serreze promoted this makeshift conceptualization too. And, of course, the usual suspects in the print media were all to eager to agree that human CO2 emissions cause sea ice to grow in Antarctica (and simultaneously shrink in the Arctic).
Global warming expands Antarctic sea ice: In a polar paradox, melting land ice helps sea ice to grow.
Ocean warming may be a major driver of sea-ice expansion in the Antarctic, researchers report today in Nature Geoscience. … Scientists have known for several years that meltwater from ice sheets can form a cold, fresh layer on the ocean surface that protects sea ice from the warmer waters below. … “The paradox is that global warming leads to more cooling and more sea ice around Antarctica,” says Richard Bintanja, a climate researcher at the Royal Netherlands Meteorological Institute in Utrecht.
Global warming is creating MORE ice: Antarctic levels reach a record high because of climate change, scientists claim
Claim was made by Mark Serreze, director of the National Snow and Ice Data Centre … Shift is caused by water melting from beneath the Antarctic ice shelves … Scientists claim it is then re-frozen back on surface, increasing sea ice
New Paper Debunks Claim That Humans Cause Antarctic Sea Ice To Advance
A new paper shreds this ad hoc explanation linking human activity to sea ice growth in the Southern Hemisphere. Pauling et al. (2016) find that internal dynamics could explain the cooling and increase in sea ice extent in recent decades, and that an enhancement of the “freshwater input by an amount within the range of estimates of the Antarctic mass imbalance did not have any significant effect on either sea ice area magnitude or trend” — even if one assumes that anthropogenic forcing causes a decline in sea ice to offset the hypothetical growth trend due to enhanced “freshwater input”.
The possibility that recent Antarctic sea ice expansion resulted from an increase in freshwater reaching the Southern Ocean is investigated here. … Two sets of experiments were conducted from 1980 to 2013 in CESM1(CAM5), one of the CMIP5 models, artificially distributing freshwater either at the ocean surface to mimic iceberg melt or at the ice shelf fronts at depth. An anomalous reduction in vertical advection of heat into the surface mixed layer resulted in sea surface cooling at high southern latitudes and an associated increase in sea ice area. Enhancing the freshwater input by an amount within the range of estimates of the Antarctic mass imbalance did not have any significant effect on either sea ice area magnitude or trend.
A Better Explanation: Antarctica, Southern Ocean Have Been Cooling Since The 1980s
As mentioned above, Antarctica and the Southern Ocean have not been cooperating with anthropogenic “global” warming models. The region has been cooling for decades. And a cooling Southern Ocean has led to increasing sea ice trends. In other words, no convoluted explanations are necessary.
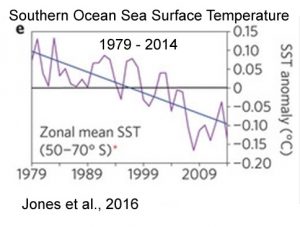
[A]ll of these studies reported a close relationship between [sea ice extent] and sea surface temperature (SST) whereby sea ice gain is associated with lower SSTs and vice versa. … Cooling is evident over most of the Southern Ocean in all seasons and the annual mean, with magnitudes approximately 0.2–0.4°C per decade or 0.7–1.3°C over the 33 year period [1979-2011].
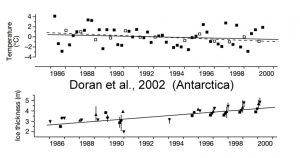
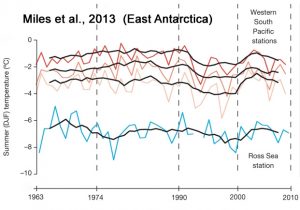
[O]ur spatial analysis of Antarctic meteorological data demonstrates a net cooling on the Antarctic continent between 1966 and 2000, particularly during summer and autumn.
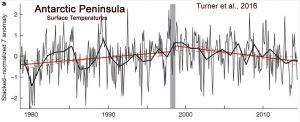
Here we use a stacked temperature record to show an absence of regional [Antarctic Peninsula] warming since the late 1990s. The annual mean temperature has decreased at a statistically significant rate, with the most rapid cooling during the Austral summer.
Over the 36-year satellite era, significant linear trends in annual mean sea-ice extent, surface temperature and sea-level pressure are superimposed on large interannual to decadal variability. Most observed trends, however, are not unusual when compared with Antarctic palaeoclimate records of the past two centuries. With the exception of the positive trend in the Southern Annular Mode, climate model simulations that include anthropogenic forcing are not compatible with the observed trends. This suggests that natural variability overwhelms the forced response in the observations, but the models may not fully represent this natural variability or may overestimate the magnitude of the forced response.
During 1950s – 1980s, Antarctica, Southern Ocean Warmed, And Sea Ice Declined
In the Northern Hemisphere, Arctic sea ice declines during warm phases (e.g., the 1920s to 1940s and the 1990s to present), and Arctic sea ice increases during cooling phases (like it did during the 1950s to 1980s). Similarly, when the Southern Ocean and Antarctic continent warmed during the 1950s to 1980s, sea ice declined. Since the 1980s, Antarctica and the Southern Ocean have cooled, and, consequently, sea ice area has grown. Not only that, but a majority of East Antarctic glaciers have been advancing since the 1990s. Again, no convoluted, ad hoc explanations are necessary. Cooling contributes to ice growth trends, and warming contributes to declining ice trends.
Another analysis of a 21-station data set from Antarctica by Comiso (1999) found a warming trend equivalent to 1.25°C per century for a 45-year record beginning in the 1950s but a slight cooling trend from 1979 to 1998. The slight cooling trend for this later 20-year period also was confirmed via analysis of surface temperatures over the whole continent, as inferred from satellite data.
[S]ea surface temperatures and surface air temperatures decreased during 1979–2011, consistent with the expansion of Antarctic sea ice. In contrast, the Southern Ocean and coastal Antarctica warmed during 1950–1978.
We present the first proxy record of sea-ice area (SIA) in the Ross Sea, Antarctica, from a 130 year coastal ice-core record. High-resolution deuterium excess data show prevailing stable SIA [sea ice area] from the 1880s until the 1950s, a 2–5% reduction from the mid-1950s to the early-1990s, and a 5% increase after 1993.
Despite large fluctuations between glaciers—linked to their size—three epochal patterns emerged: 63 per cent of glaciers retreated from 1974 to 1990, 72 per cent advanced from 1990 to 2000, and 58 per cent advanced from 2000 to 2010. … Indeed, several studies report increasing sea-ice concentrations in the study region from approximately 1980 to 2010, which is consistent with the predominance of glacier advance since 1990, when above-average sea-ice and fast-ice concentrations could have suppressed calving by increasing back-pressure on glacier termini. In contrast, reduced sea ice concentrations from the 1950s to the mid 1970s are consistent with glacier retreat during the 1960s and 1970s, when air temperatures were also increasing along the Pacific coast.
Sea Ice Trends In Antarctica Are Incompatible With An Anthropogenic Or CO2 Influence
The reason why advocates of an alarming anthropogenic influence on climate are so intent on “explaining” why warming causes sea ice to grow in the Southern Hemisphere is simple: what has been observed with Antarctic sea ice undermines the claim that anthropogenic global warming is predominantly responsible for polar sea ice trends. And the observation that Antarctica warmed during the 1950s to 1980s, when CO2 levels were in the “safe” range (under 350 ppm), but it has cooled since the 1980s as CO2 levels exploded past 400 ppm, is also very incompatible with the conclusion that humans determine the ice trends in the southern polar climate with their CO2 emissions.
Of course, what has been happening in Antarctica is entirely consistent with what would be expected with natural or internal variability, and not what would be expected from models of rapidly growing CO2 concentrations.
During phases of deep convection the surface Southern Ocean warms, the abyssal Southern Ocean cools, Antarctic sea ice extent retreats, and the low-level atmospheric circulation over the Southern Ocean weakens. After the halt of deep convection, the surface Southern Ocean cools, the abyssal Southern Ocean warms, Antarctic sea ice expands, and the low-level atmospheric circulation over the Southern Ocean intensifies, consistent with what has been observed during the recent decades.
At some point it must be acknowledged that something is seriously wrong with climate models that presume anthropogenic influences dominate the trends in polar sea ice. One wonders what the next makeshift “explanation” will be for a likely increase in Arctic sea ice extent at some point in the near future, or as the warming phase in the Arctic draws to a close in the coming years.


Interesting, all that, one of the ideas they missed seems to be an occilation theory. Im in my 70s and heard of that way back when. The North and the South are separate systems, dependant on the sun, orbit, sun output, our position in space determining the heat influx to those areas. Sometimes the north is warmer, sometimes the South. And sometimes the heat is low for both. So highly specialized scientists have forgotten this, or is man to blame?
No, opposite-phased hemispheric oscillations do not correlate with the rapid increase in anthropogenic CO2 emissions, strongly suggesting they are internal to the climate system, connected to the multi-decadal oscillatory redistribution of ocean heat between hemispheres. This out-of-phase warming and cooling between hemispheres has also been observed to occur on centennial and millennial scales, connected to the Intertropical Convergence Zone (ITCZ). Generally speaking, the cooling and warming amplitudes are much more pronounced in the Northern Hemisphere than in the Southern Hemisphere. For example, the Arctic SSTs/region cooled by about -1.5 C between the 1940s and 1980s (before it began warming again in the 1990s), whereas the cooling in Antarctica that began in the ’80s has been more muted — just tenths of a degree. While the Northern Hemisphere in general cooled by about -0.5 C from the 1940s to 1970s, the Southern Hemisphere showed no trends in either direction. Each polar region is about to change sign (warming in the Antarctic, cooling in the Arctic) within the next decade or so. It’s already begun in the North Atlantic, as seen here: http://www.climate4you.com/images/NODC%20NorthAtlanticOceanicHeatContent0-700mSince1979%20With37monthRunningAverage.gif
http://www.nature.com/srep/2015/150310/srep08909/full/srep08909.html?WT.ec_id=SREP-20150317
A prominent feature of recent climatic change is the strong Arctic surface warming that is contemporaneous with broad cooling over much of Antarctica and the Southern Ocean. Longer global surface temperature observations suggest that this contrasting pole-to-pole change could be a manifestation of a multi-decadal interhemispheric or bipolar seesaw pattern, which is well correlated with the North Atlantic sea surface temperature variability, and thus generally hypothesized to originate from Atlantic meridional overturning circulation oscillations. Here, we show that there is an atmospheric origin for this seesaw pattern. The results indicate that the Southern Ocean surface cooling (warming) associated with the seesaw pattern is attributable to the strengthening (weakening) of the Southern Hemisphere westerlies, which can be traced to Northern Hemisphere and tropical tropospheric warming (cooling). Antarctic ozone depletion has been suggested to be an important driving force behind the recently observed increase in the Southern Hemisphere’s summer westerly winds; our results imply that Northern Hemisphere and tropical warming may have played a triggering role at an stage earlier than the first detectable Antarctic ozone depletion, and enhanced Antarctic ozone depletion through decreasing the lower stratospheric temperature.
http://www.climate.unibe.ch/~stocker/papers/jouzel07sci.pdf
Atmospheric circulation and/or efficient circumpolar oceanic currents can contribute to distribute such climatic signals around Antarctica. This detailed comparison between EDC and EDML records further supports the thermal bipolar seesaw hypothesis, which postulates that abrupt shutdowns and initiations of the Atlantic meridional overturning circulation produce slow warmings and coolings in the Southern Ocean and Antarctic region.
http://www.nature.com/nature/journal/v457/n7233/edsumm/e090226-02.html
Theoretical models and observational data have long suggested that the Northern and Southern Hemisphere climates behave in a seesaw-like fashion: when the northern ocean warms, the southern ocean cools and vice versa.
http://www.sciencedirect.com/science/article/pii/S0277379115000554
A review of the bipolar see–saw from synchronized and high resolution ice core water stable isotope records from Greenland and East Antarctica
Numerous ice core records are now available that cover the Last Glacial cycle both in Greenland and in Antarctica. Recent developments in coherent ice core chronologies now enable us to depict with a precision of a few centuries the relationship between climate records in Greenland and Antarctica over the millennial scale variability of the Last Glacial period. Stacks of Greenland and Antarctic water isotopic records nicely illustrate a seesaw pattern with the abrupt warming in Greenland being concomitant with the beginning of the cooling in Antarctica at the Antarctic Isotopic Maximum (AIM).
Or, to put it more honestly, “we don’t really understand climate very well and we ought to stop pretending that we do.”
Pierre wrote:
“Observational evidence indicates that Antarctic sea ice has been advancing in recent decades”
False. Antarctic sea ice is currently at a record low.
data:
ftp://sidads.colorado.edu/DATASETS/NOAA/G02135/south/daily/data/SH_seaice_extent_nrt_v2.csv
David, do you know the difference between a trend and an anomaly?
https://notrickszone.com/wp-content/uploads/2016/10/Holocene-Cooling-Antarctica-f-SH-Sea-Ice-Extent-Jones16-copy.jpg
Kenneth: Can’t you analyze data?
Antartic sea ice is at a record low:
data source:
latest values (v2)
ftp://sidads.colorado.edu/DATASETS/NOAA/G02135/south/daily/data/SH_seaice_extent_nrt_v2.csv
Oooh. A record, huh? Since what year, David? Or is it the lowest extent ever….since 1979? Now that’s long-term. I ask because from 2013 to 2015, 16 first place monthly records were set for sea ice growth. And then we have this:
http://www.sciencedirect.com/science/article/pii/S0033589401922525
Antarctic surface waters were warm and ice free between 10,000 and 5000 cal yr B.P., as judged from ice-rafted debris and microfossils in a piston core at 53°S in the South Atlantic. This evidence shows that about 5000 cal yr B.P., sea surface temperatures cooled, sea ice advanced, and the delivery of ice-rafted detritus (IRD) to the subantarctic South Atlantic increased abruptly.
An ice-free Antarctic as recently as 5,000 years ago, when CO2 levels were in the 260 ppm range. What do you suppose caused Antarctic sea ice to disappear back then, David, since it couldn’t have been CO2? What do you think caused the sea ice to suddenly advance 5,000 years ago, since that wasn’t CO2 either? Describe the physical mechanism that used to cause sea ice to melt completely before humans took over as the cause in the latter part of 2016.
By the way, it’s Antarctic, not Antartic. We understand.
You didn’t answer Kenneth’s question,which is often the case with YOU as seen in many places where you don’t answer question.
Here it is again:
“David, do you know the difference between a trend and an anomaly?
https://notrickszone.com/wp-content/uploads/2016/10/Holocene-Cooling-Antarctica-f-SH-Sea-Ice-Extent-Jones16-copy.jpg
– See more at: https://notrickszone.com/2016/12/08/new-paper-debunks-ad-hoc-explanation-that-antarctic-sea-ice-has-been-growing-since-80s-due-to-human-activity/#comments “
(This comment has already been blocked once.)
Kenneth, can’t consult the data?
data source:
latest values (v2)
ftp://sidads.colorado.edu/DATASETS/NOAA/G02135/south/daily/data/SH_seaice_extent_nrt_v2.csv
You weren’t ever blocked, David. We love hearing from you. Now, see if you can answer these easy questions about the cryosphere.
1. Why is Antarctic sea ice no lower now than it was 100 years ago, David?
Edinburgh and Day, 2016
http://www.the-cryosphere.net/10/2721/2016/tc-10-2721-2016.pdf
In stark contrast to the sharp decline in Arctic sea ice, there has been a steady increase in ice extent around Antarctica during the last three decades, especially in the Weddell and Ross seas. In general, climate models do not to capture this trend … This comparison shows that the summer sea ice edge was between 1.0 and 1.7° further north in the Weddell Sea during this period but that ice conditions were surprisingly comparable to the present day [during 1897-1917] in other sectors.
http://phys.org/news/2016-11-antarctic-explorers-discovery100-years-epic.html [press release]
“We know that sea ice in the Antarctic has increased slightly over the past 30 years, since satellite observations began. Scientists have been grappling to understand this trend in the context of global warming, but these new findings suggest it may not be anything new. “If ice levels were as low a century ago as estimated in this research, then a similar increase may have occurred between then and the middle of the century, when previous studies suggest ice levels were far higher.” The new study published in The Cryosphere is the first to shed light on sea ice extent in the period prior to the 1930s, and suggests the [sea ice] levels in the early 1900s were in fact similar to today
2. Why does increasing CO2 cause cooling in Antarctica, David? Why is the CO2 greenhouse effect “weak” for Greenland too?
http://onlinelibrary.wiley.com/doi/10.1002/2015GL066749/full
Abstract: For this region [central Antarctica], the emission to space is higher than the surface emission; and the greenhouse effect of CO2 is around zero or even negative, which has not been discussed so far. We investigated this in detail and show that for central Antarctica an increase in CO2 concentration leads to an increased long-wave energy loss to space, which cools the Earth-atmosphere system.
For most of the Antarctic Plateau, GHE-TES [greenhouse effect as measured by the Tropospheric Emission Spectrometer] is close to zero or even slightly negative; i.e., the presence of CO2 increases radiative cooling. Over Greenland, the greenhouse effect of CO2 is also comparatively weak but invariably positive. An evaluation of monthly averages of GHE-TES shows that the increased cooling due to CO2 of Antarctica is strongest during austral spring and autumn. … Central Antarctica is the only place on the planet where increased CO2 concentrations lead to an increased LW energy loss to space [cooling]. In the Northern Hemisphere the lowest, but invariably positive, [CO2] forcing values are seen over Greenland and Eastern Siberia.
3. Why was the Arctic 2-3 degrees warmer than now 8,000 years ago, when CO2 levels were in the 250s ppm? What caused that, David?
https://www.sciencedaily.com/releases/2016/09/160928083222.htm (press release)
Researchers have found that 8000 years ago the Arctic climate was 2 to 3 degrees warmer than now, and that there was also less summertime Arctic sea ice than today.
4. What caused the Ross Ice Shelf to collapse a few thousand years ago, since CO2 levels were still in the 260s ppm range? If not CO2, what? Scientists say it was partly due to atmospheric warming. What caused the atmospheric warming?
Yokoyama et al., 2016
http://www.pnas.org/content/113/9/2354.short?rss=1
Widespread collapse of the Ross Ice Shelf during the late Holocene
The Ross Sea is a major drainage basin for the Antarctic Ice Sheet and contains the world’s largest ice shelf. Newly acquired swath bathymetry data and sediment cores provide evidence for two episodes of ice-shelf collapse. Two novel geochemical proxies, compound specific radiocarbon dating and radiogenic beryllium (10Be), constrain the timing of the most recent and widespread (∼280,000 km2) breakup as having occurred in the late Holocene. … Breakup initiated around 5 ka, with the ice shelf reaching its current configuration ∼1.5 ka. In the eastern Ross Sea, the ice shelf retreated up to 100 km in about a thousand years. Three-dimensional thermodynamic ice-shelf/ocean modeling results and comparison with ice-core records indicate that ice-shelf breakup resulted from combined atmospheric warming and warm ocean currents impinging onto the continental shelf.
5. Do you agree with Hobbs et al. (2016) that we cannot detect an anthropogenic signal in Antarctic sea ice trends, or do you believe we can? If so, what are the clear signs of an anthropogenic influence for the cooling Southern Ocean and frozen continent?
Hobbs et al., 2016
http://www.sciencedirect.com/science/article/pii/S0921818116300364
Over the past 37 years, satellite records show an increase in Antarctic sea ice cover that is most pronounced in the period of sea ice growth. … Detecting an anthropogenic signal in Antarctic sea ice is particularly challenging for a number of reasons: the expected response is small compared to the very high natural variability of the system; the observational record is relatively short; and the ability of global coupled climate models to faithfully represent the complex Antarctic climate system is in doubt.
I could go on and on. But we’ll start with these 5. Once you’ve provided detailed scientific answers, we’ll move on to the next 5. That’s why we love having you here, David.
I can tell you you are wasting your time with David. He’s a devout alarmist and he is not about to let facts, observations or hard results disturb his computer-modelled end-of-world infatuations.
I know. I’ve interacted with many dozen true believers like him who make up their own “facts” and who can’t answer simple questions. Usually they start in with the name-calling and personal insults a little earlier than David has though. I guess he reserves that for his blog, where he is free to call someone like Dr. Tim Ball a mosquito, a Nazi, and Satan.
The only reason I take the time to ask questions like these is to expose the vacuousness of the beliefs that David cherishes.
David , I believe that the Antarctic sea ice has dropped below the 1981 – 2010 mean only since Sept 2016 , and this time last year it was as much above the mean as it is currently below it.
The trends are more important and the RSS data from the start of satellite recording to date show the southern hemisphere warming trends to be much lower than those of the northern hemisphere.
Show how the lesson from 1964 got lost on some, thankfully the video is still available.
Here’s the quote —
I still want a nickel for every denier who quotes Feynman.
If he were alive, Feynman would be one of the most vocal scientists saying we are rapidly warming the Earth. Then he’d call all of us stupid.
I think Feynman would be most vocal about you putting words into his mouth.
But you are on a winner asking for a nickel for any quote from Feynman, so much more lucrative than any approving quote from you.
From Theodore White Astromet: The fact is that a drop in average temperature of around 4.5 degrees Celsius (which is 8.1 degrees Fahrenheit) helped to trigger the last ice age. It has happened before on this planet and I am forecasting that it will happen again by the mid 2030s.
We are on the verge of a major climate change to global cooling, and frankly, I keep saying that few are prepared for the reality of what is coming.
We really don’t know how “major” the coming cooling will be, as it could be only a few tenths of a degree. On the other hand, even a modest cooling seriously harms the local economy for places like Iceland or Canada or the northern UK. Cooler climates are also associated with more hurricanes, droughts, and extreme weather. Cold kills.
http://www.sciencedaily.com/releases/2015/05/150520193831.htm
Cold weather kills 20 times as many people as hot weather, according to an international study analyzing over 74 million deaths in 384 locations across 13 countries
http://link.springer.com/article/10.1134%2FS0016793213080227
Deep solar activity minima, sharp climate changes, and their impact on ancient civilizations
It is shown that, over the past ∼10000 years (the Holocene), deep Maunder type solar minima have been accompanied by sharp climate changes. … The climate changes that took place at ca 4.0 ka BP [4,000 years before present] and the deep solar activity minimum that occurred at ca 2.5 ka BP [2,500 years before present] affected the development of human society, leading to the degradation and destruction of a number of ancient civilizations.
http://www.sciencedirect.com/science/article/pii/S1040618211006707
Changes of solar activity, determining extensive environmental transformations, were also possibly responsible for the abandonment of the human coastal settlements of one of the most important Neolithic archaeological districts of Italy.
http://www.academia.edu/1411970/The_Influence_of_Climatic_Change_on_the_Late_Bronze_Age_Collapse_and_the_Greek_Dark_Ages
Mediterranean Sea surface temperatures cooled rapidly during the Late Bronze Age, limiting freshwater flux into the atmosphere and thus reducing precipitation over land. These climatic changes could have affected Palatial centers that were dependent upon high levels of agricultural productivity. Declines in agricultural production would have made higher-density populations in Palatial centers unsustainable. The Greek Dark Ages that followed occurred during prolonged arid conditions that lasted until the Roman Warm Period.