Note: Due to the very positive feedback of this post, I’ve decided to leave it up at the top spot for another day. -PG
==============================================
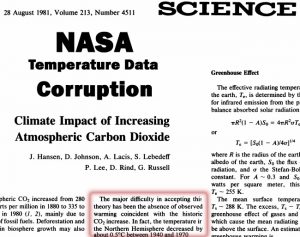
In 1981, James Hansen was the Director of the NASA Goddard Institute for Space Studies. He was also the lead author of a seminal paper published in the prestigious journal Science entitled “Climate Impact of Increasing Atmospheric Carbon Dioxide“. In the paper, Hansen and his colleagues reported (and illustrated with multiple graphs) the widely accepted 100-year (~1880-1980) record of hemispheric and global temperature changes. At the time, most climate scientists were reporting that the Northern Hemisphere’s (NH) temperatures had undergone a rapid warming of between +0.8 and +1.0°C between the 1880s and 1940. Then, after 1940 and through 1970, NH temperatures were reported to have dropped by about -0.5 to -0.6°C, a decades-long cooling trend which at the time had fomented widespread debate about global cooling in the scientific community.
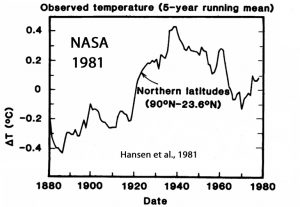
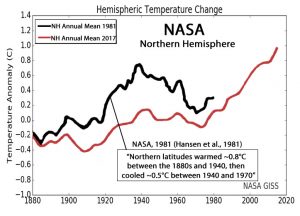
Like their peers, NASA’s Hansen and his co-authors indicated that the Northern Hemisphere had warmed by ~0.8°C between the 1880s and 1940, and then cooled by ~0.5°C between 1940 and 1970.
A graph of “observed temperature” for the Northern Hemisphere was included in the paper to illustrate these climatic trends.
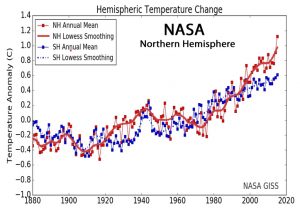
Today, NASA’s Goddard Institute for Space Studies is directed by Dr. Gavin Schmidt, a trained mathematician. (James Hansen retired from the position in 2013.) Schmidt’s version of the Northern Hemisphere’s temperature record for 1880-1980 looks vastly different than what his predecessor had illustrated in 1981. Instead of leaving the historically observed temperatures alone, NASA has invented new ways to portray the pre-1981 temperature history of the Northern Hemisphere.
2017 NASA Hemispheric Graph
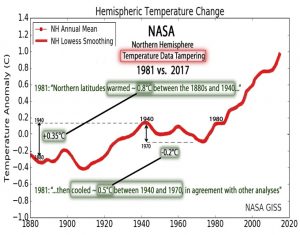
To subjectively summarize the wholesale adjustments to past temperature data, the +0.8°C warming between 1880 and 1940 has been reduced to +0.35°C. The -0.5°C cooling between 1940 and 1970 has been reduced to -0.2°C. And in NASA’s 2017 version of Northern Hemisphere temperatures, 1980 is now even with 1940. Neither year was warmer than the other. In the original 1981 NASA graph, however, 1980 was -0.3°C colder than 1940.
If the originally recorded observations for the Northern Hemisphere had not been erased from the temperature record, the pre-1981 trend would look like it does in the graph below (black trend line). In other words, if the temperature observations as they appeared in 1981 had not been tampered with, it would be clear the Northern Hemisphere’s surface temperatures have undergone an oscillation, or warming-cooling-warming cycle, with no significant net change from the earlier warming amplitude or rate (1880-1940) to the more recent one (1980s-present).
Why Did NASA Eliminate The Early 20th Century Warming And Mid-20th Century Cooling?
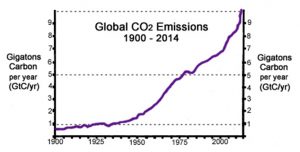
The fundamental reason why NASA has manipulated past temperature data is so that the historical climate record may conform to the IPCC models that presume variations in surface temperatures are predominantly determined by anthropogenic CO2 emissions. Fossil fuels consumption in particular and anthropogenic CO2 emissions in general plodded along steadily at about 1 GtC/year (gigatons of carbon per year) during the 1900 to 1945 period. Then, after 1945, human emissions exploded. They reached 4 GtC/year by the 1970s, 6 GtC/year by the 1990s, and 10 GtC/year by 2014.
NASA recognized that (a) anthropogenic CO2 emissions were not rising much at all while the surface temperatures were rising dramatically (1880s-1940s), and that (b) surface temperatures were cooling (1940s to 1970s) while anthropogenic CO2 emissions were surging upwards. These observed trends did not support climate modeling; instead, they undermined the models. So, to counteract this, NASA has undergone a decades-long effort to change past temperature data that do not adhere to modeled expectations. In other words, NASA has sought to suppress the 1880s to 1940 warming amplitude and rate, and they have warmed up the 3 decades of NH cooling by about +0.3°C. In this way, the overall 1880s-present trend will look linear rather than oscillatory, and it will also look more and more like the trends in anthropogenic CO2 emissions (above graph). When the facts don’t fit the models, NASA apparently changes the facts.
Non-Adjusted Temperature Data Appear To Correlate With 20th Century Solar Forcing
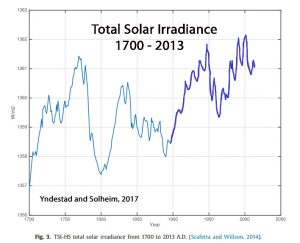
In a paper just published in the journal New Astronomy, scientists Yndestad and Solheim (2017) have released a reconstruction of solar activity (Total Solar Irradiance, or TSI) for 1700-2013. As explained here, the 20th Century contained the so-called Modern Grand Maximum of very high solar activity.
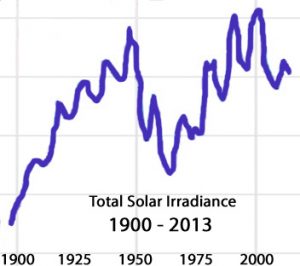
Taking a closer look at the 20th Century solar irradiance trend only, the (a) rapid rise in TSI for 1900-1950, the (b) dramatic drop in TSI during the 1950s to 1970s, and then the (c) abrupt 1980s to early 2000s increase in TSI all seem to correspond generally to the non-adjusted temperature trend for the Northern Hemisphere — prior to the NASA temperature data manipulation.
In fact, many other recently published surface temperature reconstructions indicate that the warming-cooling-warming oscillatory 20th Century trend may correlate with this solar forcing trajectory.
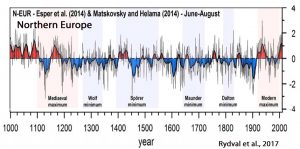
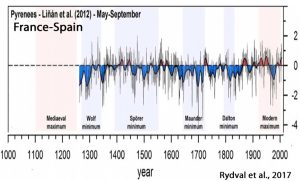
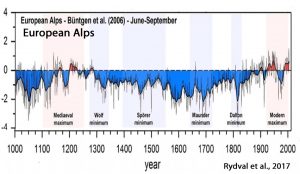
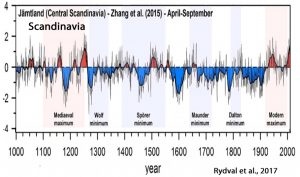
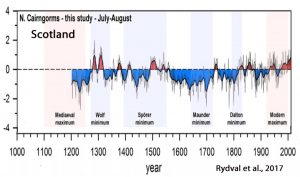
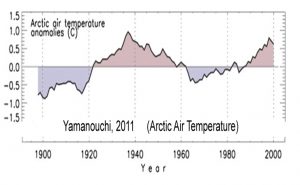
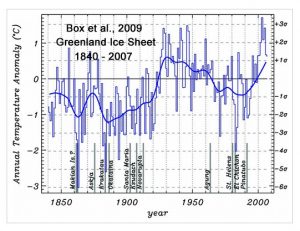
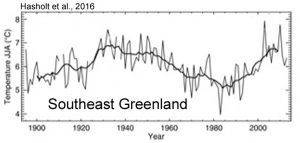
Rydval et al. (2017), for example, include several graphs of surface temperatures for Northern Hemisphere locations that show warming and cooling periods largely correspond to multi-decadal- and centennial-scale records of high (warming) and low (cooling) solar activity. In the NH graphs below, for example, notice how the temperature records follow a similar track that correspond with the non-adjusted (pre-1981) NASA temperature record: (a) rapid warming from around 1900 to the mid-20th Century, (b) rapid cooling for a few decades, and then (c) another warming ascent from about the 1970s or 1980s onward. Also notice that the mid-20th Century peak warmth is not significantly different than the warmth achieved in the last decade or two, again affirming an oscillatory pattern rather than a linear one.
“[T]he recent summer-time warming in Scotland is likely not unique when compared to multi-decadal warm periods observed in the 1300s, 1500s, and 1730s … [E]xtreme cold (and warm) years observed in NCAIRN appear more related to internal forcing of the summer North Atlantic Oscillation. … There is reasonable agreement in general between the records regarding protracted cold periods which occur during the LIA and specifically around the Maunder solar minimum centred on the second half of the seventeenth century and to some extent also around the latter part of the fifteenth century coinciding with part of the Spörer minimum (Usoskin et al. 2007).”
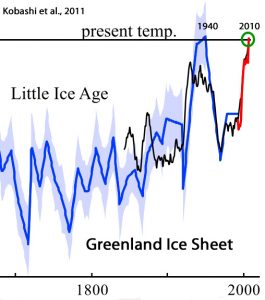
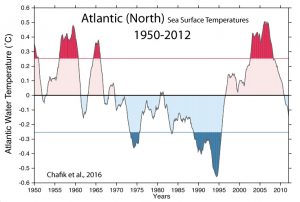
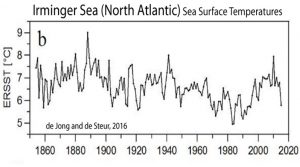
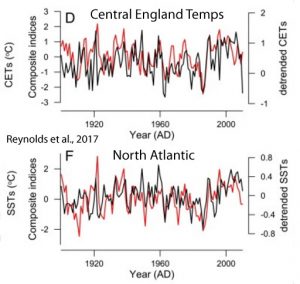
Temperature records for many other regions within the Northern Hemisphere (as well as several from the Southern Hemisphere) may also align with the original (non-adjusted) NASA temperature observations and recent reconstructions of TSI. So as not to cross the threshold of excessiveness, only a small portion of the many similarly correlative warming-cooling-warming temperature reconstructions available are included below.
Yamanouchi, 2011 (Arctic)
Box et al., 2009 (Greenland Ice Sheet)
Hasholt et al., 2016 (Southeast Greenland)
“We determined that temperatures for the ablation measurement periods in late July to early September were similar in both 1933 and the recent period [1990s – present], indicating that the temperature forcing of ablation within the early warm period and the present are similar.”
Kobashi et al., 2011 (Greenland Ice Sheet)
Chafik et al., 2016 (Atlantic, North)
de Jong and de Steur, 2016 (Irminger Sea, North Atlantic)
Reynolds et al., 2017 (Central England, North Atlantic)
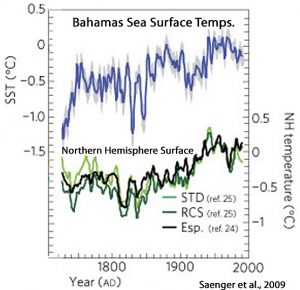
Saenger et al, 2009 (Bahamas, Northern Hemisphere)
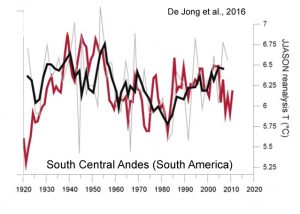
De Jong et al., 2016 (Andes, South America)
“[T]he reconstruction…shows that recent warming (until AD 2009) is not exceptional in the context of the past century. For example, the periods around AD 1940 and from AD 1950–1955 were warmer. This is also shown in the reanalysis data for this region and was also observed by Neukom et al. (2010b) and Neukom and Gergis (2011) for Patagonia and central Chile. Similarly, based on tree ring analyses from the upper tree limit in northern Patagonia, Villalba et al. (2003) found that the period just before AD 1950 was substantially warmer than more recent decades.”
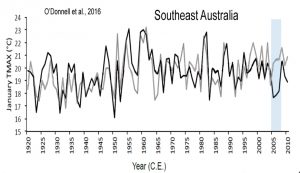
O’Donnell et al., 2016 (Southeast Australia)
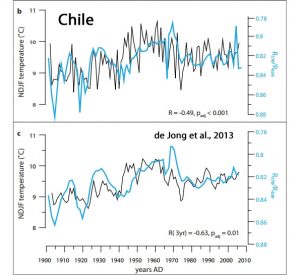
de Jong et al., 2013 (Chile)
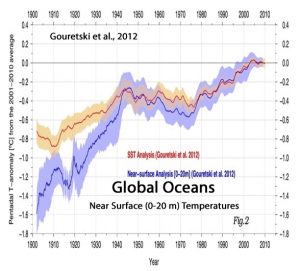
Gouretski et al., 2012 (graph) (Global Ocean 0-20 m)
To summarize, then, there seems to be no scientific justification for NASA’s conspicuous temperature data tampering. From all appearances, the removal and/or doctoring of observed temperature data from the pre-1981 period was a tendentious act designed to change the appearance of graphs to fit climate models that presuppose a deterministic anthropogenic influence. NASA’s apparent manipulation of climate science endangers the reputation of scientists across all disciplines. It should be stopped immediately before even more credibility is lost.



For me the question is not why they did this, but how did they justify the changes.
There has to be a scientifically valid reason to support changes that are currently several tenths of a degree different than in 1981. For the layman getting the math right is complicated, but for mathematicians getting a global result isn’t that difficult. Combine that with knowledge of bias in the data that needs to be removed and you should be able to arrive at a result that is reasonably correct.
The only changes will come from different reasons to tackle the bias problem. That means the results have to be rationalized and recorded. Any change absolutely must be accompanied with a rationale.
I really have seen very little rationale for changing the homogenization process and “warmists” should be able to point us deniers to exactly where this information is.
Years ago I tried to publish a paper about global temperature using temperature trend analysis in stead of the usual averaging after homogenization (BTW the paper was not accepted).
One of the “criticism” of the reviewers was that “sophisticated” climate models are used to fill the gaps/to do the homogenization. I am very suspicious that large areas without temperature measurements are “filled/homogenized” with data according to climate models,which may explain why the adjustments “follow” the expectations of the climate models.
I am afraid even they are not aware of the physics freshman error of mixing models and measurement
“I am afraid even they are not aware of the physics freshman error of mixing models and measurement”
Don’t worry. THey know PERFECTLY well WHAT they are doing and WHY and they get monthly reminders of their succes in their bank accounts.
What is worse, fraud or incompetence?
Not sure, but they seem to be very competent at their fraud.
No, they have been well and truly caught out.
A competent person would not get caught. 🙂
Fraud is far worse than incompetence PvanT. Fraud is a deliberate act of deceit. Incompetence is a case of not knowing.
@Don from OZ
Of course, incompetence can’t persist in that context without the assent of someone who had the responsibility to stop it, but didn’t. So, at some level there must be deceit. Either that, or there is a vast overabundance of incompetence. At least that’s how it seems to me.
“Either that, or there is a vast overabundance of incompetence”
Its called “Climate Science™”!
Reasonable Skeptic wrote:
“For me the question is not why they did this, but how did they justify the changes.”
Study and learn, man:
“Thorough, not thoroughly fabricated: The truth about global temperature data: How thermometer and satellite data is adjusted and why it *must* be done,” Scott K Johnson, 1/21/16.
http://arstechnica.com/science/2016/01/thorough-not-thoroughly-fabricated-the-truth-about-global-temperature-data/
That link has been shown many times to be a load of total propaganda pap written by a rabid alarmista.
The guy is linked to the anti-science “climate feedback” propaganda site with links to the “rapid response team”
PROPAGANDA PAP from the very top !!!
But its all you have, isn’t it, rotten appell.
More on the tampering, (as you know).
https://realclimatescience.com/2016/10/more-on-the-noaa-texas-temperature-fraud/
https://stevengoddard.wordpress.com/data-tampering-at-ushcngiss/
And finally,…
“100% Of US Warming Is Due To NOAA Data Tampering”
https://realclimatescience.com/2016/12/100-of-us-warming-is-due-to-noaa-data-tampering/
Read it! Loved the bait and switch.
Climate is an accumulation of weather. There is no way that instruments, be they thermometers or anenometers or any of the other devices used for collecting weather data, can record anything other than weather.
In fact nothing exists except weather. There is no way of measuring “climate” and the temperatures are what they are even if, as Johnson says, the measurements weren’t perfect. They aren’t perfect now — nothing ever is — except that now they accord with a political imperative, namely that CO2 is to be blamed for global warming and since the correlation between that essential gas and the temperatures of most of the 20th century is poor to downright non-existent it is hardly surprising that activist scientists have taken steps to “correct” that “error” rather than admit that their models are rubbish and then go out and get a proper job!
As someone who has spent much of his working life involved with writing and the usage of words, Johnson’s opening paragraph is all the evidence I needed that I was in for a feast of flannel, obfuscation and the sort of linguistic gymnastics that remind me of the old “find the lady” game. (I think Steve McIntyre called it the pea under the thimble.)
And David Appell’s argument that surface adjustments reduce the warming trend is just one more example of the distraction game. Assuming that the adjustments are necessary (though Johnson’s case has more holes in it than a colander) what they do to the trend is irrelevant. The bottom line is that unadjusted (but presumably accurate?) thermometer readings from 1900 onwards do not support the hypothesis —— correction, “contradicf the hypothesis” —— that CO2 is the prime cause of late 20th century warming.
Furthermore those same figures do support the hypothesis that the prime cause is that damn’ great ongoing thermonuclear explosion 93 million miles away which is what most of us — scientists included — have believed for centuries.
“The bottom line is that unadjusted (but presumably accurate?) thermometer readings from 1900 onwards do not support the hypothesis —— correction, “contradicf the hypothesis” —— that CO2 is the prime cause of late 20th century warming.”
Then what is?
Newminster wrote:
“In fact nothing exists except weather. There is no way of measuring “climate” and the temperatures are what they are even if, as Johnson says, the measurements weren’t perfect.”
Massive understanding.
Climate is the average of weather, over a time period of at least (WMO recommends) 30 years or more.
Do you know how to calculate an average?
Since you believe this is true, why is it that when I provided multiple links to graphs and papers indicating Antarctic sea ice has been on a long-term (35+ years) advancing trend, and the Southern Ocean has been on a long-term (35+ years) cooling trend, in response you provide a link to a blog that showed the sea ice anomaly for 2016, one year? Is it because you only like the “30 years or more” data when they suit your beliefs, and you ignore and deny the “30 years or more” data when they don’t? Rhetorical question.
What link was that I purportedly offered?
Your link is far too generic.
I want the quality statements that accompany each and every change. Having worked with creation of official government data products in the past, that is exactly what we did.
The methodology is explained in many scientific papers published over the years.
Is there some reason you can’t read them?
PS: What is a “quality statement?”
If you don’t understand the adjustments, WHY DON’T YOU GO LEARN AND READ THEIR PAPERS?
“Thorough, not thoroughly fabricated: The truth about global temperature data: How thermometer and satellite data is adjusted and why it *must* be done,” Scott K Johnson, 1/21/16.
http://arstechnica.com/science/2016/01/thorough-not-thoroughly-fabricated-the-truth-about-global-temperature-data/
Again that MORONIC paper.
FFS, Appell , you KNOW its a LOAD OF CRAP.
Everybody knows its a LOAD OF CRAP
Find something that isn’t, because you idiocy is becoming tediously boring
“If you don’t understand the adjustments, WHY DON’T YOU GO LEARN AND READ THEIR PAPERS? ”
The paper is far too generic. It is like saying “your house comes painted” on your purchase agreement.
It’s a very good article. But what prevents you from reading the original papers?
I find it strange, after reading an article that cites 20-30 original papers, that a question is raised about reading original papers. Under the circumstances, this sound more like a tiresome mantra than a serious counter-argument.
BTW, why is there so much more consistency with other data (such as total solar irradiance, as shown above (or for that matter the troposphere temps)) when one looks at the unadjusted as opposed to the adjusted surface temperature data? To me that’s a giveaway that something isn’t kosher with the present adjustments. (Karl Popper notwithstanding, that kind of consistency is damned important for working scientists.)
We are living in a climate model. It makes you feel like Truman Burbank in The Truman Show.
You’d be hard pressed to find local, unadjusted, not UHI contaminated, temperature graph anywhere from NH to match GISS NH temperature graph.
http://hidethedecline.eu/pages/ruti.php
Even these tampered temperatures can not produce alarming climate sensitivity figures. TCR/ECS calculated from untampered temperatures would be indistinguishable from zero.
This data torturing would be comical had it not so far reaching effects.
To attempt to identify any CO2 effect on temperature, you have to look away from the major El Nino transients and effects.
When you do that you get…..
No warming before the El Nino..
https://s19.postimg.org/iwoqwlg1f/UAH_before_El_nino.png
https://s19.postimg.org/y6om3sbjn/RSS_Before_El_Nino.jpg
No warming between the end of the step in 2001 and the beginning of the 2015 El Nino
https://s19.postimg.org/b9yx58cxf/UAH_after_El_nino.png
https://s19.postimg.org/im6e8dgxf/RSS_pre_2015.png
NO WARMING apart for the 1998 El Nino step.
In RSS, even the current El Nino has already dropped back down to the ZERO trend line from 1997-2015, with more cooling to come.
https://s19.postimg.org/qp3u91to3/RSS_El_Nino_trend.png
That means that apart from the El Nino and its effects, there is NO WARMING in either satellite temperature data set.
Considering that CO2 has climbed significantly in that time, that tells us that the ECS is basically ZERO.
There is absolutely NO CO2 WARMING EFFECT in the whole satellite data set.
If you have watched the changes over time like some of us have, Tony Heller, Willis Eschenbach, Paul Homewood, and myself, among many, you would have seen that the changes are very small, week to week, station by station. But they always add in the same directions, to cool the past and warm the present. It’s like boiling a frog. If the changes are small enough, and seem random enough, perhaps no one will notice. Well, we have noticed.
Wrong. Surface adjustments REDUCE the long-term warming trend.
See Karl et al, Science 2015 Figure 2
roflmao..
They got rid of the 1940’s peak, and disrupted the whole pattern of he historic data.
Karl is one of the chief scammers.. and you believe his pal-reviewed propaganda scam.
That is seriously anti-science of you.
Yes you ARE wrong, rotten-appell
https://realclimatescience.com/wp-content/uploads/2016/05/2016-05-09054903.png
https://realclimatescience.com/wp-content/uploads/2017/01/Screen-Shot-2017-01-07-at-6.34.28-AM.gif
REAL DATA will always destroy your lies and mis-information.
By the way, Ed, how would you choose to deal with the biases in the raw data, from measurement methodologies and the urban heat island effect?
I’m sure you think the Mann hockey stick is a accurate representation of past temperature.
It would be good to remove at least part of the 1940s blip,
but we are still left with “why the blip”.
Just a coincidence, right? Useful idiot.
http://www.di2.nu/foia/1254108338.txt
I’m not allowed to substantive post a reply here.
You have never posted a substantive reply to anything, anywhere.
Just baseless propaganda pap and misinformation.
“…how would you choose to deal with the biases in … the urban heat island effect?” – D.o.A.
For one, I would not RAISE the surrounding temperatures to match them, as is being done.
That’s not what’s being done — that would give a false climate signal.
See “data homogenization.”
According to an Australian insider (talking as he thought to someone “on side”) that is exactly what the BOM has been doing.
“Man-made” global warming indeed!
Note that the homogenisation routines arrived JUST IN TIME for the data adjustments needed to try to help the AGW scam.
You still haven’t woken up to the FACT that “homogenisation” was invented by the guys at CRU (Stott, iirc) to give justification to the necessary warming adjustments.
BEST have devised a same/different method for the same purpose. Justification of fabrication of warming trends that DO NOT exist in real data
And don’t let’s start on the NON-adjustments for massive UHI effects. So obvious.. yet totally did-counted or even adjusted the wrong way.
The whole system is a FARCE… and the other 5 letter word, a FR**D
No reply, Ed?
The corrections clearly reduce the long-term warming trend. I would think that make you happy. No?
BTW, what do you think of all the adjustments to the satellite data? They’re trying to correlate over 13 different satellites now.
I don’t doubt that most of the changes, taken individually, do have a rationale behind them – that is, they CAN be justified. What we cannot know is, what other changes COULD have been made, and COULD have been justified, but were not. There are plenty of issues around the various biases and homogenisations: enough to come up with a variety of answers, if one is so inclined.
It isn’t possible for us, as outside layfolk, to critique the changes and judge whether, individually, they are justified or not. But what we observe is that the 1981 record (for which Kenneth here provides some evidence of a correlation with TSI – no doubt disputed by others) has been progressively altered, both UP and DOWN as appropriate, to give an increasingly good agreement (or less bad, if you prefer) with the profiles that the CMIP program expects.
Now, it COULD be right. All the up and down changes might be correct. But it seems, on the face of it, very counter-intuitive that this could be so. We can’t know. But it puts a very heavy onus upon the NASA folk to justify, in full and open discussion with the sceptics, every element of it. As they say “extraordinary claims require extraordinary evidence”. And there is a helluva lot of (anecdotal) historical evidence of the weather over the period under discussion that needs to be explained away as well.
In short, it LOOKS like a stitch-up. NASA needs to explain in very great detail why it isn’t.
Once again, thanks to the indefatigable Kenneth Richard for researching this and assembling it in the clear and challenging style that is his trademark.
mothcatcher 16. January 2017 at 6:43 PM | Permalink | Reply
“I don’t doubt that most of the changes, taken individually, do have a rationale behind them – that is, they CAN be justified.”
You’ll get over it.
Honest people have such enormous problems to accept the existence of networks of systematic fraudsters who are persistent enough to infiltrate entire organisations and replace honest scientists with impostors. *IF* there was ever an honest guy at NASA.
If ALL evidence points to, say NASA , behing a fraud from start to finish, and NONE to the opposite, why do you assume that Hansen OR Schmidt are honest?
mothcatcher says:
“I don’t doubt that most of the changes, taken individually, do have a rationale behind them – that is, they CAN be justified. What we cannot know is, what other changes COULD have been made, and COULD have been justified, but were not.”
There ARE tests to look for made-up data. These tests have been used in court cases of financial fraud. One of the simplest is Benford’s Law. I applied it to NASA GISS data here. The test was negative for its type of fraud:
http://davidappell.blogspot.com/2012/09/on-claims-of-data-manipulation.html
I don’t think any suggests that the data is MADE UP(unless you regard homogenization as ‘made up’). Your comment is not relevant here and would seem to be a misdirection.
@mothcatcher
Appell’s comments are ALWAYS “misdirection.”
Still no visitors to your putrid sewer-site, rotten-appell??
Oh diddums.
Of course GISS don’t make up data roflmao !!!
https://s19.postimg.org/lcp5couwj/201609_land.gif
See all that grey area… NO DATA.
It HAS to be fabricated. Seems like anything else, you software application is found wanting.
And did you know that pretty close to half of the USA data has “E” next to it. DOH !
in-fill / fabricate / make it up !!!
Sort of like you do.. a sci-fantasy script is all you are capable of.
Isn’t this just a prime example of Gresham’s law transplanted from economics into modern alt-Climatism where instead of Bad money driving out Good Money we have Bad Data driving out the real McCoy?
Just got the chance to read this. WOW! The entire pattern of behavior screams deceitful data manipulation and even raises suspicions of outright fraud. No other industry or sector would ever get away with that kind of stuff. An investigation is warranted, if not a complete NASA GISS house-cleaning.
Pierre.
Consider a single temperature station.
From 1900-1940, a caretaker reads it every day at 12 pm noon.
In 1941, a different caretaker replaces the thermometer, and then reads it every day at 4 pm, from 1941-1995.
From 1996-present, a new digital thermometer sends, by satellite/internet every four hours, temperature readings, including at 2 pm and 6 pm.
Question: How would you construct a time series for the temperature of this location from 1900-present?
You shouldn’t even try, but GISS etc do
According to an Australian insider (talking as he thought to someone “on side”) that is exactly what the BOM has been doing.
“Man-made” global warming indeed!
Why shouldn’t you try?
PS: THe UAH and RSS satellite teams do the same, but to an even greater extent.
You have just proven you have ZERO idea of how RSS and UAH are calculated.
You have proved YET AGAIN, that you are nothing but a MORONIC IDIOT with a mouth
If you really think there is any comparison between the collection of data in the satellite data set, and the collection of surface data..
…. you are even more of a brain-dead idiot than even I thought you were.
Down there with a single celled amoeba !!
@D.o.Appell
That’s been dealt with ad nauseam.
https://www.youtube.com/watch?v=Gmc5w2I-FCA
The way you keep flitting from one topic to another makes me wonder if you are off your Ritalin. Or perhaps you are doing that deliberately to try to bog down the thread. Or both.
Bottom line. You don’t want to have a discussion of the issues. You only want to confuse them. You’re just a worthless troll.
Already, replies to Ed and Y have been blocked.
Some blogger is afraid of replies that aren’t in his thougth bubble.
David, this blog is inundated with spammed comments selling products. Consequently, WordPress puts a sensitive spam blocker on all comments. Sometimes comments slip through without moderation (if they contain no tripping characters or words), but most of the time everyone‘s comments are held in abeyance (sometimes they seem to just disappear without a trace) to insure they are not spam. Inconvenient, yes. But since you told us you would never comment here again 10 days ago… Why are you so alarmed that you have to wait, like everyone else, for your comments to be cleared as not-spam?
David has been making this complaint for over a year now, and I’ve explained al this to him before. Not only does his lot demand to be the only ones heard, but also done so immediately – even though this is not even his house. He’s been a poorly behaved guest since his first appearances. Somewhere his upbringing went awry, if I may be so bold.
Gees you are CRY-BABY, appell..
Get a life !!
Pierre, I know for a fact that a certain fraction of my replies here never appear, even for moderation.
Why does you site do that?
No answers, Pierre?
That’s about what I expected.
No answers to a load of MORONIC GARBAGE..
Why should anyone even bother. !!!
Why should you construct a time series when you already have one?
Because it contains biases.
Have you done anything at *all* to try and understand this? Many people have written lay articles about it….
PS: Adjustments REDUCE the long-term warming trend.
Kenneth Richard joins Paul Homewood and Tony Heller in mercilessly exposing how engaged NASA/GISS are in global temperature adjustments and manipulations. As Ed Caryl states above it always moves in the ‘right’ direction to support AGW. An entire series of amazing coincidences!
NASA/GISS (and NOAA, too) have been well and truly busted here, and if Donald Trump does his job properly those guys should be in BIG trouble.
Maybe you and all like-minded people could tweet Trump about Gavin an his antics.
Science be damned this should be a political temperature adjustment.
chesire: I bet you haven’t spent 5 seconds understanding the need for corrections to the raw data.
Correct?
this apple fella is just a LIAR???? there is NO valid reason to alter the actual reading NONE……..the ONLY reason for doing that is the use stats to LIE.
Rotten Appell hasn’t the foggiest notion of what he is talking about. If he did, he would explain it. Instead he demands the we do so to him, as if he were the “teacher” and we were the “students.”
That’s a typical leftist ploy to deflect criticism, but we are tired of those schmucks pretending they know more than we do. THEY are the ones who want to make a CHANGE. Therefore, it is THEY who are obligated to “explain” what they see as the problem. Until they do, we owe them NOTHING.
So, come on, David. Let’s see what you’ve got. I.e., put up or SHUT UP!
@CheshireRed
When the warming = the adjustments = model “predictions”, something is indeed rotten in Denmark and beyond.
https://realclimatescience.com/100-of-us-warming-is-due-to-noaa-data-tampering/
Dirk H
I think you’ve missed the point I was making. The co-incidence of how the data moves inexorably in the direction of the models is what needs explaining- just shouting that there is fraudulent work going on does nothing for the debate. Throwing around accusations (even if justified!) will turn a lot of people off the discussion – especially those who might otherwise have been effective allies in the challenge.
Talk specifics, ask pertinent questions, and demand amswers. If they aren’t forthcoming, or are evasive, ask again. If you’re familiar with the example set by Steve McKintyre, you’ll know what I mean.
We don’t need a debate anymore. We need to shut off the life support system of the fraudsters. I am DISGUSTED that anyone still calls them scientists.
McIntyre’s work went NOWHERE, and many many groups have now confirmed the hockey stick, by many different methods.
M&M is consigned to a footnote of history. Meanwhile Mann appears in media stories nearly every day, and he’s won awards for his work.
The case is closed.
Awards for fraud.. How “climate science™” is that !! 🙂
In real science, obviously this don’t include NASA backed ‘climate science™’, the case is never, ever closed.
Only the irrational would say that any part of science “The case is closed.”.
Yeah because dividing the planet into 40 grid square — just large enough that most squares have at least one station, as the article describes — is obviously the best way to do it, and can’t be improved upon. SMH
According to the IPPC, they have detected the human CO2 signal since the 50’s, when its was cooling rapidly.
No, it was not “cooling rapidly.” In fact, it was barely cooling at all.
https://crudata.uea.ac.uk/cru/data/temperature/HadCRUT4.png
You idiot..
Trying to cover up the cooling with FAKED data.
https://climatism.files.wordpress.com/2014/02/nas.jpg
You KNOW that HadCRud is massively adjusted to remove the 1940’s peak
STOP LYING for once in your putrid little life.
Ha ha,
you part of the disinformation group,who go places on the internet to mislead or flat out LIE,with the intention of keeping people in the dark. Here you will ignore what Dr. Hansen and his team who said what others said similar,that there was a distinct cooling trend from the 1940’s to the 1970’s.
“Like their peers, NASA’s Hansen and his co-authors indicated that the Northern Hemisphere had warmed by ~0.8°C between the 1880s and 1940, and then cooled by ~0.5°C between 1940 and 1970.”
Stop it David, the bullcrap you spew out is well known in many places.
David Appell, has avoided the words of Dr. Hansen.
Gee in wonder why…………
You’re another one here with no science, no rational replies — just juvenile name-calling.
Nothing makes it easier to dismiss deniers than this. You should think about the impression you are leaving with others, and not just whatever instantaneous emotion you think you have to react to.
Yes, appell.. he note that you dismiss all the real science, the real facts, and the real data.
Stick to your science-fantasy writing, although even that option will soon disappear for you.
The impression you leave as a slimy low-down lying piece of human trash, should stand you ion good stead for your future job as a janitor
Gavin is stealing tax payer money under the guise of science. Fortunately for him he already has the answer and now he’s needs to show his work (as my Grade 5 teacher said) on how he got the answer. Unfortunately for him PEOTUS Trump will be changing things (like his budget). Hurry up warmers and copy all that ‘fudged’ data Gavin made.
You’re not qualified to judge Gavin or any other scientist. Period.
You certainly are not qualified to comment on any aspect of real science. PERIOD
You could hold a real job for more than a year at a time in, and ended up as a backwater science fantasy journalist who hasn’t touched any real science for a long, long time..
On top of that, you are almost certainly a paid operative of the AGW scam machine.
Are you blokes having a PERIOD? Why not leave that to some fair maiden like Naomi!!
But we’re qualified to pay them, right?
No, these suckers don’t even deserve a prison cell, just throw’em in the mud. If they’re so smart why don’t they have one of their oligarch sugardaddies like Grantham pay them for their cherished work.
Dirk, are you German?
So what are you paying for GISS salaries?
Gavis is a great scientist. The US is lucky to have him.
“Gavis is a great scientist.”
I don’t know who Gavis is, but Gavin Schmidt is a low-down shyster, specialising in mathematical mal-faeces.
No wonder you are constantly licking his a***.
“The US is lucky to have him.”
So you won’t mind when he get’s deported to the UK. 😉
Then the UK will be Lucky” to have him.
Down in Oz, we felt the same way when Lewendopey got moved to Bristol.
If jimmy you are a US citizen then keep in mind Gavin is US government employee and so your civil servant.
Whether he is a gardener or a scientist he is answerable to the US public, the US government administration including the president.
Another thing to note jimmy is whether or not Gavin is making up his data because he’s deranged or a political activist. If the former then he should be retired from his job and treated. If the latter then he MUST be sacked. Civil servants must not allow personal politics enter into their work, its against the rules!
Sad — you can’t disprove the science, so you personally denigrate people and make up lies about them.
Are you sure you’re not part of a totalitarian US movement?
The so-called science has been disproven MANY times.
The mal-adjustments have been proven MANY times.
And you have been PROVEN to be nothing but a low-level anti-science, mathematically illiterate, LYING, AGW lackey/hack/troll… MANY, MANY times
His crummy science has already been dealt with, David.
https://notrickszone.com/2017/01/16/massive-data-tampering-uncovered-at-nasa-warmth-cooling-disappears-due-to-incompatibility-with-models/comment-page-1/#comment-1157933
But, since you have nothing, you make things up to attack us with, then accuse us of not dealing with the science.
You are a bottom feeder.
You are a bottom feeder.
From the bottom of a sewer.
Eats, breathes and talks S**T !!
Yona: in your own words, what is wrong with the raw data corrections?
I bet you can’t say.
—
By the way, what do you think of the adjustments to the satellite datasets?
DoA – “in your own words, what is wrong with the raw data corrections?
I’ve already dealt with that by posting this
https://www.youtube.com/watch?v=Gmc5w2I-FCA
which you and others have ignored. The issue is complex, and I’m not going to waste time writing what you will never read. I agree with the Dr. Keen’s assessment.
I have also posted a link to one e.g., from John Daly’s web site on what is wrong with the adjustments, but to which you also haven’t responded.
See also Burt Rutan’s take on the matter.
https://www.youtube.com/watch?v=jPP7P43wulg
DoA – “By the way, what do you think of the adjustments to the satellite datasets?”
I think the agreement between the satellite and the Radiosonde data speaks for itself. Pity they don’t agree with the models or the “adjusted” ground data. No?
I have given you a LOT of material, and you just keep challenging me to repeat myself justifying why you are wrong. But since you are the one who is the alarmist, the obligation to prove AGW falls on you, not any of us. You are just a nasty little troll who isn’t interested in learning anything, only being a pest.
Now, keep you word, and get lost.
Maybe PEOTUS Trump needs a nudge in the right direction with a twitter campaign naming Gavin as the one to be investigated and way.
Now let see how outraged Appel gets cos his b**-buddie been dissed. 😉
Why should Gavin Schmidt be investigated, and for what?
The whole corruption and continual adjustment of climate data worldwide, always in the AGW supportive direction, the removal of the 1940 peak etc…. needs to be properly investigated.
Gavin, being at the tail-end of this, the person who is directly responsible of the FARCE that is GISS is the obvious place to start.
Even if he is not doing the mal-adjustment himself, he must still know it is being done, and is therefore responsible for promulgation of this data misrepresentation.
@David Appell – RE Gavin Schmidt
At the very least, Schmidt should NOT be allowed to get his paws on any data that isn’t secured against his tampering.
http://hockeyschtick.blogspot.com/2010/04/nasas-gavin-schmidts-lies-damned-lies.html
Just because you like incompetence and deceit doesn’t mean they should be the norm.
https://realclimatescience.com/2016/12/december-brings-even-more-spectacular-data-tampering-from-gavin-schmidt/
If he doesn’t know what he’s doing, it’s incompetence. If he does, it’s criminal malfeasance.
https://realclimatescience.com/?s=GAVIN+SCHMIDT
Y: You still have no idea why adjustments to the raw data, and you refuse to learn.
Why do you prefer to play dumb?
We do know. Far more than you do, that is for certain.
And they are almost uniformly unjustified, UHI is ignored, ALWAYS in line with the AGW scam.
You are not “playing” dumb.
YOU ARE DUMB.. Dumb is your only option.
@D.A.
It’s not legitimate “adjustments” that I’m concerned with, it’s the dishonest crooks who are making them. …like the ones who published the data analyzed here.
http://meteo.lcd.lu/papers/Conference_ICN/deBilt_raw_and_adjusted_temp.htm
No answers about the raw data corrections, Yona?
Why have’t you read the papers and articles to understand why scientists are doing them, and for what reasons?
Maybe too much trouble for you?
No “Trouble”
https://notrickszone.com/2017/01/16/massive-data-tampering-uncovered-at-nasa-warmth-cooling-disappears-due-to-incompatibility-with-models/comment-page-1/#comment-1158371
I can’t help it if you are either too stupid to understand it, or too dishonest to admit it.
tom0mason wrote:
“Maybe PEOTUS Trump needs a nudge in the right direction with a twitter campaign naming Gavin as the one to be investigated and way.”
Investigated for WHAT?
PS: Anyway Trump is far too busy selling America’s soul to Russia.
“PS: Anyway Trump is far too busy selling America’s soul to Russia.”
LOLOLOLOL
You are not even wrong enough to bother debunking most of the time. In short, YOU ARE A CLOWN!
Lubos Motl has you correctly pegged as…
“…stunningly sh***y subhuman crap…”
http://motls.blogspot.com/2012/07/have-muller-or-watts-transformed-agw.html#comment-605585774
You continue to prove him correct with every post.
Should have been “not even correct enough” but I was thinking along the lines of that stupid “not even wrong” meme. Apologies to thinking people out there.
roflmao…
you mean he is trying to work WITH the Russians, rather than trying to foment WWIII like Obarmy obviously wants to do.
Far better to get a working relationship with Russia, than get into bed with ISIS, which would be the Obama way.
And Gavin..
The whole corruption and continual adjustment of worldwide climate data, always in the AGW supportive direction, the removal of the 1940 peak etc etc… needs to be properly investigated.
Gavin, being at the tail-end of this, the person who is directly responsible of the FARCE that is GISS is the obvious place to start.
Even if he is not doing the mal-adjustment himself, he must still know it is being done, and is therefore responsible for ultimate promulgation of this data misrepresentation and probable ӺŖÂǛĐ.
Andy, Trump reads twitter maybe a ***strong*** campaign on that medium is required.
@ D.o.Appell- climate troll
Hillary was too busy selling America to the highest bidders, like Russia.
http://www.breitbart.com/big-government/2016/10/22/schweizer-wikileaks-show-clinton-campaign-chair-john-podesta-became-business-partners-vladimir-putin/
And Ukraine tried to help her.
http://observer.com/2017/01/ukraine-hillary-clinton-donald-trump-election/
The Trump Russia connection is false, just a smokescreen to cover Democrat shenanigans.
Surprise. Surprise. Further evidence that global warming is a far left hoax motivated by a warped political agenda.
The worst is all the papers and research that are based on these dubius
temperature series. Thousends of papers have to be rewritten or retracted, because they are based and correlated with wrong temperatures.
Svend: What efforts have you made to understand the methodologies used to correct temperature data for biases?
Just one, maybe?
Or zero?
You have made every effort to fabricate reasons for the unjustified mal-adjustments. But you excuses are nothing but science FANTASY (ie that discredited ars link you like to use)
The “adjustments™” are done to CREATE A WARMING BIAS, not to correct other bias.
That is their whole purpose. That is why homogenisation was invent at the beginning of the AGW-scam.
Everybody KNOWS that
Even you KNOW that… So stop your LYING and DECEIT.
Positive feedback on a post that starts with a photoshopped lie?
That’s hard to believe, unless your readers like lies.
http://davidappell.blogspot.com/2017/01/another-sleazy-photoshop-from-pierre.html
There is a difference between cut and paste work in a cartoon and photo shopping to mislead the public. A child can see that the header is a cartoon. Did you ever see a header in a scientific journal announcing data corruption? Don’t you have something better to do with your precious time as you said here before? Did you also promise somewhere to abstain from alcohol and drugs in 2017?
“… promise somewhere to abstain from alcohol and drugs in 2017?”
I don’t know if that will work. However it is reported he no longer kicks kittens.
And there’s that rotten-appell link again….
… to the deepest, most putrid sewer on the internet..
Most of the difference shown here is simply due to an incorrect comparison. You’re comparing “Northern Latitudes” to the whole Northern Hemisphere even though the former is clearly marked as constraining to 23.6N to 90N. The Hansen 1981 data is also Land-only, no SSTs.
In a correct comparison, contrary to your claim, the warming from 1880 to 1940 is actually slightly larger in the current dataset.
The cooling from 1940 to 1980 does reduce by about 0.2ºC in the correct comparison. This could probably be attributed partly to a large increase in stations, and more complete coverage, in the current record (about five times the amount globally). Also partly to recent GHCNv3 adjustments tracking TOBS changes, and movement of stations from warmer to colder sites.
PaulS,
https://realclimatescience.com/wp-content/uploads/2016/08/Cct3DOKUEAAUFQh-1.jpg
No less than the National Academy of Sciences produced a graph of the “Northern Hemisphere” (above link) that actually showed a cooling of more than -0.6 C between 1940 and 1970 — not 0.2 C as you claim. The NASA values of +0.8 C and -0.5 C for the NH are actually slightly conservative.
https://www.sciencenews.org/sites/default/files/8983
“[T]he weather in the first part of this century has been the warmest and best for world agriculture in over a millenium, and, partly as a result, the world’s population has more than doubled. Since 1940, however, the temperature of the Northern Hemisphere has been steadily falling: Having risen about 1.1 degrees C. between 1885 and 1940, according to one estimation, the temperature has already fallen back some 0.6 degrees, and shows no signs of reversal. Specific areas, of course, may experience changes markedly different from the average. During the warming period, temperatures in parts of Norway rose five times more than the hemisphere average, and since the cooling trend began again, Iceland’s temperature has dropped nearly 2.0 degrees, threatening continued existence of some crops.”
http://journals.ametsoc.org/doi/abs/10.1175/1520-0477%281980%29061%3C1356%3APCCAAP%3E2.0.CO%3B2
Evidence has been presented and discussed to show a cooling trend over the Northern Hemisphere since around 1940, amounting to over 0.5°C, due primarily to cooling at mid- and high latitudes. Some regions of the middle latitudes have actually warmed while others, such as the central and eastern United States, have experienced sharp cooling. A representative station for this latter region is Lafayette, Ind., which has recorded a drop of 2.2°C in its mean annual temperature from 1940 through 1978. The cooling trend for the Northern Hemisphere has been associated with an increase of both the latitudinal gradient of temperature and the lapse rate, as predicted by climate models with decreased solar input and feedback mechanisms.
I note you haven’t retracted the incorrect claim about early warming difference.
I didn’t say the cooling was 0.2C, I said the difference from the 1981 version is about 0.2C.
Those links don’t support a claim that NASA’s 1981 data was conservative on temperature slopes. The first is simply using a different (and widely considered incorrect) method of taking temperature change from absolute minimum to maximum of annual averages. Applying the same method to the current NASA met-station NH average also gives about a 1.1C rise. The second reports about -0.5C slope to 1976 from 1940, which would have been about the same as NASA at the time.
The Lafayette record is a good example of necessary adjustments. I’ve identified the record, which is listed as West Lafayette 6NW in the Berkeley database. I’ve overlayed the two and it’s definitely the same data. As shown on the Berkeley graphic, there is a documented TOBS change in late 1918, which explains nearly all of the recorded temperature increase. Then there is a record gap, after which it starts again at a substantially lower temperature, indicating a change to recording conditions. The temperature history shown in the raw data simply bears no relationship to those in other nearby stations, and these large “trends” are almost certainly artifacts of station changes.
I mean, it’s presented as a Purdue University record back to 1880 but Purdue University was founded in 1969. Institutions which merged to form the University were themselves only founded in 1916 and 1946. I would guess the station got moved around a bit along with administrative changes.
What, specifically, are you asking me to retract? Are you suggesting that Hansen et al. (1981) was purposely excluding available temperature data from certain locations in the Northern Hemisphere when they wrote that the Northern Hemisphere cooled by “about -0.5 C” between 1940 and 1970? The paper itself uses the word “Hemisphere” to refer to the -0.5 C cooling between 1940 and 1970.
And the evidence is overwhelming that the consensus in the 1970s and early 1980s that the Northern Hemisphere‘s temperature decreased by -0.5 or -0.6 C between 1940 and 1970 — before the data was manipulated to eliminate most of that cooling. I can supply dozens of quotes like below from the peer-reviewed literature. What are you basing your conclusions on, PaulS?
–
http://climate.envsci.rutgers.edu/pdf/RobockInternalExternalJAS1978.pdf
“Instrumental surface temperature records have been compiled for large portions of the globe for about the past 100 years (Mitchell, 1961; Budyko, 1969). They show that the Northern Hemisphere annual mean temperature has risen about 1°C from 1880 to about 1940 and has fallen about 0.5 °C since then
–
The globe (both hemispheres combined) was said to have experienced a cooling of -0.5 C between about 1960 and ’65. That too, has been eliminated, of course.
–
http://journals.ametsoc.org/doi/pdf/10.1175/1520-0493%281978%29106%3C0755%3AGTVSMA%3E2.0.CO%3B2
“[T]he 1976 surface temperature equated the global record for the lowest temperature set in 1964; but even so the trend in global temperature since 1965 has been small compared to the 0.5°C decrease during 1960–65.”
–
And as far as global temperatures, in the ’70s and early ’80s, it was the scientific consensus (NASA, the NAS) that the world had warmed by about 0.6 C between the 1880s and 1940, and then cooled by -0.3 C through the early 1970s. Now, of course, the ’40s to ’70s global cooling has been eliminated to 0.0 C, or a pause, and the early 20th Century global warming has been reduced from 0.6 C to about 0.35 C . Via data manipulation. No new data was obtained, of course. They just changed the past to suit their agenda.
–
http://ntrs.nasa.gov/archive/nasa/casi.ntrs.nasa.gov/19750020489.pdf
“Between 1880 and 1940 a net [global] warming of about 0.6°C occurred, and from 1940 to the present our globe experienced a net cooling of 0.3°C.”
–
http://journals.ametsoc.org/doi/pdf/10.1175/1520-0450%281977%29016%3C0477%3ATSFRTS%3E2.0.CO%3B2
“The [global] cooling from about 1950 to 1974 is ~0.3°C (Brinkmann, 1976). Moran (1975) suggests that the recent drought of peninsular Florida is largely due to…the general atmospheric and oceanic cooling since about 1940 (Wahl and Bryson, 1975).”
–
http://link.springer.com/chapter/10.1007/978-3-0348-5779-6_2#page-1
“In the last century it is possible to document an increase of about 0.6°C in the mean global temperature between 1880 and 1940 and a subsequent fall of temperature by about 0.3°C since 1940. In the polar regions north of 70° latitude the decrease in temperature in the past decade alone has been about 1°C, several times larger than the global average decrease. Up till now, past climatic changes (except possibly those of the last few decades [of cooling temperatures]) could hardly have been caused by man’s activities.”
–
http://www.pnas.org/content/67/2/898.short
“In the period from 1880 to 1940, the mean temperature of the earth increased about 0.6°C; from 1940 to 1970, it decreased by 0.3-0.4°C. Locally, temperature changes as large as 3-4°C per decade have been recorded, especially in sub-polar regions.”
–
https://muse.jhu.edu/article/429517/summary
“In 1970, Mitchell stated that by the late 1960s global temperatures had fallen 0.3°C from the peak in the 1940s, approximately one-half of the prior rise. … Summaries by Schneider and Dickenson, Kalnicky, Robuck, Roberts, and Agee all report Northern Hemisphere temperatures declines by at least 0.5°C since the 1940s.”
I should submit a grant proposal…
“Lack of warming and exposure to facts causes panic among internet warmist trolls.”
What, specifically, are you asking me to retract? Are you suggesting that Hansen et al. (1981) was purposely excluding available temperature data from certain locations in the Northern Hemisphere when they wrote that the Northern Hemisphere cooled by “about -0.5 C”
Read again. The quote this is responding to very clearly is talking about the “early warming trend”. I haven’t said anything is wrong with the claim that the NH-land cooling trend from the 1940s to 1970s changed.
You said:
To subjectively summarize the wholesale adjustments to past temperature data, the +0.8°C warming between 1880 and 1940 has been reduced to +0.35°C
This is wrong. The difference you’re seeing is because you’re making an incorrect comparison, not because of adjustments. If you make the correct comparison – between the NH land-only 1981 record and the current NH land-only record – the trend is actually slightly larger in the current one. Are you going to retract your incorrect claim?
Although your comparison for the 1940s to 1970s period is also wrong, the correct comparison turns out to show about the same difference.
So, none of your quotes address my point. However, I will make a few corrections and remarks.
The first quote about a global trend from 1960-1965 is talking about radiosonde data, not surface data. This has never been used in surface datasets, so it’s obviously not relevant in reference to adjustments in surface datasets. Nor do any “pre-adjusted” surface datasets indicate a global 0.5C drop from 1960-1965.
In at least one of your quotes you’ve incorrectly asserted, via square-brackets, that a trend was global when it was in fact NH-only. In one quote the claim about global trend is entirely unsourced so there’s no way to check what it actually referred to. The rest seem to lead back to Mitchell 1970, which only had SH data up to 1959, and assumed that NH data up to 1970 could be a stand-in for the global picture.
It seems like the best “pre-adjusted” record for global temperature is Hansen 1981, which shows about 0.1C cooling at most from the 1940s to the 1970s. It looks the current data has a very slightly smaller global-land cooling trend, but negligible difference.
Another Gish Gallop.
And Kenneth wonders why no one pays attention to them….
Except that the stated consensus at the time was that global cooling was -0.3 C between 1940 and 1970, not 0.1 C as you want to believe. Actually, it appears more like denial than belief.
In Agee (1980), the NAS graph of Northern Hemisphere temperatures had the mid-1970s about 0.1 to 0.2 C colder than 1880:
https://notrickszone.com/wp-content/uploads/2017/01/Northern-Hemisphere-1880-1975-Agee-80.jpg
Today, NASA has 1975’s NH temperatures as +0.3 warmer than 1880, which means data tampering has changed past values by 0.45 C.
The 1981 global temperature graph from NASA shows 1940 still 0.15°C warmer than 1980. Hansen even stated he thought it was “remarkable” that 1980 is almost as warm as 1940 was.
–
Hansen et al., 1981
https://notrickszone.com/wp-content/uploads/2016/10/Global-Temperature-1880-1980-copy.jpg
“A remarkable conclusion from Fig. 3 [above link] is that the global mean temperature is almost as high today [1980] as it was in 1940.”
–
Today, though, the 1980 value on NASA’s global temperature dataset is +0.2 C warmer than 1940, a net change (data manipulation) of +0.35 C.
Of course you have no problem with data manipulation like this. You even make up a false claim yourself by saying even the 1981 graph has global temperatures only “0.1C colder” in 1970 than in 1940, when the difference is clearly more like -0.25 C at least.
But what’s a few tenths of a degree of data manipulation, right PaulS?
K. Richard, I agree with PaulS. Your entire argument is based on the incorrect comparison of Hansen et al. with current work, taking Hansen’s graph which presented only the northern extra tropical portion of the hemispherical area weighted average against the later work which utilized the full hemispherical area. The fact is that the tropics include about 42% of the surface area of the Earth and, as Hansen clearly shows in their Figure 3, the tropics are warming at a slower rate than the areas further toward the north. Your overlay of one curve lifted from Figure 3 against the other ignores this fact and is thus completely, utterly, hopelessly WRONG.
If you had any sense of scientific integrity, you would retract this post or issue a correction pointing out your errors. If you do not do so, you clear intent is to promote such false information and therefore you are a FRAUD. You claim that the later data is manipulated as part of a “hoax”, yet you are doing exactly that with this post. Let me remind you that lying is the worst crime in the sciences, for which the perp usually finds his/her career wrecked. I submit that you might suffer a similar fate, assuming you actually are interested in the truth…
As pointed out above, at the time Hansen et al. (1981) was written, it was the scientific “consensus” that the the Northern Hemisphere — not just the “extra tropics” — had warmed by “nearly 1°C” between the 1880s and 1940, and then cooled by -0.5 to -0.6°C through the mid-1970s. No less than the National Academy of Sciences put out a graph affirming this as the accepted trend, as seen here from Agee, 1980:
https://notrickszone.com/wp-content/uploads/2017/01/Northern-Hemisphere-1880-1975-Agee-80.jpg
–
https://notrickszone.com/wp-content/uploads/2017/01/Northern-Hemisphere-1890-1975-Agee-80_edited-1.jpg
“Evidence has been presented thus far to document the 90-year trend in Northern Hemisphere surface temperature, which is characterized by nearly 1°C warming from about 1890 to 1940 and a subsequent and nearly comparable cooling from 1940 to the present.”
–
As mentioned to PaulS, the NASA warming and cooling trends (+0.8°C and -0.5°C between the 1880s and 1940 and 1940 and 1970 respectively) may have been slightly conservative.
So if you would like to claim that the early-1980s documentation of a warming and cooling amplitude of at least +0.8°C and -0.5°C is evidence of FRAUD, then I invite you to support your case that those were NOT the accepted values for that time period…before they were massively altered (to +0.35°C and -0.2°C) in today’s NASA graphs of the NH.
Actually, Hansen himself uses the words “Northern Hemisphere” interchangeably with “northern latitudes” when he writes this as of 1981:
“In fact, the temperature in the Northern Hemisphere decreased by -0.5°C between 1940 and 1970.”
In NASA graphs today, the Northern Hemisphere cooling trend between 1940 and 1970 has been tampered with to show only a -0.2°C cooling between 1940 and 1970. NASA has removed at least 0.3°C from the peak of the 1940s warmth. But perhaps you know why they did it, E. Swanson. Why has NASA removed at least 0.3°C of warming amplitude from 1940 and -0.3°C of cooling from the 1940-1970 trend for the Northern Hemisphere? Please support your answer substantively.
K. Richard, Your last quote was from Hansen 1981 and refers to Reference 9, the earlier NAS 1975 report. Hansen et al. 1981 reported work in their paper which shows separate curves for both the Northern Hemisphere extra tropical results and the Tropical results in their Figure 3. It is this figure from which you plucked the curve which you overlaid on the more recent data for the entire Northern Hemisphere.
Whether the claims of warming or cooling were current at such-and-such values in 1981 has nothing to do with your activities in this posting. You are mixing apples and oranges, (as J. Christy is fond of saying) by ignoring the different geographical ranges of the two data sets. It is you who must acknowledge your error, offering your readers a clear statement to that effect. Absent that admission and a correction, your original post continues to be FRAUDULENT.
Again, according to Hansen et al. (1981):
“In fact, the temperature in the Northern Hemisphere decreased by about 0.5°C between 1940 and 1970 (9), a time of rapid CO2 buildup.”
“Northern latitudes warmed – 0.8°C between the 1880’s and 1940, then cooled – 0.5°C between 1940 and 1970, in agreement with other analyses (9, 43).”
Since both statements contain the same values of -0.5°C between 1940 and 1970 for both “northern latitudes” and the “Northern Hemisphere”, which one, in your opinion, is the one that is FRAUDULENT, E. Swanson? I ask because the current NASA dataset has only -0.2°C of cooling between 1940 and 1970 for the Northern Hemisphere. Where did that other -0.3°C of cooling disappear to? Please support your answer substantively.
By the way, the “(9)” reference used to make the above statement is the National Academy of Sciences, “Understanding Climate Change” (Washington, D.C., 1975), which, for the entire Northern Hemisphere, has almost 1.0°C of warming for 1880s to 1940, and between -0.5 and -0.6°C cooling for 1940-1970. Again, Hansen was saying the +0.8°C and -0.5°C agreed with NAS, which recorded temperatures for the “Northern Hemisphere.”
So is it possible you’re suggesting the -0.8°C in Hansen81 now reduced to just +0.35°C in today’s NH dataset should be a higher degree of warming than +0.8°C, since Hansen81 had less of a warming trend than NAS (~1°C)? If not, please explain what the true, or not-fraudulent values for NH warming and cooling between the two periods for 1981 vs. present. And then explain why you believe it’s OK for NASA to remove 0.45 °C from the 1880s to 1940 warming for the northern latitudes/Northern Hemisphere since the early ’80s, and also why it’s OK for NASA to have removed -0.3°C of cooling from the 1940 to 1970 NH trend. Why do you defend these data changes, E. Swanson? And what, specifically, should the early-1980s value be instead of the -0.5°C of cooling reported by Hansen et al. (1981) for the Northern Hemisphere/northern latitudes? If -0.5°C wasn’t “correct” in 1981, why did NASA report that? Why have they warmed up 1940-1970 by +0.3°C now? Did the temperature observations/data change, or did NASA just simply manipulate the data to suit their purposes?
K. Richard is one stubborn guy. He can’t understand that the data for 23.5N to 90N might be different than the data for 0 to 90N. The data has been “area weighted” to compensate for the different density of coverage from one area to another. The “higher latitudes” (that’s 23.5N to 90N) are more sensitive to various forcings, thus the range of temperatures is greater in that portion of the NH than they are for the full NH. “NASA” didn’t “remove” the variation, “NASA” simply didn’t include all the NH data in the “higher latitudes” curve, presenting these data instead in a separate curve of Figure 3.
Your continued refusal to admit that your cherry picking and photo shopping combination of two different graphics fails to prove anything only illustrates your ignorance of the work that has evolved over the 36 years since Hansen 1981. Hansen 1981 refers to “several hundred stations for the past century (39)”, whereas many more stations have been added since. Also, efforts to include many more records of ocean temperatures have progressed as well. Your original claims are clearly false and without merit.
Uh, yes, I can understand that 23.5N to 90N “might be different” than 0 to 90N, but in the paper itself, Hansen et al. (1981) identify the exact same values for both. You claim that there is an “apples to oranges” difference between the Hansen81 “northern latitudes” and “Northern Hemisphere,” and yet Hansen81 itself uses each word (latitude vs. Hemisphere) interchangeably, and indicates they revealed the exact same temperature values:
–
“In fact, the temperature in the Northern Hemisphere decreased by about 0.5°C between 1940 and 1970 (9), a time of rapid CO2 buildup.”
“Northern latitudes warmed – 0.8°C between the 1880’s and 1940, then cooled – 0.5°C between 1940 and 1970, in agreement with other analyses [National Academy of Sciences graph of the Northern Hemisphere].”
–
So which temperature change — – 0.5°C for northern latitudes, or – 0.5°C for the Northern Hemisphere — is the one that is “FRAUDULENT” (your word)? Was there a graphical representation from Hansen et al. (1981) that represented the Northern Hemisphere better than the one I used that showed the “northern latitudes” — since they both revealed the exact same temperature values for both 23.5 an 0 (-0.5°C between ’40 and ’70)? Do you have evidence that there was a significant difference between the two, or is it just a guess that they “might be different”?
And, repeating myself again (since you refuse to answer), why did NASA remove 0.3°C from the 1940 to 1970 Northern Hemisphere cooling? It was -0.5°C as of 1981. Today, it’s 0.2°C. Why did NASA remove 2/3rds of the NH trend identified from observations in 1981? Can you finally explain that, or are you planning on continuing to dodge this question, E. Swanson?
And since NASA’s 1880s to 1940 warming amplitude of +0.8°C “agreed” with the NAS warming amplitude (of closer to 1°C) for the entire Northern Hemisphere, why do you believe NASA has changed the observational data from 35 years ago by removing at least 0.45°C of warming amplitude? Obviously, you don’t believe there’s anything inappropriate about changing +0.8°C to +0.35°C, or changing -0.5°C to -0.2°C, but I’m curious as to why you find this massive temperature-altering defensible, E. Swanson. Do you agree with temperature values that support your presuppositions, and reject those that don’t?
Apples and oranges again. Richard refuses yet again to admit that he is mixing data sets with different regional extents. Then too, the Hansen 1981 curve is a 5 year running mean, which ends in 1977, since the running mean trims 4 years off the time series. Also, the Lowess smoothing process results in a different filtered curve than a moving average curve, which adds aliasing to the filtered output. And, as Hansen et al. note “Problems in obtaining a global temperature history are due to uneven station distribution (40), with the Southern Hemisphere and ocean areas poorly represented, and the smaller number of stations for earlier times.” That quote could explain the differences, yet you apparently refuse to consider that the result of many more years of effort may actually be more accurate. Aren’t you the one with a confirmation bias problem?
So much to learn, so little time…
E. Swanson:
I will ask you for a 4th time, since you’ve avoided answering the question in the first 3 attempts…for obvious reasons.
According to NASA’s accepted temperature values from 1981, the “Northern Hemisphere” cooled by -0.5°C between 1940 and 1970.
“In fact, the temperature in the Northern Hemisphere decreased by about 0.5°C between 1940 and 1970 (9), a time of rapid CO2 buildup.”
According to NASA’s temperature dataset from 2017, the “Northern Hemisphere” cooled by only -0.2“C from 1940 to 1970.
What is the reason for NASA’s removal of 0.3°C from the Northern Hemisphere’s cooling trend for 1940 to 1970?
Again, NASA’s “northern latitudes” cooling of -0.5°C between 1940 and 1970 is the exact same trend identified for the “Northern Hemisphere.” So this question should be simple enough for you to answer. Why did NASA change the data?
For that matter, why did the “northern latitudes” trend of +0.8°C between 1880 and 1940 get changed to +0.35°C in today’s Northern Hemisphere dataset? Why did 0.45°C of warming between 1880 and 1940 disappear?
Also, you have been implying that there “might be” a difference in overall temperature trends for 1940 to 1970 in the 23.5 vs. 0 latitudes. What was that difference, E. Swanson? Specifically identify it.
The 1930’s heat is like Chinese food. It just didn’t stay with us.
https://realclimatescience.com/wp-content/uploads/2016/03/Screenshot-2016-03-08-at-01.03.27-PM.png
[…] Massive Data Tampering Uncovered At NASA-Warmth, Cooling Disappears Due To Incomparibility With Mode… […]
[…] – See more at: https://notrickszone.com/2017/01/16/massive-data-tampering-uncovered-at-nasa-warmth-cooling-disappear… […]
[…] to NASA’s elimination of 0.45°C of warming from the 1880s to 1940 period, as well as making 0.3°C o…, the National Academy of Sciences produced a graph (depicted below) indicating there was nearly […]