Two More New Papers Document
No Warming Trend In Antarctica
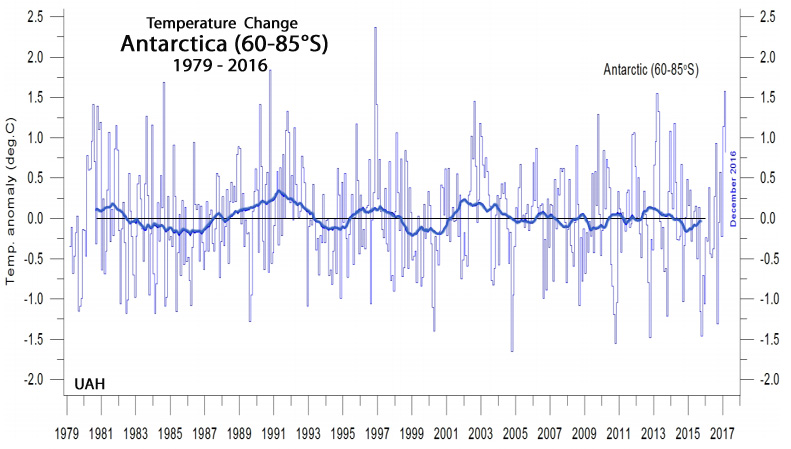
Image Source: State of the Climate, 2016
For several decades now, Antarctica has not been cooperating with the “global” warming narrative, as the continent as a whole has not been warming.
Several scientific papers have been published recently that document the lack of an anthropogenic warming signal for the Antarctic continent or the surrounding ocean, as well as the dominance of natural variability.
Smith and Polvani (2016) concluded that warming of West Antarctica or the Antarctic Peninsula are predominantly natural.
“[We] conclude that there is little evidence of anthropogenic SAM-induced driving of the recent temperature trends … compelling evidence pointing to natural climate variability as a key contributor to the recent warming of West Antarctica and of the Peninsula“
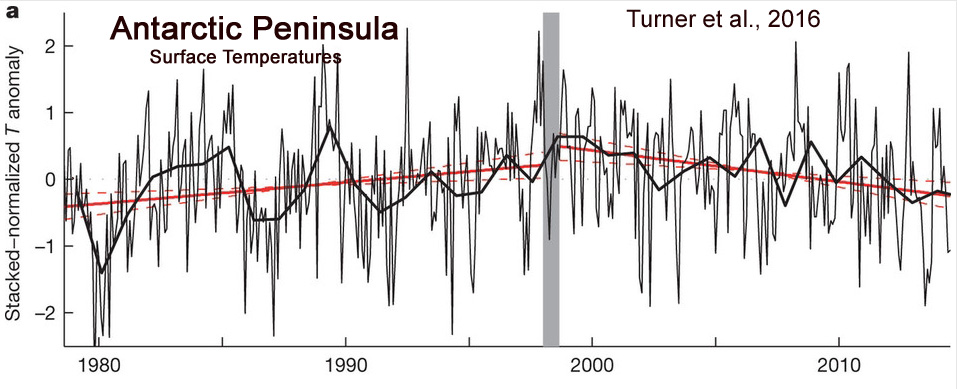
Turner et al., 2016, in a paper entitled “Absence of 21st century warming on Antarctic Peninsula consistent with natural variability,” documented a significant cooling trend for the Antarctic Peninsula since the late 1990s.
“The annual mean temperature has decreased at a statistically significant rate, with the most rapid cooling during the Austral summer.”
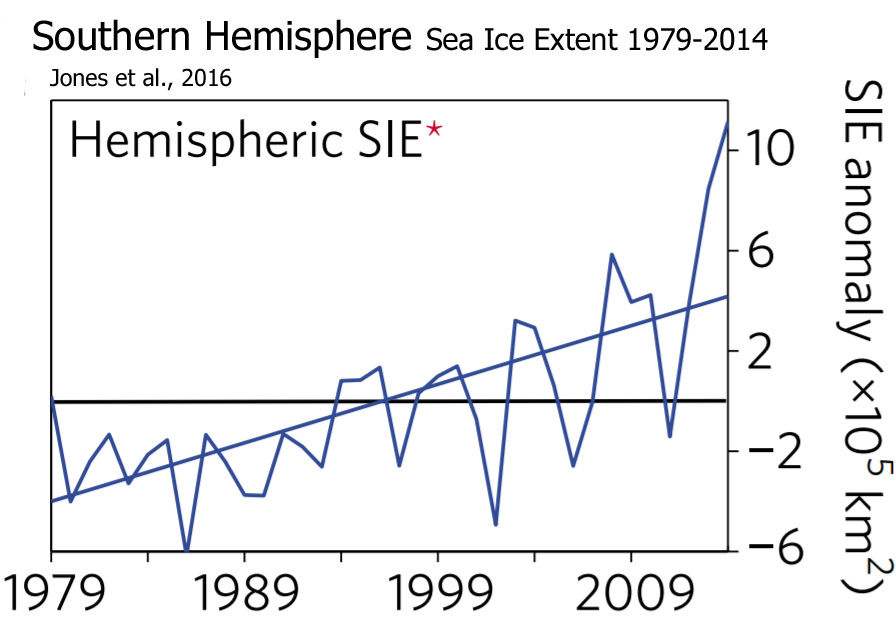
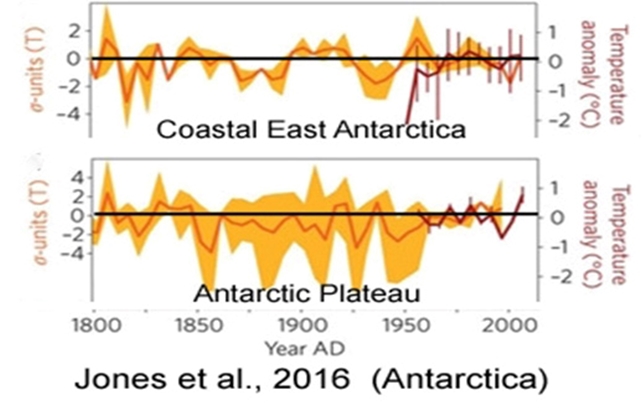
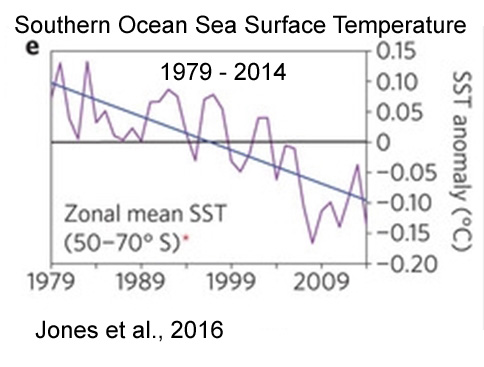
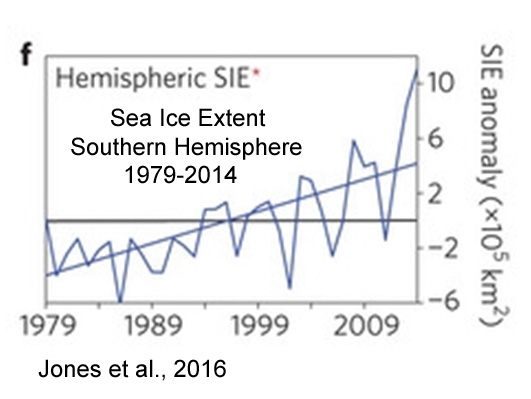
Jones et al. (2016) concluded that (a) there has been no overall warming trend for large portions of the continent in the past few hundred years, (b) the Southern Ocean has been cooling since 1979, and that (c), because of the cooling ocean, sea ice extent has been advancing. In other words, climate models that assume humans drive Antarctic climate are “not compatible with the observed trends.”
“Most observed trends [over the 36-year satellite data] are not unusual when compared with Antarctic palaeoclimate records of the past two centuries. … [C]limate model simulations that include anthropogenic forcing are not compatible with the observed trends. This suggests that natural variability overwhelms the forced response in the observations“

A 2,000-Year Cooling Trend For Antarctica, Uninterrupted By Rising CO2 Levels
Scientific documentation of the dominance of natural variability — and a glaring lack of an anthropogenic forcing signal for Antarctica — continues in 2017.
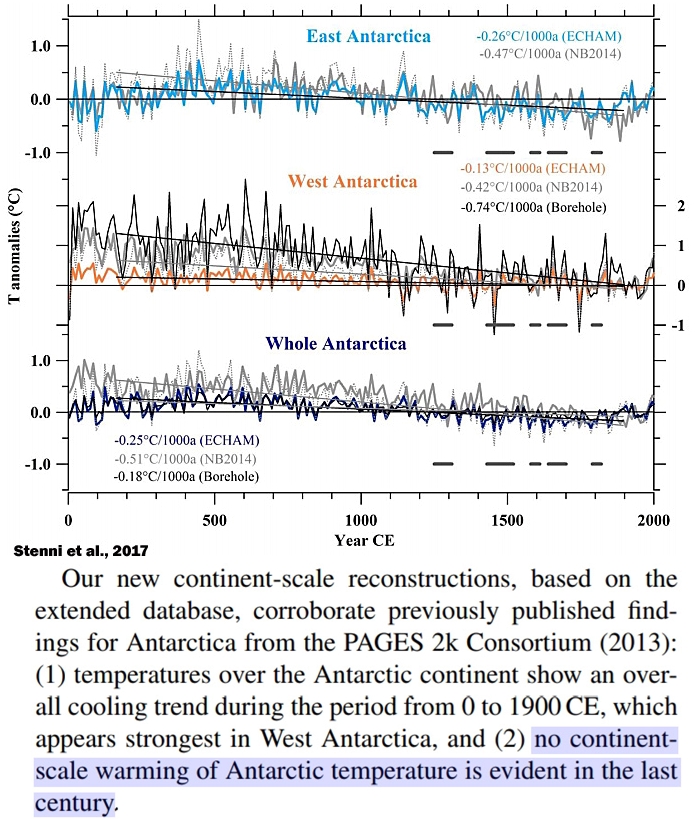
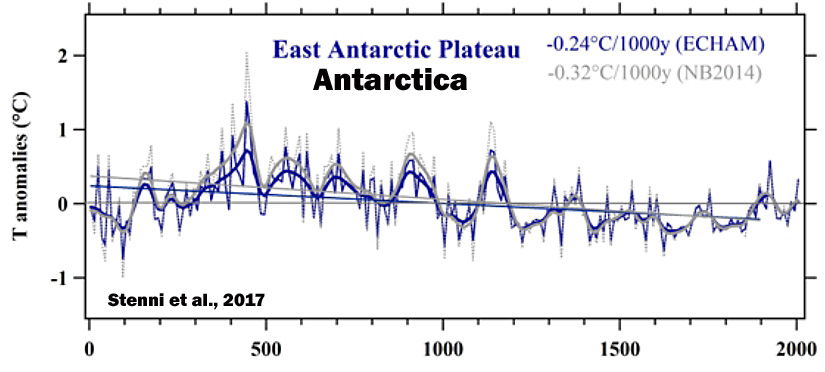
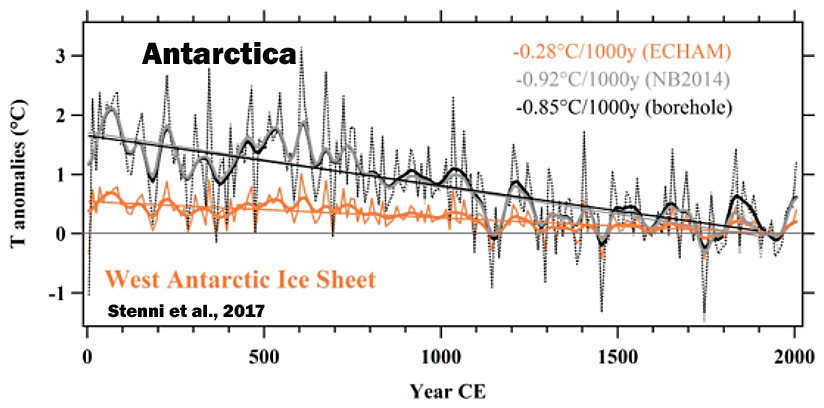
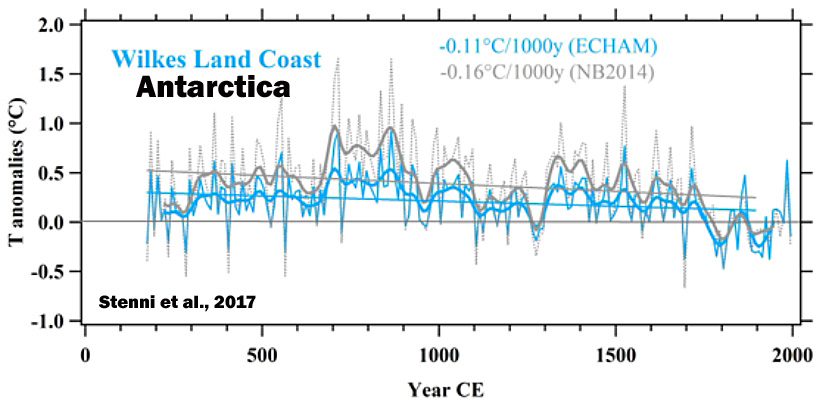
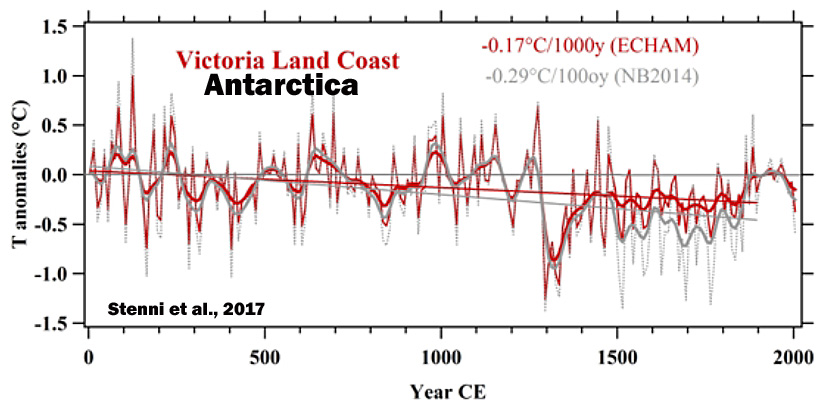
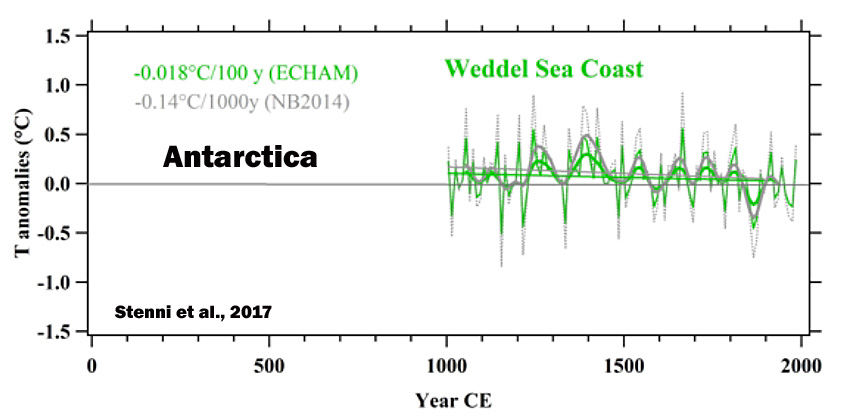
The PAGES 2k reconstruction crew has just published a comprehensive analysis of the surface temperature trends for the entire continent of Antarctica. The results do not advance the “global” warming narrative. Instead, over 20 contributing scientists find that modern Antarctic temperatures are still much colder than they were during first millennium, and the long-term cooling trend has not been reversed on a continent-wide scale even with the onset of an assumed anthropogenic influence within the last century.
In other words, natural variability is the dominant factor influencing the Antarctic climate, not anthropogenic CO2 emissions.
Stenni et al., 2017
“Within this long-term cooling trend from 0-1900 CE we find that the warmest period occurs between 300 and 1000 CE, and the coldest interval from 1200 to 1900 CE.”
“Our new continental scale reconstructions, based on the extended database, corroborates previously published findings for Antarctica from the PAGES2k Consortium (2013): (1) Temperatures over the Antarctic continent show an overall cooling trend during the period from 0 to 1900 CE, which appears strongest in West Antarctica, and (2) no continent-scale warming of Antarctic temperature is evident in the last century.”
“A recent effort to characterize Antarctic and sub-Antarctic climate variability during the last 200 years also concluded that most of the trends observed since satellite climate monitoring began in 1979 CE cannot yet be distinguished from natural (unforced) climate variability (Jones et al., 2016), and are of the opposite sign [cooling] to those produced by most forced climate model simulations over the same post-1979 CE interval.”
“While changes in the SAM have been related to the human influence on stratospheric ozone and greenhouse gases (Thompson et al., 2011), major gaps remain in identifying the drivers of multi-centennial Antarctic climate variability. For instance, the influence of solar and volcanic forcing on Antarctic climate variability remains unclear. This is due to both the lack of observations and to the lack of confidence in climate model skill for the Antarctic region (Flato et al., 2013).”
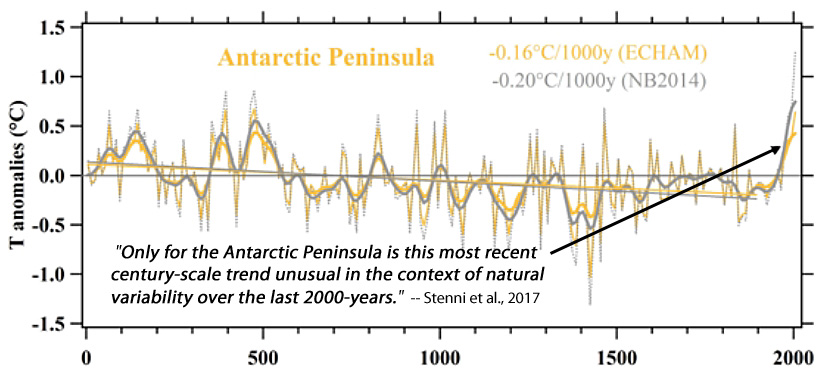
“Only for the Antarctic Peninsula is this most recent century-scale trend unusual in the context of natural variability over the last 2000-years.”
New Paper: Antarctic Temperatures ‘Much Warmer’ In 1911-’12 Than Any Time Since 1957
Another new paper indicates that measured Antarctic temperatures during exploratory expeditions in 1911 and 1912 were “much warmer” than they have been at any time since 1957. In fact, there have “never” been temperatures exceeding the early 20th century warmth of the recorded South Pole daily mean temperatures in the last 60 years. The 1911/12 temperature anomalies reached “greater than 10°C” (as the enclosed graph below indicates).
This demonstrates that there is nothing unusual or unprecedented about modern temperatures in Antarctica, contradicting claims that modern temperatures are driven by anthropogenic CO2 emissions.
Fogt et al., 2017
“At their peak on 6 December 1911, the temperatures measured by Amundsen exceeded -16°C, which represents an anomaly relative to our estimate from ERA-Int climatology [long-term temperature and pressure record] of more than 10°C. … Amundsen’s sledging temperature measurements during this time are much warmer than the hourly and daily mean observations collected at the South Pole station since 1957, even when accounting for the average differences in temperature between Amundsen’s location and the South Pole, which is often colder than nearby areas due to pooling of cold air in the slightly lower elevation (Comiso 2000).”
“The daily mean temperature measured at the South Pole on December 7, 2015 of -19.8°C (max hourly temperature of -18.2°C) is the only comparable warm day before December 11th, otherwise observed South Pole daily mean temperatures have never exceeded -20°C in this portion of early summer.”
“[D]aily maximum temperatures above -20°C occurred for two consecutive days in 2015 and 2012, but these are quite warm exceptions to the normal conditions. In contrast, Amundsen experienced four continuous days with daily mean temperatures exceeding -19.0°C and temperature anomalies from the ERA-Int climatology greater than 10°C [50°F].“
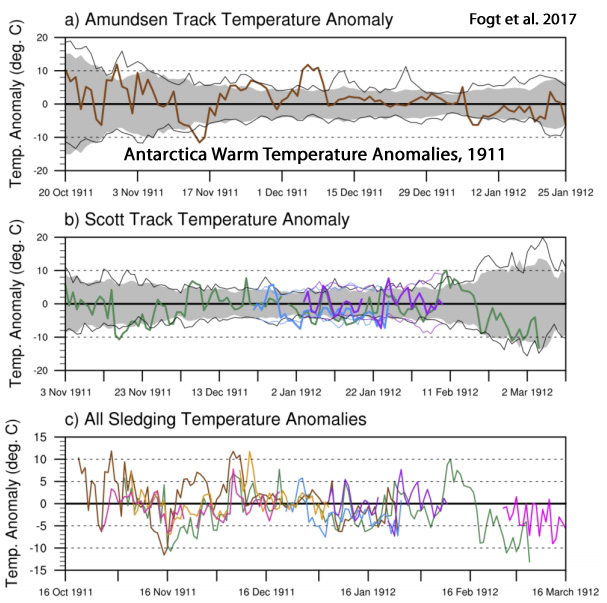
“Notably, there is a large positive spike during summer 1911/12, when seasonal mean pressures rise above 1000 hPa. The reconstruction pre-1957 shows only one other summer with pressures above 1000 hPa, in 1925/26, as discussed in Fogt et al. (2016b), while the direct observations display one summer in 1976/77 when they exceed 1000 hPa. This ranks the McMurdo pressure during the summer of the South Pole races [summer 1911/12] in the top three highest over the last 110 years.”
“When the daily mean temperature anomalies were the highest on February 9th and 10th 1912, more than 8°C and 10°C above the ERA-Int climatological average [long-term temperature record], respectively, Scott writes: ‘Very warm on march and we are all pretty tired. To-night it is wonderfully calm and warm, though it has been overcast all the afternoon’ (Huxley 1913, p.389).”


If there is one place on this planet that would show the effects of CO2 warming in all its glory it would be the cold, dry, isolated continent of Antarctica.
However try as they might the observed fact of nothing but natural variation shows that the UN’s great theory is empty sophistry based on faulty math and misapplied science. It is nothing.
And yet the anartic sea ice extent is on a record (since 1979) low. How could that happen if there is no change in climate in that region?
http://nsidc.org/arcticseaicenews/charctic-interactive-sea-ice-graph/
P.S.: Artic too … record low ice extent.
did that occur through a 30-year trend or is it something that has to do with weather variability? Again you are confirming why your comments often aren’t worth publishing.
Now what are you blathering about?
As far as I see it has nothing to do with what I wrote.
You wrote about Antartica and showing signs of warming, didn’t you?
@P Gosselin:
Could be weather variability … record low nonetheless https://ane4bf-datap1.s3-eu-west-1.amazonaws.com/wmocms/s3fs-public/monthly_ice_11_SH.png?BTwEzJjd42VeSvaex.1DKIjw6RWqBxcN
“Records” get set all the time, especially when data has been collected only 30 or so years. Means nothing. Trend is what counts. Now don’t expect me to be dragged into a silly spat with you over this.
This occurs at the same time as the large El Nino transient event in the NH.
Does that give you a hint, nil-informed seb. !
@SebastianH
I would say your misinterpretation of what I wrote is in all probability deliberate, I doubt I am wrong here.
1.Indicate where I have said that the continental Antarctic atmospheric temperatures have not changed.
2.Indicate, using quotes from scientific papers, where it is *proved* that any change in continental Antarctic atmospheric temperature is caused by CO2.
If you can not then (as usual) you have nothing.
I did correct my comment with a follow up comment and clearified that I overread that this was about human vs. natural variation. That comment didn’t get through moderation. Sorry for the confusion there.
If you want to know more about effects of greenhouse gases over cold areas, I think Kenneth linked to one or two papers in the past about a negative greenhouse effect over the poles in some months of the year. Those cold areas are not – as you have written above – “the one place” where the effects of CO2 would be most pronounced.
No Seb no…
CO2 should show the maximum effect at this pole, as there is little atmosphere water to interfere with CO2’s alleged warming properties. The Antarctic is the near idea lab in which to see the mythical effect of CO2’s ability to ‘hold heat’ as some AGW advocates have it.
Where did you get the idea that atmospheric water would somehow interfere?
If the surface temperature is below the temperature in the stratosphere you get a negative greenhouse effect. Here is a paper explaining how this works over Antarctica: http://onlinelibrary.wiley.com/doi/10.1002/2015GL066749/full
A better location to measure the greenhouse effect would be a dry desert with high surface temperatures. You can find data for one radiations measurement station here: https://www.esrl.noaa.gov/gmd/grad/surfrad/desrock.html
Yep, the Antarctic is the perfect place to see the effect of CO2 on the atmosphere.
And we see COOLING !!
Thin troposphere, low temperatures, no CO2 back radiation, just CO2 as a radiative gas radiating out to space.
Have you read the paper about Antarctica and CO2 cooling? It might help you understand some basics. It even contains those measurements of the CO2 effect in other locations … measurements I told you about multiple times, but you still don’t accept those are real, do you?
So I would assume that SebastianH is acknowledging that the IPCC-popularized concept of “polar amplification” due to CO2 forcing is bunk. It’s already been changed to “Arctic amplification” in recent years (since Antarctica hasn’t been warming). I wonder why CO2 forcing works only in some locations, but not others.
Because of physics laws. But higher surface/air temperatures due to CO2 forcing in other locations on this planet (see the map in the paper above) do influence the temperatures at the poles. Because wind and sea currents transport the heat/energy … you know that, right?
According to the paper you seem to want to cite (even though it undermines your case), CO2 forcing is non-existent to negative for Antarctica, and “similarly weak” for the Arctic (Shmithusen et al., 2015). Considering there hasn’t been any Antarctic warming, and that the bulk of the global surface temperature increase has come from the Arctic region since the mid-1990s (before then, the Arctic had been cooling for 4 decades), and this Arctic warming trend could only have been “weakly” influenced by CO2 forcing…to what do you attribute most of the 1990s-present Arctic warming trend to, Sebastian, since you agree with that paper that it’s not mostly from CO2?
You haven’t read the paper, haven’t you? It has clear descriptions of the greenhouse effect and even a detailed picture of how CO2 forcing is distributed around the globe (derived from 585860 spectra from 173 global surveys, each consisting of 16 orbits).
It also clearly describes why the forcing is sometimes negative for Antarctica. But since it involved math/formulas you don’t care about the explanation, do you?
And you seem to believe changes in temperature in one area can’t influence other areas by wind or ocean currents. To you think the poles are separate from the rest of the surface of this planet?
This is getting nowhere and we had this discussion (about the very same paper) before, Kenneth. As I noted in the other thread you seem to be folding as soon as math or formulas are involved. You only care about some cherry picked quotes from papers you haven’t fully read.
I’ve read the paper multiple times, as well as the original doctoral dissertation (before it was even published in GRL). And each time I do, it says the same thing: the greenhouse effect for CO2 is weak to negative (causing cooling) for Antarctica (as CO2 increases, central Antarctica cools), and the CO2 GHE is “comparatively weak” for the Arctic, with the word “comparatively” referencing Antarctica. So for both the Antarctic and Arctic, the greenhouse effect for CO2 is “weak” to even slightly negative as CO2 rises. And this supports your position?
According to the IPCC, the poles are supposed to warm the most from CO2 forcing — called “polar amplification” at one point, but more recently it’s called “Arctic amplification” (since Antarctica hasn’t been warming). So the models are wrong. Why do you think it is that the IPCC was so wrong about “polar amplification”? What has caused the Arctic to warm as much as it has (since the 1990s anyway) since you’ve here acknowledged that you agree with a paper that says the CO2 greenhouse effect for the Arctic is as “comparatively weak” as it is for Antarctica?
Hmmm. Since I have never once written anything that would even remotely resemble what you just wrote that I “believe”, I have to conclude that, once again, you are dishonestly making up thoughts or positions that I have never written. Why do you do this over and over and over again, SebastianH? I’ve asked you this several times, and you tellingly don’t ever answer: Do you consider yourself an honest person, SebastianH?
Poor seb, still in fantasy land…
Still no paper showing that CO2 causes warming in a convective atmosphere.
Sad sack for the very basis of the AGW scam.
Must be time for him to come up with yet another SIMPLISTIC analogy. ! 🙂
““And you seem to believe changes in temperature in one area can’t influence other areas by wind or ocean currents.””
AMO, PDO, trade winds, El Nino, convection.
All TOTALLY NATURAL periodic climate events.
All charged by big Sol, and controlled by gravity/pressure/distrubution gradients in the oceans and atmosphere.
And the ONLY things causing any warming.
What exactly is my position, Kenneth? This thread started with tomOmason claiming “The Antarctic is the near idea lab in which to see the mythical effect of CO2’s ability to ‘hold heat’ as some AGW advocates have it.” and your claim that polar amplification has something to do with local CO2 greenhouse effects and this paper is somehow debunking that. The first claim is clearly false and the paper is supporting that position, your claim is also clearly false as polar amplification is about convection of heat polewards not the local greenhouse effect being stronger at the poles.
You repeately wrote that the greenhouse effect could not be blamed for increasing temperature in the Arctic. Even the paper about Antarctica has a section about the greenhouse effect elsewhere on the planet (section 4 “Satellite Measurements of GHE”) and since heat gets convected polewards this change in temperature reaches the poles. By this mechanic, also called polar amplification, the equator is cooler than it should be if only considering radiation exchange and the poles are warmer than they should be.
I urge you to read it again and tell me with a straight face that this paper supports the skeptic’s position. If can do that and acknowledge that all claims in the paper are true and scientific, then I don’t know why you and AndyG55 are constantly claiming that CO2 has no effect. Just look at figure 4 in that paper. It contains everything you ever asked of me, but declared unscientific when I explained it too you …
Your position is that lowering atmospheric CO2 concentrations by -0.000001 causes water to cool by an unspecified amount, and raising atmospheric CO2 concentrations by 0.000001 causes water to heat up by an unspecified amount, and that even though we don’t have any scientific evidence from a controlled experiment or physical measurements verifying this, we should believe it’s true anyway…because not believing is what “deniers” do.
And you believe that the 0.3 or 0.4 W m-2 of alleged CO2 forcing during since the 1980s is greater than the 2 to 6 W m-2 of forcing attributed to cloud radiative forcing/surface solar radiation (shortwave heating via the reduction of low cloud cover) because…well, I’m not sure why you believe that 0.3 or 0.4 is greater than 2 to 6. You’re the one who claims this is “simple math.”
Once again, no, I have not written that. The “greenhouse effect” (longwave radiation) from clouds is substantial for the Greenland Ice Sheet. You are, once again, wrongly equating “the greenhouse effect” with CO2 forcing predominantly. CO2 plays a very minimal radiative role (“weak”) at the poles, contradicting the models of “polar amplification” that have been written about since Manabe and Stouffer (1980) first popularized the concept.
http://www.nature.com/ncomms/2016/160112/ncomms10266/pdf/ncomms10266.pdf
Clouds are known to play a pivotal role in regulating the local SEB [Surface Energy Balance], with competing warming and cooling effects on the surface. … The satellite-based cloud observations allow to estimate the cloud impact on the SEB [Surface Energy Balance]. … The annual mean CRE [Cloud Radiative Effect] of 29.5 (±5.2) W m 2 provides enough energy to melt 90 Gt of ice in the GrIS [Greenland Ice Sheet] ablation area during July and August. … The snow model simulations, which capture the evolution of the GrIS SMB [Surface Mass Balance] from 2007 to 2010, indicate that clouds warm the GrIS [Greenland Ice Sheet] surface by 1.2 (±0.1) °C on average over the entire period [2007-2010].
SebastianH, just 2 days ago you tried to point out that the “record” low sea ice extent for Antarctica supports your position that humans are significantly to blame for climatic trends for that region. Here, you’re saying you agree with a paper that says increasing CO2 contributes to a negative greenhouse effect (cooling) for Antarctica. So wouldn’t this mean that you believe humans cause sea ice to grow for Antarctica? Or do you now say that CO2-induced regional cooling causes regional sea ice to…reach record lows? Is this consistent?
One more time and then it’s enough, ok? You made it clear enough that you don’t want to understand or really do not understand.
1) Don’t mix topics. It’s your position that radiation changes over water surfaces don’t change the temperature of the water surface. My position regarding this topic is that physics laws hold true in all situation until someone finds an example where they don’t.
2) You don’t know the difference between the CO2 forcing and the cloud forcing and we discussed that multiple times, remember? You didn’t understand that the cloud forcing you mention is not a net forcing change and apparently you still think that it is.
3)
You don’t know what polar amplification is, do you? I explained it in the previous comment, but maybe the Wikipedia page can help: https://en.wikipedia.org/wiki/Polar_amplification
4) And you do it again … you cherry-pick-quote a paper without realiizing that it contradicts what you have been saying before. Suddenly clouds have a positive forcing effect over greenland? Wouldn’t that mean that less clouds would actually cause surface cooling?
5) 2 days ago I corrected my comment when I realized that this was about human influences. Pierre deleted that comment for whatever reasons.
Convection. Poleward heatflow. Did you not read what I have written? Why are Europe’s winters relatively mild? Because of the Gulf Stream. Why were there days this winter when the Arctic was warmer than central Europe? Convection. Poleward heatflow. Heatflow from region where CO2 has a significant effect (see section 4 in the paper).
Shockingly, you have once again purposefully (and dishonestly) written something that you know I did not write. You made up a false position. A straw man argument. You fabricated again. It’s as if you can’t help yourself.
My actual position, stated many times, is that radiation changes over water do indeed affect temperatures of water surfaces. Radiation changes are facilitated by the Sun, and modified by variations in albedo (clouds, aerosols). CO2, on the other hand, has never been scientifically shown (controlled experiment, physical measurements) to affect a change in water temperature via volume variations of + or – 0.000001. CO2’s effects on water temperatures are only modeled…assumed to be true. Never observed.
You have, once again, falsely equated “radiation changes” with “CO2 changes”. You know that you were misstating my position. And yet you did it anyway. This is why I keep on asking you if you consider yourself an honest person, and why you keep refusing to answer. You know exactly what you’re doing. You know you’re fabricating. You know you’re making up statements. You are not an honest person, SebastianH. So why are you here?
You have no idea what you’re talking about (again). I have a collection of about 5 dozen papers on cloud radiative forcing/surface solar radiation. I’ve interacted extensively via e-mail with a lead author of one of the SSR papers published in 2014. You, on the other hand, have demonstrated you have little to no understanding of SSR, as you demonstrated directly when you wrote that you thought it was TSI variation. It’s pointless to try to have a conversation with someone who doesn’t know what he’s talking about.
Yes, in some regions of the world, the LW forcing exceeds the SW effects of clouds on net. For the Earth as a whole, the SW effect exceeds the LW. If you actually knew anything about SSR, this would have been elementary. But it’s brand new information for you, apparently.
Must be time for another simplistic, irrational seb analogy !!.
Radiation changes means any radiation changes, not just short wave. And you’ve got to be kidding me if you really think that downwelling longwave radiation is derived from a model. Yes, there are models to determine how much of this radiation originates from CO2 since there is some overlap in the spectra, but you can not honestly claim that a measurable radiation has no effect on a surface that is neither transparent nor reflects all wavelengths.
And? Where is the logic in claiming that cloud cover changes caused a forcing of 2-6 W/m² when the net cloud forcing is around -20 W/m² (your words)? By how much did the cloud cover change in that time? Using the max of your amount the forcing would have changed from -26 W/m² to the current -20 W/m². Did the cloud cover really change that drastically?
Indeed. And a little math knowdlege wouldn’t hurt either …
And the 2-6 W/m² figure is what exactly? Just an increase in the SW effect or does that already account for the according decrease in LW? If it already account for the decrease in LW (and there is the net value) then I am shocked that a 3-4% change in cloud cover since the 80s (http://www.climate4you.com/images/CloudCoverTotalObservationsSince1983.gif) can cause a 9-23% increase in forcing.
You can’t even get through writing TWO SENTENCES without engaging in your patented fabrication/straw man concoctions.
I never wrote that radiation changes are only SW. In fact, many times I have written that radiative forcing encompasses both SW and LW. But you knew that already. You’re just making up false positions again.
I never wrote that. I wrote that the LW forcing of ocean heat content changes from 0.000001 variations in CO2 concentrations is derived from a model, as CO2 forcing of heat changes in water bodies has never been observed in a controlled scientific experiment with physical measurements. But again, you knew that. You were just trying to make it out like I had written something I hadn’t. Two sentences in, and you’ve already intentionally fabricated two times. Do you consider yourself an honest person, SebastianH?
Wow. Third sentence in, third dishonest fabrication. Again, I have never written that “a measurable radiation has no effect on a surface.” Those are your made-up words in fabricating a position I have never taken. Do you consider yourself an honest person, SebastianH?
I’ve attempted to explain this to you about 5 times. Each time I do, you either (a) refuse to understand it, or (b) truly don’t understand it. Either way, you have demonstrated time and time again that you don’t understand how surface solar radiation via changes in albedo works. I won’t take the time and effort to attempt to educate you on this again. It’s pointless. You don’t get it.
Unbelievable. As I said, you have no idea what you’re talking about. This is all brand new information for you apparently. You didn’t even know the difference between SSR and TSI a few weeks ago when I tried to educate you, and you probably still don’t. It’s pointless.
Do you consider yourself an honest person, SebastianH?
Still the childish attention seeking.
Are you that lonely and pathetic that your life is reduced to this? A Nil-informed troll??
And no, the Arctic is not at record low.
Biodata clearly shows that it was often summer ice free in the first 3/4 of the Holocene.
There is probably only a period of some 500 years through the LIA and the recovery from it, where Arctic sea ice has been higher than now. That means that Arctic sea ice has been LOWER than now for probably around 95% of the current interglacial.
“How could that happen if there is no change in climate in that region?”
One year does not make climate change, little attention seeker.
A warm current, that will be gone by this time next year and Antarctic sea ice will be high again.
In 2014 there was a ship supposedly retracing Mawson’s 1911 voyage to Antarctica. It got stuck in the sea ice over 100 kilometres from where Mawson moored.
Record low sea ice??????
SebastianH, global temperatures plummeted by -0.7 C during 2016:
http://www.woodfortrees.org/plot/rss/from:2016/to:2017/plot/rss/from:2016/to:2017/trend
Do you think we should consider this short-term anomaly, or the decades-long trend?
Similarly, should we consider the the monthly anomalies for Antarctic sea ice within the last year, or the 35-year trend?
https://notrickszone.com/wp-content/uploads/2016/10/Holocene-Cooling-Antarctica-f-SH-Sea-Ice-Extent-Jones16-copy.jpg
@Kenneth Richard,
Off-Topic but you will probably interested in this
https://phys.org/news/2017-03-sun-impact-climate-quantified.html
The back-pedaling has started on the sun’s influence on this planet’s climate? Perhaps.
I miss the days when expanding sea ice was because of global warming
Those days will return once sea ice returns to advancing. Just like flooding in California is now blamed on the same climate change that caused permanent California droughts. It’s the unfalsifiable hypothesis.
Seb –
Amundsen’s expedition was famously well equipped. That must be the answer – his fur-lined thermometers.
The very low Antarctic sea ice you point to being presently seen follows on very quickly from a very high sea ice area. Both are surely artifacts of the short record period we are obliged to use, and don’t have much bearing on the point Kenneth is making.
Sure, there’s a place in these discussions for a Devil’s Advocate type approach, but I would like to know, just occasionally, what you yourself actually think! Kenneth’s many postings here all seem to me to present evidence that the alarmist narrative is massively undermined by a wealth of contrary evidence from the scientific literature itself, which shows that ‘unprecedented’ is a false – indeed VERY false – term to use in the context of the present climate. Surely you are obliged to agree with that, even if you think the warmists will be right in the end?
A 10C anomaly (delta) is 18F, not 50F.
Absolutely right. The trouble stems from the notation and a failure to distinguish in both the written and the spoken forms between, e.g., 10ºC and 10Cº (sc. between ten degrees Celsius and ten Celsius degrees). Then, when some junior employee is told to go through a text adding Imp./U.S. values alongside metric ones, that kind of error occurs.
ΠΞ
Also instructive is “Trends of air temperature of the Antarctic
during the period 1958–2000 Marek KEJNA” available from
http://www.polish.polar.pan.pl/ppr24/ppr24-099.pdf . Here the various temperature trends from different regions and polar stations are assessed. Amazingly there are quite a few stations where there are unexplained shifts in the trend, some are tracked down to changes in siting, others to unremarked changes in equipment, some though are left unexplained.
So be aware the reported data-sets from Antarctic stations may not be as clean and consistent as they should be — especially the longer period data-sets.
While the S Pole isn’t warming, the N Pole is, put 1 and 1 together and you see a non CO2 warming cause. Ceteris Parabus, the N and the S are the same, except for 1 thing, and it isn’t CO2
Climate “Science” on Trial; Give a Climate Alarmist Enough Rope They’ll Hang Themselves
https://co2islife.wordpress.com/2017/03/26/climate-science-on-trial-give-a-climate-alarmist-enough-rope-theyll-hang-themselves/
AMO. Since late 1970’s. Warm currents, and winds bringing water vapour from warmer areas..
[…] 20+ Scientists: ‘No Continent-Scale Warming Of Antarctic Temperature Is Evident In The Last Centur…’ Image Source: State of the Climate, 2016 For several decades now, Antarctica has not been cooperating with the “global” warming narrative, as the continent as a whole has not been warming. Several scientific papers have been published recently that document the lack of an anthropogenic warming signal for the Antarctic continent or the surrounding ocean, as well as the dominance of natural variability. Smith and Polvani (2016) concluded that warming of West Antarctica or the Antarctic Peninsula are predominantly natural. […]