AGW ‘Disaster’ Predictions Recycled
1978: 5 Meter Sea Level Rise By 2028
2015: 10 Feet Sea Level Rise By 2065
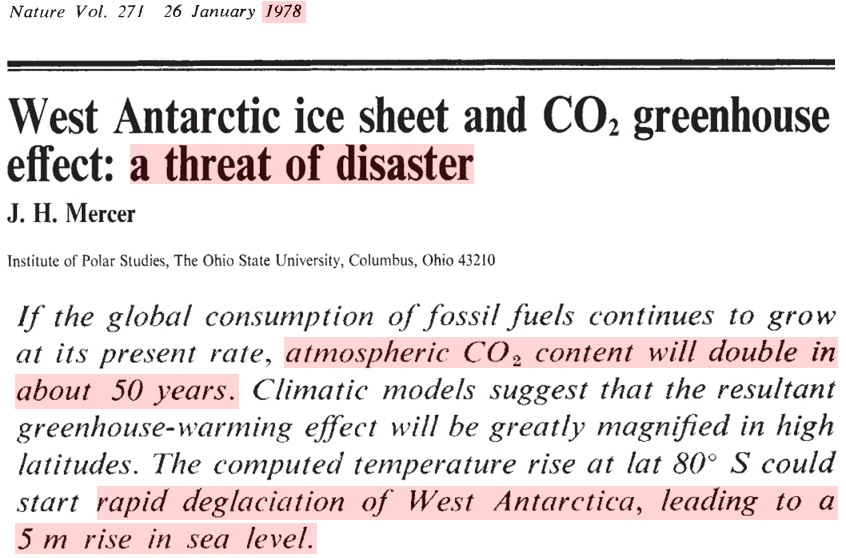
Forecasting human-caused climate disaster is anything but new.
Nearly 40 years ago, a landmark paper was published in the prestigious scientific journal Nature providing a dapper rubric for the modern human-caused climate disaster papers to follow.
The Mercer (1978) “…a threat of disaster” paper introduced above was fraught with presumptions, guesswork, and spectacularly wrong predictions about the connections between fossil fuel consumption by humans and future carbon dioxide (CO2) parts per million (ppm) concentrations, the melting of polar ice sheets, and an impeding sea level rise disaster.
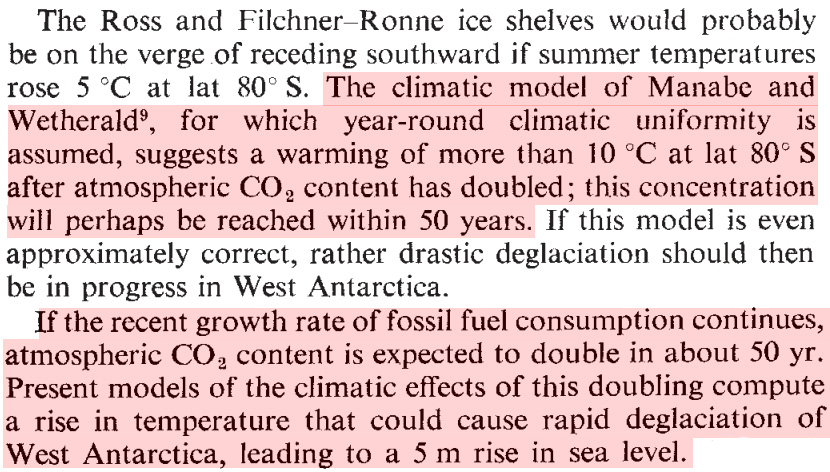
Specifically, Mercer claimed that atmospheric CO2 concentrations would double from ~330 parts per million (late 1970s) to ~660 ppm within 50 years, or by 2028 — due to a continuance of the rapid growth in fossil fuel consumption. Indeed, global-scale fossil fuel or CO2 emissions rates have increased by approximately 100% since the late 1970s, or from about 5 gigatons of carbon (GtC) per year (late 1970s) to about 10 GtC/year by 2014. And yet, despite the explosive increase in CO2 emissions, the atmospheric CO2 concentration is nowhere close to reaching 660 ppm. Instead, it currently hovers around 400 to 405 ppm. It would appear highly implausible to claim that CO2 concentrations will rise by more than 250 ppm in the next 11 years.
The Mercer paper also states that the expected temperature increase due to the doubling of CO2 concentrations would, according to climate models, yield a temperature change of +10°C for the region. This sweltering warmth could, according to advocates of human-caused climate alarm, cause a “rapid deglaciation” of the West Antarctica ice sheet that would, in turn, lead to sea level rise by about 5 meters within 50 years (2028).
As will be illustrated below, the temperatures for Antarctica as a whole have not risen since 1979. Instead, they have been flat to slightly cooling. And, of course, without the “rapid deglaciation” of the West Antarctic ice sheet, sea levels would need to rise by about 4.95 meters in the next 11 years to satisfy the “disaster” forecasts outlined by Mercer in 1978.
Today, Scientists Predict 1400 ppm CO2, 16- 30°C Warming By 2130
Dr. James Hansen, the leading climate scientist at NASA for decades and often characterized as the father of climate change awareness, has long been alarming the public with forecasts of climate doom.
Like Mercer (1978), Hansen has written that CO2 concentrations will quintuple to reach 1400 ppm just 118 years from now (2013), or by the year 2130. Humans, he writes, will burn through 10,000 GtC of fossil fuels by then. This atmospheric CO2 concentration (1400 ppm) is said to yield a warming of 16°C globally, 20°C over land, and 30°C at the poles by 2130. It is also claimed that this human-caused climate disaster will eliminate agricultural production for most of the world and otherwise make “most of the planet uninhabitable by humans”.
Hansen et al., 2013
“If we assume that fossil fuel emissions increase by 3% per year, typical of the past decade and of the entire period since 1950, cumulative fossil fuel emissions will reach 10 000 Gt C in 118 years [~2130]. Are there sufficient fossil fuel reserves to yield 5000–10 000 Gt C? Recent updates of potential reserves, including unconventional fossil fuels (such as tar sands, tar shale and hydrofracking-derived shale gas) in addition to conventional oil, gas and coal, suggest that 5×CO2 (1400 ppm) is indeed feasible.”
“Our calculated global warming in this case [1400 ppm] is 16°C, with warming at the poles approximately 30°C. Calculated warming over land areas averages approximately 20°C. Such temperatures would eliminate grain production in almost all agricultural regions in the world. Increased stratospheric water vapour would diminish the stratospheric ozone layer. More ominously, global warming of that magnitude would make most of the planet uninhabitable by humans.”
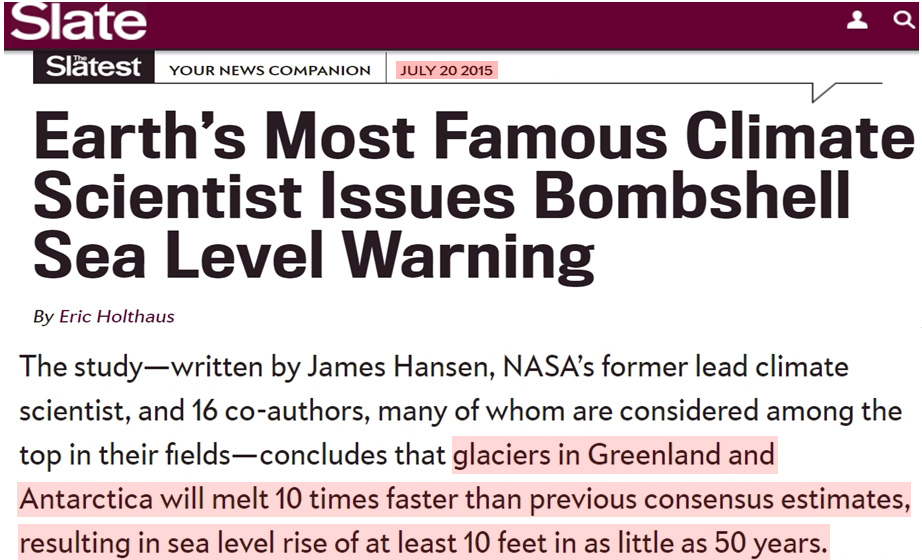
Modern Alarmist Forecast: Now 10 Feet Of Sea Level Rise By 2065
It is obvious the 660 ppm CO2 concentration, wholesale melting of West Antarctica, and 5 meters of sea level rise forecast by Mercer in 1978 has not materialized. No matter. When observations contradict projections found in climate models, modern climate scientists don’t question or modify their CO2-caused-climate-disaster assumptions. They just change the dates.
The current forecast from climate scientists is that both the Greenland and Antarctica ice sheets will melt 10 times faster than what they have been in recent decades, and this will lead to 10 feet (~3 meters) of sea level rise by about 2065.
Observations Of Negligible Mass Losses For Antarctica In Recent Decades
According to the most highly-cited analyses of polar ice sheet melt and contribution to sea level rise, the Antarctic ice sheet as a whole changed in mass by -71 gigatonnes (GT) per year between 1992 and 2011. This modest mass loss contributed just 0.2 mm/year to sea level rise over that 20 year period.
Shepherd et al., 2012
“Between 1992 and 2011, the ice sheets of Greenland, East Antarctica, West Antarctica, and the Antarctic Peninsula changed in mass by –142 ± 49, +14 ± 43, –65 ± 26, and –20 ± 14 gigatonnes year−1, respectively. Since 1992, the polar ice sheets have contributed, on average, 0.59 ± 0.20 millimeter year−1 to the rate of global sea-level rise.”
To put that 0.2 mm/year sea level rise contribution from Antarctica (1992-2011) into perspective, at that pace it would take 100 years for the Antarctic ice sheet as a whole contribute 2 centimeters to sea level rise.
And more recent estimates of the Antarctic mass balance contribution to sea level rise has the East Antarctica ice sheet gaining mass at a more accelerated pace for 2003-2013 than the mere +14 Gt per year identified by Shepherd et al. (2012) for 1992-2011. For example, Martín-Español et al. (2017) find that the total mass trend for the East Antarctic Ice Sheet was a gain of +57 Gt per year during 2003-2013, which is 4 times the rate of gain assessed for 1992-2011. Effectively, this would reduce the Antarctic contribution to sea level rise to close to zero for recent decades.
Martín-Español et al., 2017
“We investigate the mass balance of East Antarctica for 2003–2013 using a Bayesian statistical framework. … We apportion mass trends to SMB and ice dynamics for the EAIS, based on two different assumptions, different remote sensing data and two RCMs. In the first experiment, the model apportions about a third of the mass trend to ice dynamics, +17 Gt/yr, and two thirds, +40 Gt yr−1 to SMB, resulting in a total mass trend for the EAIS [East Antarctic Ice Sheet] of +57 ± 20 Gt yr−1.”
Observations Reveal No Recent Warming In Antarctica
Antarctica has not been cooperating with the forecasts of human-caused climate disaster narrative. Within the last year, scientists have been reporting that essentially the only place on the Antarctic ice sheet where there was pronounced warming in recent decades — the West Antarctic Peninsula — has reversed course since the 21st century began. It is now cooling…rapidly. There has even been “a shift to surface mass gains” for glaciers in that region.
Turner et al., 2016
“Here we use a stacked temperature record to show an absence of regional warming since the late 1990s. The annual mean temperature has decreased at a statistically significant rate, with the most rapid cooling during the Austral summer.”
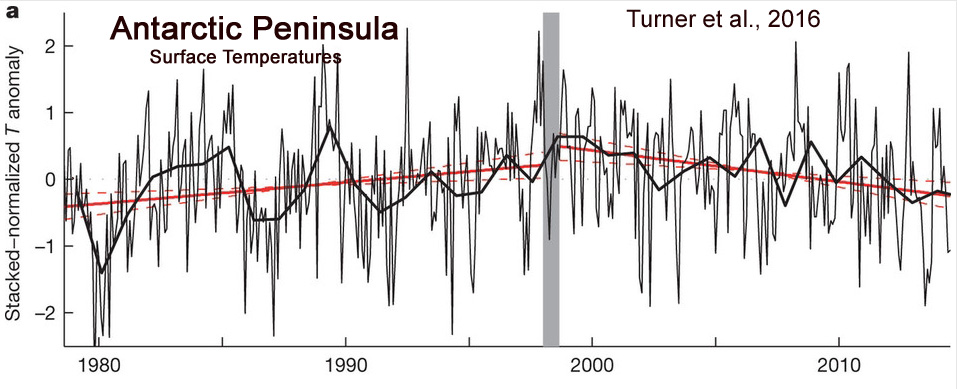
Oliva et al., 2017
“However, a recent analysis (Turner et al., 2016) has shown that the regionally stacked temperature record for the last three decades has shifted from a warming trend of 0.32 °C/decade during 1979–1997 to a cooling trend of − 0.47 °C/decade during 1999–2014. … This recent cooling has already impacted the cryosphere in the northern AP [Antarctic Peninsula], including slow-down of glacier recession, a shift to surface mass gains of the peripheral glacier and a thinning of the active layer of permafrost in northern AP islands.”
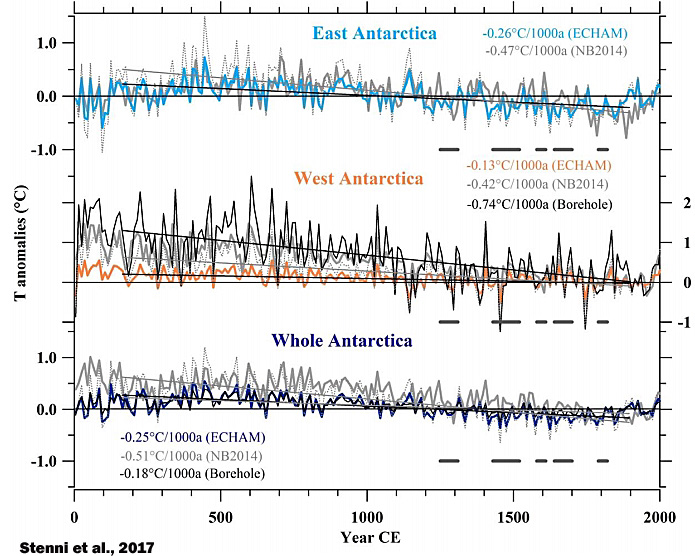
Another recent analysis reveals that West Antarctica — the region that Mercer maintained would rapidly melt and contribute 5 meters to sea level rise — has undergone the “strongest” long-term cooling trend of any region in the Antarctic. Furthermore, Stenni et al. (2017) conclude there has been “no continental-scale warming of Antarctic temperature” evident in the last century.
Stenni et al., 2017
“A recent effort to characterize Antarctic and sub-Antarctic climate variability during the last 200 years also concluded that most of the trends observed since satellite climate monitoring began in 1979 CE cannot yet be distinguished from natural (unforced) climate variability (Jones et al., 2016), and are of the opposite sign [cooling, not warming] to those produced by most forced climate model simulations over the same post-1979 CE interval.
(1) Temperatures over the Antarctic continent show an overall cooling trend during the period from 0 to 1900 CE, which appears strongest in West Antarctica, and (2) no continent-scale warming of Antarctic temperature is evident in the last century.”
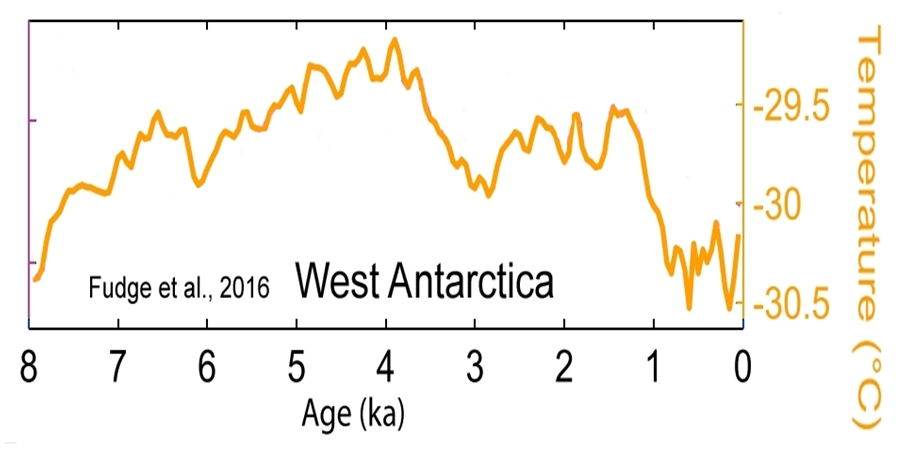
Extending the temperature record back even further, modern temperatures in West Antarctica are still some of the coldest of the last 8,000 years.
Fudge et al., 2016
Forecasts Of Human-Caused Climate Disaster Are Non-Scientific
In science, when a hypothesis is advanced and tested using empirical evidence, and the results of the testing do not support the hypothesis, the hypothesis is then discarded.
In climate science, a hypothesis has been advanced that says a rise in human CO2 emissions will cause polar ice sheets to dramatically recede and contribute meters to sea level rise within a span of decades. This hypothesis is not supported by the observational evidence.
But instead of discarding this hypothesis and conceding that our knowledge of the factors contributing to polar ice sheet melt and sea level rise are still not fully developed, climate scientists continue to embrace their favored hypotheses anyway.
So instead of human-caused climate disaster occurring in 2028, it will now occur in 2065. Or perhaps 2100. Or 2130. Or…someday.
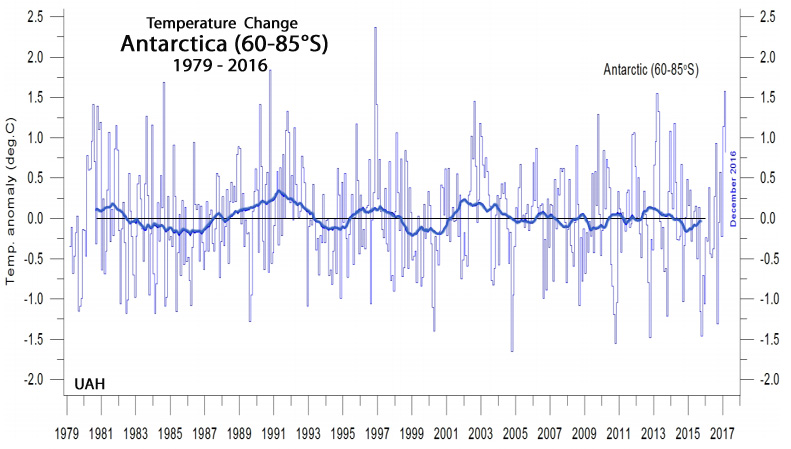
Image Source: State of the Climate, 2016


The first paper shown in this post is by John H. Mercer; apparently a nice chap born in Cheltenham, England, on 29 October 1922.
I see these old papers suggesting impending doom and wonder what the person says today about the issue. Most, I think, would – like Harold Camping – just push the date of Rapture further into the future.
In this case, Mercer was ~56 when this was published and had no hope of being around another 50 years. This saves me the trouble of tracking him down and asking.
“em>Mercer died on July 3, 1987 in Columbus, Ohio. In 2000, Ice Stream A, the southern most of several major ice streams draining from Marie Byrd Land into the Ross Ice Shelf, flowing west to Gould Coast to the south of Whillans Ice Stream, Antarctica was renamed the Mercer Ice Stream in his honor.”
LINK to John Mercer
Ohio State houses 11 cubic feet of the John H. Mercer Papers – on glaciers.
Maybe I hit the wrong key — trying again:
The first paper shown in this post is by John H. Mercer; apparently a nice chap born in Cheltenham, England, on 29 October 1922.
I see these old papers suggesting impending doom and wonder what the person says today about the issue. Most, I think, would – like Harold Camping – just push the date of Rapture further into the future.
In this case, Mercer was ~56 when this was published and had no hope of being around another 50 years. This saves me the trouble of tracking him down and asking.
“em>Mercer died on July 3, 1987 in Columbus, Ohio. In 2000, Ice Stream A, the southern most of several major ice streams draining from Marie Byrd Land into the Ross Ice Shelf, flowing west to Gould Coast to the south of Whillans Ice Stream, Antarctica was renamed the Mercer Ice Stream in his honor.”
LINK to John Mercer
Ohio State houses 11 cubic feet of the John H. Mercer Papers – on glaciers.
Their endless doomsday modeling future forecasts are always wrong,very wrong.
Now watch the excuses come rolling in……
Click on the chart in the link:
A Republican Quiz For Washington Post Editors: How High Have Sea Levels Risen During Satellite Era?
http://www.c3headlines.com/2011/05/memo-to-republicans-sea-levels.html
OT.
For the last 6 days NSIDC is showing 2017 Arctic Sea Ice extent as having the SMALLEST drop from maximum this century.
Also, as of day 130, the smallest 28 day drop for the same 28 day period.
Day 131. MASIE has Arctic sea ice extent above that of:
2006, 2007, 2009, 2010, 2011, 2014, 2015, 2016
Where’s the inverse logarithmic influence? Dr. James Hansen: “This atmospheric CO2 concentration (1400 ppm) is said to yield a warming of 16°C globally, 20°C over land, and 30°C at the poles by 2130.” The bigger and dumber the story the harder it dies.
In true con man fashion, Hansen conveniently neglects the well known but very, very inconvenient inverse logarithmic influence that added CO2 has on temperature. This progressive logarithmic diminution effect, acknowledged by warmists and us alike, punctures Global Warming fright nights and so is seldom if ever discussed. The reason logarithmically decreasing temperatures is atmospheric radiative gases’ absorption and emission capacities, i.e., saturation levels. Logarithmic diminution effect explains why there wasn’t any run¬away “green¬house” warming way in dinosaur days when atmospheric CO2 levels were several thousands of ppm, and why (try as they might to convince us) there can’t ever be runaway warming now.
G.S. Callender was the first in 1938 to spot it and read a paper read to the Royal Meteorological Society (February 16, 1938). Callendar showed his estimate of the change in temperature anomaly rising in an inverse logarithmic scale with rising CO2 levels in “temperate” zones. Though he did not characterize the curve in this figure as logarithmic, it closely approximates a log curve fitted to his graphic. Its 2xCO2 sensitivity is 1.67 deg.’
In the journal Science of July 1971, pp. 138-141, Stephen W. Schneider (yes, that Stephen Schneider) and S.I Rasool, Goddard Institute of Space Studies, NASA, published their own paper without citing Callender, stating that, “It is found that even an increase by a factor of 8 in the amount of CO2, which is highly unlikely in the next several thousand years, will produce an increase in the surface temperature of less than 2°K.” The authors noted that “the rate of temperature increase dimi¬nishes with increasing CO2 in the atmosphere. As more CO2 is added to the atmosphere, the rate of temperature increase is proportionally less and less, and the increase eventually levels off. Even for an increase in CO2 by a factor of 10, the temperature increase does not exceed 2.5°K.”
Even the IPCC acknowledges radiative gases’ inverse logarithmic influence on temperature. Its reports in TAR3 acknowledge that the effective temperature increase lessens rapidly with higher concentrations of atmospheric CO2. This information is well concealed in the IPCC reports. (Chapter 6. Radiative Forcing of Climate Change: section 6.3.4 Total Well-Mixed Greenhouse Gas Forcing Estimate) [1]. It is not acknowledged in the IPCC Summary for Policy Makers[2].
The IPCC held further that, at 400pmm CO2 has reached about 87 percent of its potential atmospheric warming effect, so only about13 percent warming remains, boys and girls, as it “levels off.” The only question left is how more degrees warming will the 13 percent cause? Estimates have ranged from between 0.4 to 1.89 degrees C.
Ha, I knew that my comment about Pierre’s bold 2008 prediction wouldn’t get through moderation 🙂
Hypocrites …
SebastianH, do you believe that sea levels will rise by 10 feet in the next 50 years, or that CO2 levels will reach 1400 ppm by 2130, or that global temperatures will rise by 16-30 degrees C by 2130 due to the 1400 ppm? If not, why? What amount of sea level rise and temperature change do you believe we’ll get by, say, 2100?
What do you predict? And how is this a reply to the comment? And will temperatures in 2020 be 2.5°C below 2008 temperatures? (Pierre’s prediction)
I don’t know what happened to your comment…which is why I didn’t comment on that myself. But I would understand why someone running a successful blog would wish to rein in those who perpetually practice sabotage. It would be wise to remember you’re a guest here and that allowing your comments to be published here is not a right…especially considering your dubious track record.
I don’t know what the temperature of the Earth* will be in 2100. Solar scientists are forecasting a minimum in upcoming decades, and considering the correlative tracking of solar activity with temperature, I would be very concerned that they will turn out to be right. Cooling is much worse for the biosphere than warmth. How many meters of sea level rise do you anticipate by 2065? 2100? How much warmer will it be?
If Pierre was assuming that temperature would drop due to its coordination with solar activity, there is certainly justification for such an assumption. I doubt temperature will drop by 2.5 degrees C in the next few years, but the onset of the Maunder Minimum saw temperatures across much of the NH plummet rather quickly.
*There is no such thing as a meaningful “Earth” temperature, as some regions are cooling, some are warming, the depths of the ocean have different levels of heat content that cannot be uniformly measured against a mean, etc.
https://judithcurry.com/2016/02/10/are-land-sea-temperature-averages-meaningful/
Several of the major datasets that claim to represent “global average surface temperature” are directly or effectively averaging land air temperatures with sea surface temperatures.
These are typically derived by weighting a global land average and global SST average according to the 30:70 land-sea geographical surface area ratio. However, there is very little consideration of whether such a result has any physical meaning and what, if anything, it means.
One thing it does not represent is a metric of global surface heat content. However, this is ( often implicitly ) one of the most common uses for such data.
I deleted it – too much trolling – little substance.
Any climate realist posting on an alarmist chicken-little site gets banned for even asking simple questions (which invariably go unanswered or the question gets “re-worded”)
and WHO are the hypocrites… and cowards.
Speaking of simple questions.
Have you found a single paper that empirically proves that CO2 causes warming in a convectively controlled atmosphere.
Or are you still just an empty sad-seb.
A climate realist that assumes the greenhouse effect doesn’t exist or CO2 isn’t part of it … yeah right. You are stuck in early 20th century climate science.
The comment was about this archived prediction: http://blog.hotwhopper.com/2013/12/denier-weirdness-crank-blog-popularity.html
Temperature would decrease by 2.5°C until 2020 … predicted in 2008. Impending ice age, etc … spoken like a true alarmist 😉
Poor seb
still in your FANTASY land
Unable to prove the most basic LIE of the AGW scam
Still batting ZERO when it comes to proving CO2 causes ocean warming or causes warming in a convective atmosphere.
If you want somewhere that tells whopper LIES… hot whopper is the place to be.
Off you trot.. you will be right at home there.
Seb you are the hypocrite. I wonder if you actually made such a comment or were you just trying to play the “victim” card? In any event the fact that you have been allowed to make your comment in this thread proves it wasn’t banned. I dare, you, make a sceptical comment on any of the alarmist’s sites and see how long you last.
Not playing any card. Also I am glad this site exists and lets “climate realist” skeptics like me and others openly comment posts most of the time. There are other sites that moderate 90% of critical comments. They are completely immersed in their respective bubbles.
You’re not playing anything.
You are just a low-level, low-information troll, with nothing better to do with your low-level life.
When you think about it, its a pretty miserable reason for existence.
What is your reason for existence? Wasting time on commenters you perceive as trolls?
OT
This will make sob=seb happy.
http://joannenova.com.au/2017/05/matt-ridley-wind-power-makes-0-of-world-energy/
In whole numbers… Wind power makes 0% of world energy
All that WASTED money.. for NOTHING !!!!!
Do you think that this is news Andy?
Solar’s growth rate over that last 5 years was about 42% and wind grew by 17%. This means solar power generation doubles every 2 years and wind doubles every 4.4 years. We are just at the (expensive) beginning … early adopters market or subsidized market if you will.
The growth rates will lead to cheaper installation prices and the share will increase rapidly. It’s already quite a bit higher in developed countries. If growth continues for another 20-30 years and energy consumption increases 2% annually we will have achieved 100% renewables … of course the growth will most likely follow a S-curve rather than continue on its exponential path.
You are having some math problems here, SebastianH. Even if solar and wind power generation have been doubling every 3 years, this doesn’t mean that carbon sources of energy are being DISPLACED or SUPPLANTED.
https://www.washingtonpost.com/apps/g/page/world/as-appetite-for-electricity-soars-the-world-keeps-turning-to-coal/1842/
“[T]wo-thirds of the world’s electricity is still produced by burning fossil fuels, mostly coal — a proportion that hasn’t budged for 35 years. Emissions of carbon dioxide from power plants have more than doubled since 1980 as the world’s demand for electricity keeps rising.”
Gigawatt-hours (GWh) from fossil fuels (coal, gas, oil) grew from 5.8 GWh in 1980 to 15.4 GWh in 2012. Gigawatt-hours from renewables rose from 1.8 GWh in 1980 to 4.8 GWh in 2012. This means that total consumption of fossil fuel energies grew more than 3 times faster (9.6 GWh to 3 GWh) than renewables did between 1980 and 2012.
—
http://www.scidev.net/global/energy/news/green-energy-developing-world-renewable-energy.html
Developing countries that already have a high share of renewable energyin their power mix are unlikely to grow this share further due to skyrocketing demand for cheap electricity, a report warns.
The study by intergovernmental organisation the International Renewable Energy Agency (IRENA) says that many developing countries made huge strides towards deploying renewable technologies over the past decade — but this rise is now levelling off. Instead, these countries are turning towards fossil fuels to meet the energy demands of their citizens, IRENA says.
“If there is a growing energy demand in an economy and if this additional demand is covered by fossil fuels, the relative share of renewables will decrease, even if there is no decrease in absolute terms for renewable energy,” she explains.
I know math isn’t your strong suit. You are vastly underestimating what exponential growth means and for exponential growth my statement is correct. For start values of 100% (energy consumption), 0.3% (solar percentage) and 0.8% (wind percentage) and growth rates of 28% and 17% respectively for solar and wind and 2% for energy consumption the following will happen:
1) In 13 years (2030) added solar+wind will be bigger than the increase of energy consumption while still only providing for 8.7%.
2) In 25 years (2042) solar+wind will provide for 100% of all energy consumption.
Of course we both know that growth will most likely follow an s-curve and that’s why have written exactly that above. Otherwise solar+wind would cover 200% in the beginning of 2046 and 585% in 2050 😉
If wind+solar would grow only by 10% each year the dates would shift to 2060 (1) and 2090 (2).
So what happens to fossil fuels while this is going on? Are they supplanted? I ask because the developing world still has 1.2 billion people who lack electricity. And the world population will swell by another 2-3 billion in the next 20-30 years before plateauing. Did you think carbon-based energy sources would just disappear due to “exponential”, no-limits growth?
http://www.scidev.net/global/energy/news/green-energy-developing-world-renewable-energy.html
Developing countries that already have a high share of renewable energy in their power mix are unlikely to grow this share further due to skyrocketing demand for cheap electricity, a report warns.
And as we all know, wind and solar without REAL and RELIABLE back-up, are probably WORSE than USELESS.
My English may be bad, but not that bad. If energy consumption increases by 2% each year and currently less than 1% of that is provided by wind+solar then wind+solar will cover 100% of the increase in 13 years.
How much faster have fossil fuel energies risen in the last 3 years? The percentage of energy provided by renewables has steadily risen. Why? Since it’s growing faster than fossil fuel energies (percentage-wise). And in absolute values renewables will cover 100% of the yearly consumption increase in 13 years at the current growth rates.
That math should be easy enough.
Last but not least, I know that there will be no unlimited exponential growth. You apparently didn’t read the sentence about s-curve growth.
http://imgur.com/a/IR9in
I plotted the growth for you. An s-curve will initially fit the exponential growth and decelerate approaching 100%. At current growth rates 100% wind+solar would be reached in 2050s …
You obviously have no idea how this works, SebastianH.
https://www.eia.gov/totalenergy/data/monthly/pdf/sec1_7.pdf
In 2009, fossil fuels accounted for 78.04 energy units (quadrillion Btu) consumed by U.S. citizens.
Wind accounted for 0.72 and solar accounted for 0.078.
By 2016, wind accounted for 2.11 energy units and solar accounted for 0.587 energy units. So wind consumption tripled and consumption of solar energy grew by a factor of 7.5.
But guess what? The consumption from fossil fuels did not get displaced between 2009 and 2016 despite the explosive growth in wind and solar. Instead, it grew slightly, to 78.57 units of energy consumed.
This is the problem with your “we’ll get to 100% renewable use in 13 years” fantasies. It imagines that fossil fuels are just going to disappear. It doesn’t work that way.
This isn’t just plugging in numbers on a paper. You fail to account for the infrastructure, land-clearing, habitat destruction, and lack of political appetite for expanding solar and wind projects.
https://www.sciencedaily.com/releases/2016/03/160323152508.htm#.VvkQjt-fbkw.twitter
“Just considering wind power, we found that it would take an annual installation of 485,000 5-megawatt wind turbines by 2028. The equivalent of about 13,000 were installed in 2015. That’s a 37-fold increase in the annual installation rate in only 13 years to achieve just the wind power goal,” adds Jones. Similar expansion rates are needed for other renewable energy sources. “To even come close to achieving the goals of the Paris Agreement, 50 percent of our energy will need to come from renewable sources by 2028, and today it is only 9 percent, including hydropower. For a world that wants to fight climate change, the numbers just don’t add up to do it.”
Seb, you are deluded. “We are at the expensive beginning…” Don’t make me laugh, we’ve beenthere for 30 years now. How much longer do your green capitalist hogs want to keep their snouts in the trough?
30 years of renewables? Remind me about solar+wind generation capacity in the year 1987 please …
It is the expensive beginning. Just like with the latest gadgets and flatbed TVs … a few people buy them for the high start prices and the masses will join in when the price has come down.
It still counts for ZERO % of total energy use, seb.
Nothing much has changed, has it, except a MASSIVE waste of money that could have been used for something worthwhile, you know, like providing water, sewerage, base load RELIABLE power to third world countries.
Instead, all that has happened is that several developed countries have now put their electricity supply systems on a knife edge.
DOH !!!
Nope, it is not ZERO %. You shouldn’t underestimate exponential growth. It will be 2% in 5 years, 4 % in 9 years, 8% in 13 years, 20% in 17 years, etc …
The money wasn’t wasted at all. It stimulated the slow start of the growth … switchover to renewables will happen pretty fast in the next decades, as has happend with any technology change.
The only way we cold possibly achieve 100% renewables is with adequate storage capabilities. Currently that technology doesn’t exist at a feasible level. Until it does, 100% renewables is a pie-in-the-sky fantasy; there is no guarantee that it ever will exist. And trying to achieve that level without this storage capability is destabilizing to civilization and irresponsible.
True, but what amount of storage would be necessary for 90%? 80? 70%? 60%? In Germany renewables provide around 12.6% of total energy consumption (“Primärenergieverbrauch”) … at what point is storage the only way forward and how much needs to be stored? Or can we just “not use” electricity that we can’t consume and continue to generate electricity from fossil fuel (methane) to fill the gaps?
From what I’ve read, 10-11% is the maximum before non-dispatchable renewables sans storage begin to destabilize the grid.
10-11%? And you mention the grid, so you are talking about just electricity. Is that correct?
How does Germany manage to have no blackouts with over 50% share of renewable electricity generation? https://energy-charts.de/ren_share.htm (select “daily”)
And how does the grid handle 81% solar+wind (45.52 GW) at times? See https://energy-charts.de/power.htm?source=all-sources&year=2017&week=17 (April 30th 13:00)
“In Germany renewables provide around 12.6% of total energy consumption”
Wind 2.1%, solar 1.2%
or is it the other way around…
Either way, with the money wasted on them..
those are truly pathetic figures.
I didn’t say “blackouts”, I said “destabilize”. Coal plants have to be ramped up and down to account for wind’s/solar’s intermittancy. This creates problems; for some industries it can be severe.
From what I’ve read about the excess production, Germany pays other countries to take it. It’s obviously not being stored for later use.
All that subsidised growth, and still they produce ZERO PERCENT
so hilariously funny.
so much WASTE.
Funds that could have gone to improving the lot of many developing countries, wasted on a political anti-science scam.
A very sad indictment on the sick mentality of those that push the anti-CO2 agenda.
Sorry, this article is a joke.
Nuclear power? the last year with reliable statistics is 1923. Percentage of nuclear of total energy demand? zero percent!
Sorry, sob-sob’s posts are ALL a bad joke.
He is here purely for lite relief as a comedy act.
It’s exactly like predictions that Jesus will return on a certain date. When he doesn’t they either move the date back, or slither away into hiding. There’s never any accountability for making false predictions.
[…] Floating Islands. Does Global Warming Cause Coastal Reef Islands to Disappear? New Evidence That Reef Islands Can Repair Storm Wave Damage. How Are Earth's Islands Being Impacted by Rising Sea Levels? A New Refutation of Dangerous CO2-Induced Global Warming. Flashback 1978: Scientist Predicts 10°C Warming, 5 Meter Sea Level Rise, 660 ppm CO2…By 2028! […]