Could Earth’s Shifting Plates
Be Driving Modern Climate?

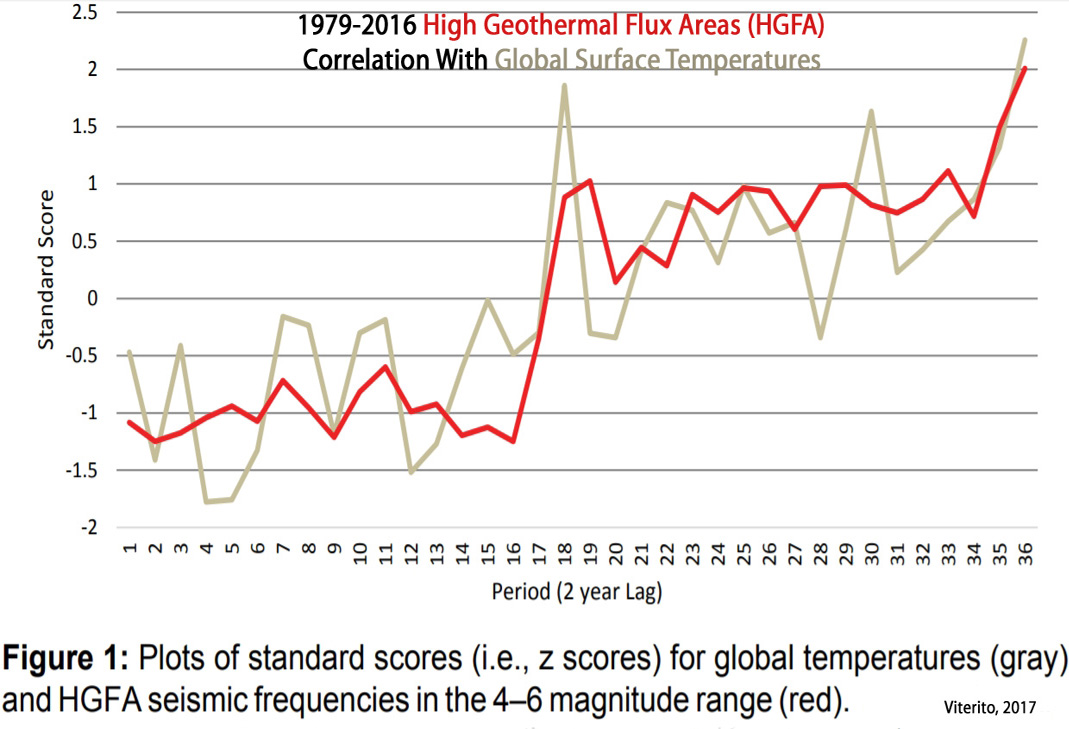
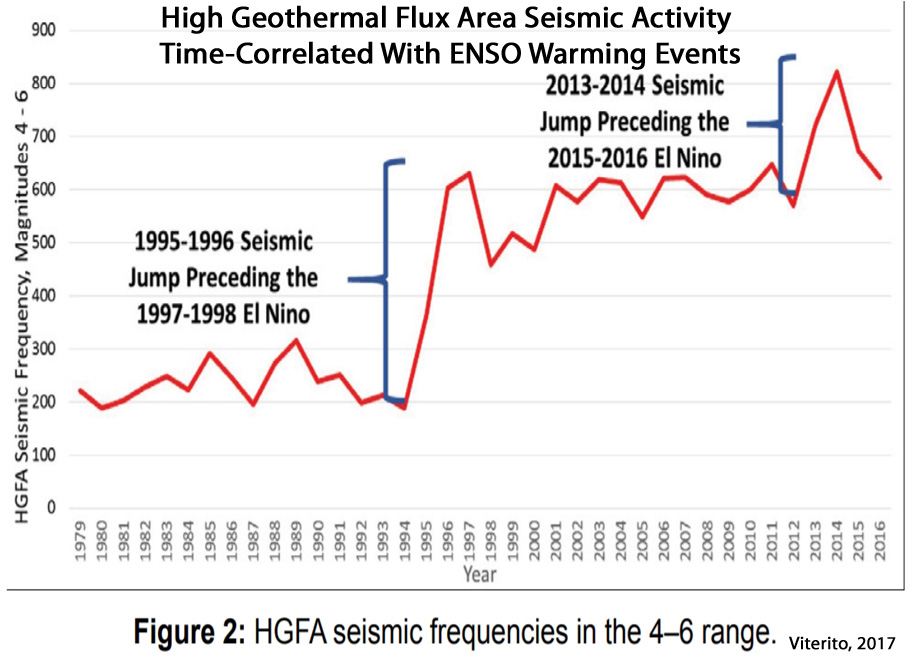
Within the last year, Dr. Arthur Viterito (geography professor) has published multiple scientific papers documenting the significant correlation (r=0.80) between the seismic activity changes in the Earth’s high geothermal flux areas (HGFA) and both El Niño events and global temperatures.
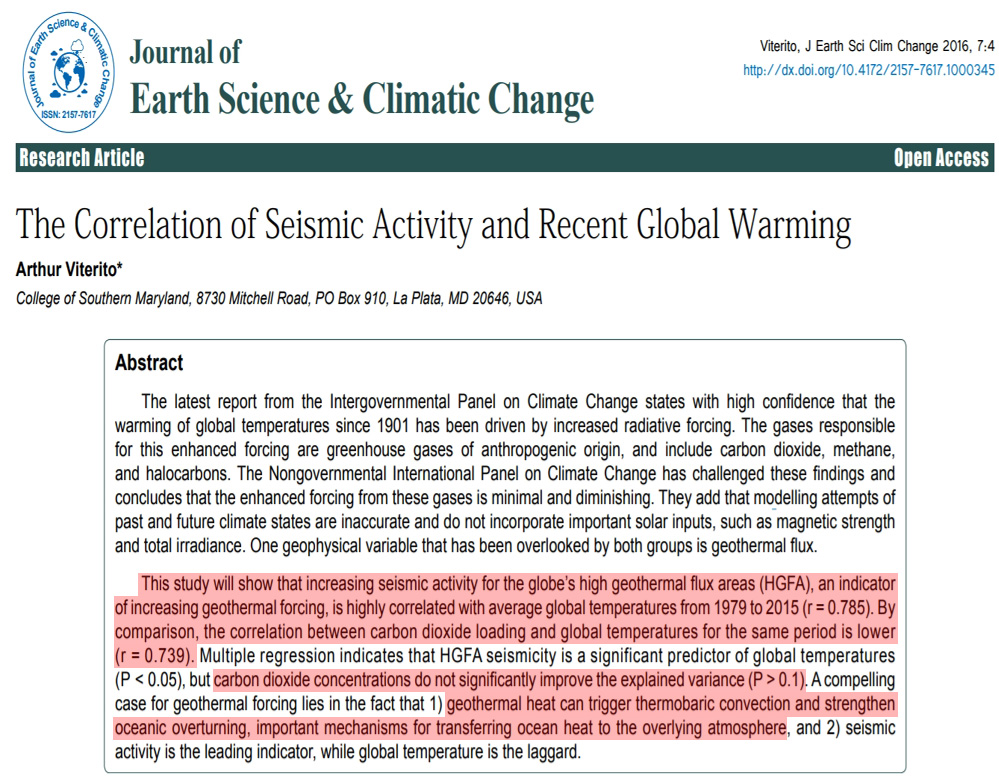
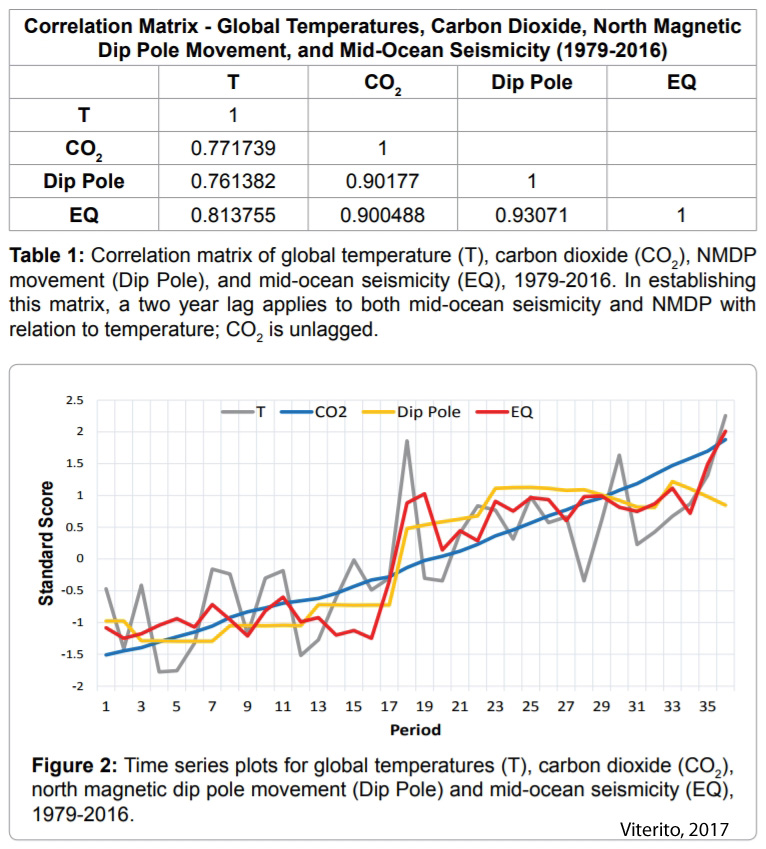
The HGFA/global temperature correlation has been found to be stronger than the correlation for CO2 concentration changes (r=0.74) for recent decades (1979-2016).
Other recent research has provided further support for the significant influence of seismic activity (i.e., there is a very high correlation [r=0.935] between geothermal flux and North Magnetic Dip Pole movement).
These robust and well-documented seismic activity associations have led Dr. Viterito to call for a reconsideration of the paradigm that says variations in atmospheric CO2 concentrations drive changes in global temperatures.
Viterito, 2016


Viterito, 2017
“The Correlation of Seismic Activity and Recent Global Warming (CSARGW) demonstrated that increasing seismic activity in the globe’s high geothermal flux areas (HGFA) is strongly correlated with global temperatures (r=0.785) from 1979-2015. The mechanism driving this correlation is amply documented and well understood by oceanographers and seismologists.”
“Namely, increased seismic activity in the HGFA (i.e., the mid-ocean’s spreading zones) serves as a proxy indicator of higher geothermal flux in these regions. The HGFA include the Mid-Atlantic Ridge, the East Pacific Rise, the West Chile Rise, the Ridges of the Indian Ocean, and the Ridges of the Antarctic/Southern Ocean. This additional mid-ocean heating causes an acceleration of oceanic overturning and thermobaric convection, resulting in higher ocean temperatures and greater heat transport into the Arctic. This manifests itself as an anomaly known as the “Arctic Amplification,” where the Arctic warms to a much greater degree than the rest of the globe.”
“As illustrated in CSARGW, jumps in HGFA seismic activity can amplify an El Niño event, a phenomenon referred to as a SIENA or a Seismically Induced El Niño Amplification. Accurately predicting two of these amplified El Niños (i.e., the 2015/2016 event plus the1997/1998 episode) is an important outcome of the HGFA seismicity/temperature relationship.”

“Applying the same methodology employed in CSARGW, an updated analysis through 2016 adds new knowledge of this important relationship while strengthening support for that study’s conclusions. The correlation between HGFA seismic frequency and global temperatures moved higher with the addition of the 2016 data: the revised correlation now reads 0.814, up from 0.785 for the analysis through 2015. This yields a coefficient of determination of .662, indicating that HGFA [high geothermal flux area] seismicity accounts for roughly two-thirds of the variation in global temperatures since 1979.”
Viterito, 2017
“[T]he idea that increased flux of oceanic geothermal heat (as indicated by increased seismic activity in these areas) can significantly alter temperature counters the hypothesis that increasing carbon dioxide has been the primary driver of recent global temperature change. Despite the general “non-acceptance” of this hypothesis, a recent study by Williams (2016) links a seemingly unrelated geophysical phenomenon to mid-ocean seismicity; thus a new paradigm may be emerging from this important association. Specifically, Williams shows that the speed at which the North Magnetic Dip Pole (NMDP) moves is highly correlated (r=0.935) with mid-ocean seismic activity.”
“More importantly, multiple regression analysis corroborates the findings of the previous studies: mid-ocean seismic activity is significantly correlated (p<0.05) with changing temperatures.”

“However, CO2 concentrations, along with NMDP [North Magnetic Dip Pole] displacements, do not explain a significant percentage of the total variance (p>0.05) when they are included and must be dropped from the analysis. This high degree of multicollinearity is a prominent finding.”
“However, it is important to note that, despite high correlations, CO2 increases cannot be causing an intensification of mid-ocean seismic activity nor can higher CO2 concentrations be driving the acceleration of the NMDP [North Magnetic Dip Pole]. There is simply no plausible mechanism that can be invoked here.”
“Clearly, there is far more in play than is currently accounted for in our understanding of earth’s climate. The shifting of plates, along with the concurrent shifts of earth’s NMDP, should spur the geophysical community to create a new and enduring paradigm that links these phenomena to changing global temperatures.”


Wasn’t the science settled in this climate debate?
/sarc
Notice the unit (and magnitude) in the first figure … the problem with correlation of two increasing time series is that they always will correlate to some extent. The question is if one can cause the other, e.g. explain the mechanism how changes in a value that is measured in milliwatts/m² (a total) can possibly cause temperature changes in the atmosphere that need W/m² size changes (not a total).
Why would deep sea temperatures warm up by multiple degrees before surface temperatures and atmospheric temperatures did (and before atmospheric CO2 rose) if geothermal heat flux cannot “possibly cause temperature changes in the atmosphere that need W/m² size changes”?
–
Stott et al., 2007
“Deep-sea temperatures warmed by ∼2°C between 19 and 17 thousand years before the present (ky B.P.), leading the rise in atmospheric CO2 and tropical–surface-ocean warming by ∼1000 years.”
–
Demezhko and Gornostaeva, 2015
“Despite the substantial dispersion of CO2 estimations, a character and a chronology of CO2 concentration changes are much closer to temperature changes rather than to heat flux variations. It may mean no significant contribution of CO2 forcing to climatically caused heat flux and thus to the temperature increase during Pleistocene–Holocene warming.”
“The increase of carbon dioxide concentrations occurred 2–3 thousands of years later than the [geothermal] heat flux increase and synchronously with temperature response.”
–
Demezhko et al., 2017
“Recently, geothermal data have been used to estimate transient climatically caused surface heat flux (SHF) changes (Beltrami et al. 2000, 2002; Beltrami 2001; Demezhko et al. 2013; Volobuev 2013; Demezhko and Gornostaeva 2015). This heat flux has been introduced as a useful new paleoclimate characteristic. It should be distinguished from the steady-state background heat flow. The latter is attributed to the Earth’s internal heat sources and does not depend on climate change. Both these fluxes are independent components of the ground surface heat balance. … GST [ground surface temperature] and SHF [surface heat flux] histories differ substantially in shape and chronology. [Subsurface] Heat flux changes ahead of temperature changes by 500–1000 years.”
————————-
Why is geothermal heat flux significantly associated with glacier melt from below for both Antarctica and Greenland…if it cannot possibly warm the atmosphere?
Even though the global average for geothermal heat is stated in milliwatts per square meter, it is still a significant driver of climate in that it impacts the thermohaline circulation. Ballarotta et al. argue that:
“Although the ocean is largely heated and thermally driven at the surface, several recent studies suggest that the OGH (oceanic geothermal heating) can also affect the ocean dynamic and heat budget…. By applying spatially constant or variable heat flux in Ocean General Circulation Models (OGCMs) forced with the present day climate, it is shown that the OGH is a significant forcing that can weaken the stability of the water column, warm the bottom water and strengthen the thermohaline circulation.” (Ballarotta et al, Impact of the Oceanic Geothermal Heat Flux on a Glacial Ocean State. Clim. Past Discuss., 11, 3597–3624, 2015 http://www.clim-past-discuss.net/11/3597/2015/ doi:10.5194/cpd-11-3597-2015).
In effect, hydrothermal venting along the ocean floor – where hydrothermal plumes can reach temperatures of 750 degrees Fahrenheit – can accelerate the rate at which the ocean overturns, thus accelerating the rate at which heat is transported into the Arctic. The amount of hydrothermal venting is reflected in the number of small-to-medium strength earthquakes realized along the ocean’s system of ridges, a 40,000 mile chain of volcanic mountains located under 3 miles of water (average depth). Thus the earthquake frequencies along these mid-ocean ridges serve as a good proxy for the amount of hydrothermal venting, much the same as tree rings serve as a proxy for temperature and rainfall for the area where the tree grew. As my studies show, the correlations for the mid-ocean earthquake frequencies and global temperatures is strikingly high. Additionally, there is a pronounced lag, as global temperature change lags the change in mid-ocean seismic activity by two years.
“The question is if one can cause the other,”
Or if something else is causing both?
SebH wants to apply the same logic to the CO2 problem if he might. SebH just explained why cannot trust the correlation with CO2 either.
He says himself only 0.3% change of temperature when atmosphere temperature goes up one Kelvin. This is a milli change. so milli change in Watt is importaant. No?
The key thing here, SebastianH is that seismic activity leads global temperature change, unlike increased CO2 which lags global temperature change (Humluma,Stordahlc, Solheimd (2013) The phase relation between atmospheric carbon dioxide and global temperature.Global and Planetary Change; Volume 100, Pages 51–69).
Or don’t you believe in cause and effect?
Is that the case in the last hundred years? Besides the variations caused by changes in sea surface temperatures, did the large increase in those hundred years lag behind any temperature change?
And again: mW/m² as a total value vs. W/m² of change needed to explain the climate change. How does that work? They might correlate, but what is the physical mechanism? Do you believe correlation is causation?
We can’t test the hypothesis back 100 years as the global seismic network only became operational in the mid 1970s. As for “milliwatts vs watts” this is the wrong question.
First, a little background: the oceans contain about 1,000 times as much heat as the atmosphere. If you get the ocean to flow faster, there will be a greater flux of heat from the ocean to the overlying atmosphere. This is especially true in the Arctic, where the Atlantic Meridional Overturning Circulation (AMOC) is a significant source of heat to the overlying atmosphere. The Gulf Stream, a component of the AMOC, is the primary surface current in the north Atlantic, and provides Europe with as much heat as 1,000,000 nuclear power plants. Increase the geothermal heat at the bottom, then AMOC and the Gulf Stream – a massive heat pump – run faster. This brings warmer water into the Arctic, causing more snow and ice to melt, which in turn lowers the Arctic’s albedo. This causes greater absorption of sunlight in the region, amplifying the warming even further, a “positive feedback.”
As for the question “is correlation causality?” the answer is always “maybe.” If you can find a causal mechanism – and I believe we have in this case – then the answer is yes. Sadly, I hear this all the time from my critics but it is nothing more than a red herring. In fact, to say that “correlation is not causality” is to use the same defense the tobacco companies used when the epidemiological studies showed a strong correlation between smoking and lung disease. When you have a high correlation AND a plausible mechanism, you are compelled to link the two and investigate the relationship further. To ignore that is a dereliction of our “scientific duty” so to speak.
Thank you for your contributions, Dr. Viterito.
The main limiting/cautionary concern with the above comment is that we often only have data from a short time period with which to assess correlation/causation properly. For example, it is often claimed that because the ocean temperatures have risen since the 1940s, and CO2 levels have risen since the 1940s, that this therefore means that CO2 increases are the primary/exclusive cause of the increase in ocean temperatures since the 1940s. That ocean temperatures rose and fell at much faster rates and amplitudes in the past without the contributions of anthropogenic CO2 emissions is therefore excluded from consideration. The short-term correlation thus affirms the causation for the uninitiated. And that is how the other side operates.
That said, the seismic correlation with the two Super El Nino events in your papers is especially compelling for me personally, as the connection would appear to make a great deal of sense. Worthy of further investigation indeed.
Thank you for your thoughtful commentary and for highlighting my work.
This hypothesis will face a more rigorous test in the next two years as there has been a sizable shift in mid-ocean seismic activity. Specifically, mid-ocean seismic frequency has been dropping the past 11 months and is starting to resemble the frequencies we saw back in the mid 1990s. That is the period which immediately preceded the first super El Nino and the plateauing of (higher) temperatures the past 21 years, a.k.a. “The Pause”. IF my hypothesis is correct and IF the drop in seismic activity continues, we could see global temperatures start to decline significantly in 2019. It’s an exciting time to be actively researching in this area!
Ironically it is the exact same folks (Singer, Seitz, Heartland, etc.) using the same tactics as the tobacco companies that are attempting to cast doubt on climate science.
You know that the smear-merchant-tactics don’t work in notrickszones, so why do you bother?
Maybe there is a solar/gtf connection? Earthquakes have been known to occur at times when there is significant solar weather creating geomagnetic storms in the Earth’s magnetosphere.
I have no idea of any possible connecting mechanism but maybe a correlation should be looked for. There’s a lot we don’t know about the planet’s interactions with its star.
Interesting!
James Edward Kamis proposes a similar “Plate Climatology Theory” with several interesting posts in Climate Change Dispatch:
http://climatechangedispatch.com/further-proof-el-ninos-are-fueled-by-deep-sea-geological-heat-flow/
I met Dr Arthur Viterito at the Heartland ICCC-9 Luke Little Warmists Love Fest, Vegas, 2014 and have supported Geothermal forcing since my “Motive Force for Climate Change” was posted at ClimateRealists, May 2009.
I recommend “Volcanic CO2” by Timothy Casey at Geology-1011 website.
and my “Earth’s Missing Geothermal Flux” at FauxScienceSlayer website.
Where 30% of solar insolation is reflected or filtered from the surface, 100% of Geothermal Flux passes through the biosphere. There is a high probability that solar particle emissions are linked to volcanism and that the partial solar particle emission protection from Earth’s magnetosphere are linked. Focus on one, natural, benign gas molecule is myoptic.
Kenneth – you sure do love to cite predatory journals, don’t you? Here is a list for your edification.
http://beallslist.weebly.com/
Attacking the “messenger” (in this case, the journals where these articles were published) instead of the message is highly disingenuous. So I ask you to please read the articles, and the works they reference, before you judge.
Number of science academies in any country on the planet that dispute the conclusions of the IPCC = 0
Number of science academies in any country on the planet that endorse the conclusions of the Heartland funded NIPCC = 0
Poor Jack, unable to understand the philosophy of science, looks for authorities to lean on. Argumentum ad auctoritatem certainly does not cut it in science, even if fools like you fall for it.
You should consider reading The Structure of Scientific Revolutions by Thomas Kuhn in which he discusses the role of consensus in scientific paradigms. That might help you to comprehend scientific ontology and epistemology.
The Cliff’s Notes version: https://plato.stanford.edu/entries/thomas-kuhn/#3
Measuring the human skull, or craniometry, was once considered “consensus” science; one’s intelligence and racial superiority/inferiority were widely thought (by scientists) to be connected to one’s cranial measurements. The scientific consensus served to justify decades of biological racism that extended through the mid-20th century.
http://www.npr.org/sections/13.7/2017/08/25/545508337/science-gone-wrong-can-teach-us
“Crucially,”eugenics” was establishment science in the mid-20th century. Courses on eugenics were offered at our universities and colleges and most high school textbooks included racist misinformation. Eugenics was widely believed to provide a sound basis for law and social policy.”
Methinks you are the one clinging to a paradigm that has passed you by, thanks to folks like Guy Callendar. Yours was the established science until 1938.
What consensus paradigm might it be that you think I am clinging to, Jack?
Are you capable of responding to the points made in the article itself regarding seismic activity and ENSO and temperature correlations?
Kenneth – You cling to the pre-1938 view that nature alone affects climate.
I provide a lengthy response regarding seismic activity and ENSO and temperature correlations which immediately went to moderation. It included a comment from Erik Klemetti, a volcanologist.
No, I think that humans can have some impact on climates — especially regional ones. Urbanization and land use change definitely affect climates. Any other straw men you wish to concoct?
BEST on UHI http://www.scitechnol.com/2327-4581/2327-4581-1-104.pdf
You cling to the naive view that CO2 is simply plant food and has little impact on the climate. You are dismissive of climate science. You remind me of Philipp Lenard.
I have yet to find real-world scientific evidence verifying how much or how little varying CO2 concentrations over water bodies in volumes of parts per million (0.000001) cause heat changes in said water bodies. Do you know?
What’s the reason why the ocean’s heat content plummeted by -0.9 C (temperature) between 1,000 C.E. and 1600-1800 C.E.? What was the mechanism that caused that cooling, Jack, since CO2 concentrations didn’t fluctuate by more than 1 or 2 ppm during that period?
Why were the oceans 2 degrees C warmer than now during the Holocene Thermal Maximum (9,000-6,000 years ago), when CO2 levels were in the 260s ppm range? Why were sea levels about 2 meters higher than they are now about 5,000 years ago?
Actually, I love climate science. That’s why we were able to accumulate 500 peer-reviewed scientific papers that support a skeptical position on global warming alarm for 2016. And already this year, we are approaching 400.
Kenneth – You have a problem!
I checked out the first of your 2016 papers by Jorge Sánchez-Sesma. https://www.earth-syst-dynam-discuss.net/esd-2016-38/esd-2016-38.pdf
The first thing I notice is “Manuscript under review for journal Earth Syst. Dynam.”
I also notice that the author is an independent consultant with a yahoo.com email – not that common among scientists. My CRAAP detector sets off an alarm.
Then I decide to check out Earth Systems Dynamics, a Copernicus Publication in whom I have some faith as they terminated publication of Pattern Recognition in Physics) for malpractice. https://www.pattern-recognition-in-physics.net/
Checking further I find:
07 Sep 2016
The Earth’s climate system recurrent & multi-scale lagged responses: empirical law, evidence, consequent solar explanation of recent CO2 increases & preliminary analysis
Jorge Sánchez-Sesma
Earth Syst. Dynam. Discuss., https://doi.org/10.5194/esd-2016-38, 2016
Manuscript not accepted for further review (discussion: closed, 6 comments) https://www.earth-syst-dynam.net/search.html?author=S%C3%A1nchez-Sesma
The reviewer comments can be found here. https://www.earth-syst-dynam-discuss.net/esd-2016-38/
Comments include:
“Anonymous Referee #1
Received and published: 19 October 2016
This paper presents a statistical analysis of several environmental and solar proxies.
The objective is to outline time lags between terrestrial environmental proxies and solar
variability. The paper suffers from a large number of flaws, including in the presentation
that prevent me from recommending its publication.”
“The quality of this study if well below the standards of rigorous scientific publications: it
suffers from a large number of flaws, both technical and methodological. Most claims
are lacking statistical evidence, and are not supported by physical explanations. For
that reason I recommend to reject it without revision. Some general comments are
listed below, with a few examples.
”
That paper was peer-reviewed and rejected. Do you not bother to check the such basic consideration?
Do I need to go through each the papers?
Which of the following two conclusions should I draw?
1) You were deceived.
2) You are a deceiver.
If you love climate science, you would not abuse it.
Yes. Just 501 to go from 2016 (there were 502, rounded down). Get started.
Then, you can start in on 2017, which hasn’t been updated since June, so there are about 100 more papers that have been added to these two links:
https://notrickszone.com/skeptic-papers-2017-1/
https://notrickszone.com/skeptic-papers-2017-2/
Here’s a post from over a month ago that has about 80 of the 100+ Sun-Climate papers from this year, which makes for easy-access reading:
Attribution Shift: Scientists Increasingly Link Climate Change To Solar Forcing In Scientific Journals
https://notrickszone.com/2017/05/29/80-graphs-from-58-new-2017-papers-invalidate-claims-of-unprecedented-global-scale-modern-warming/#sthash.Tws1DJMZ.dpbs
And here’s a link to May paper that has been “shared” and re-tweeted 36,000 times. It contains links to hundreds of scientific papers with graphs that show no hockey stick inclines or unusual temperature changes in the modern era.
–
We await your thoughtful and substantive refutation of each of these papers, Jack.
Neither. Because there are so many papers that support a skeptical stance on alarming climate change, when a paper is published online, it’s added to the list. Sometimes the final decision on acceptance for publication doesn’t come until many months later, and this is not easy to keep track of with the dozens of new papers that come online every day. I will gladly remove this particular paper from the list now that I know it wasn’t accepted.
Did you really think this was going to “expose” me, Jack? You’re in way over your head here.
Funny that Jack mentions Kuhn and at the same time is policing consensus by appeals to arguments of authority. It seems obvious that poor Jack has not understood most of what Kuhn wrote about scientific revolutions.
Blow away all Jack’s smoke and mirrors, and his argument boils down to “that paper wasn’t accepted for publication.” We can all accept that, as did Kenneth Richard.
That’s all you needed, Jack. Ditch the attitude.
=====================================================
Taking another look at Jack’s own link to the “CRAAP-test.”
https://www.csuchico.edu/lins/handouts/eval_websites.pdf
I can’t help but notice that we are to ask if an individual is generally credible. In the case of Jorge Sanchez-Sesma we see that, yes he is.
1. He has 11 published papers.
https://www.researchgate.net/profile/Jorge_Sanchez-Sesma/publications
2. He is also recognized by his peers as making useful contributions to the field.
https://judithcurry.com/2016/06/27/are-we-headed-for-a-new-solar-minimum/
What does all this mean for Jack’s attack on his paper that was rejected for publication? Well, since it would be hard for any scientist to go through their career without some rejections, it would seem not much in this case. By focusing on that one negative, and taking it out of the otherwise positive context of his life’s work, I can only conclude that Jack isn’t being totally straight with us.
Seems Jack once again flunks his own CRAAP test.
Number of science academies in any country that accepted Alfred Wegener’s theory of continental drift, a.k.a. plate tectonics: 0.
Here is a good history on Wegener’s brilliant theory, a theory which is the cornerstone for all of the geosciences.
http://www.smithsonianmag.com/science-nature/when-continental-drift-was-considered-pseudoscience-90353214/
@Jack Dale 25. September 2017 at 8:51 PM
VERY sad testimony to the profound decline in the quality of science, when so many scientific societies worldwide have been infiltrated by activist hacks.
Fortunately there are still scientists of integrity who do not approve.
https://wattsupwiththat.com/2011/09/14/nobel-laureate-resigns-from-american-physical-society-to-protest-the-organizations-stance-on-global-warming/
[…] New Papers: Seismic Activity Explains 1979-2016 Temperatures, ENSO Events Better Than CO2. Within the last year, Dr. Arthur Viterito (geography professor) has published multiple scientific papers documenting the significant correlation (r=0.80) between the seismic activity changes in the Earth’s high geothermal flux areas (HGFA) and both El Niño events and global temperatures. The HGFA/global temperature correlation has been found to be stronger than the correlation for CO2 concentration changes (r=0.74) for recent decades (1979-2016). Other recent research has provided further support for the significant influence of seismic activity (i.e., there is a very high correlation [r=0.935] between geothermal flux and North Magnetic Dip Pole movement). […]