By Kenneth Richard on 1. April 2019
Glaciers in Sweden melted ~7 times faster during the 1920s to 1960s than from 1970 to 2015.
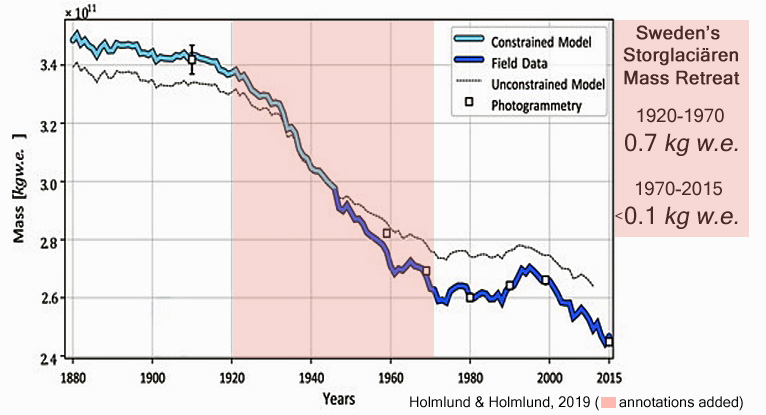
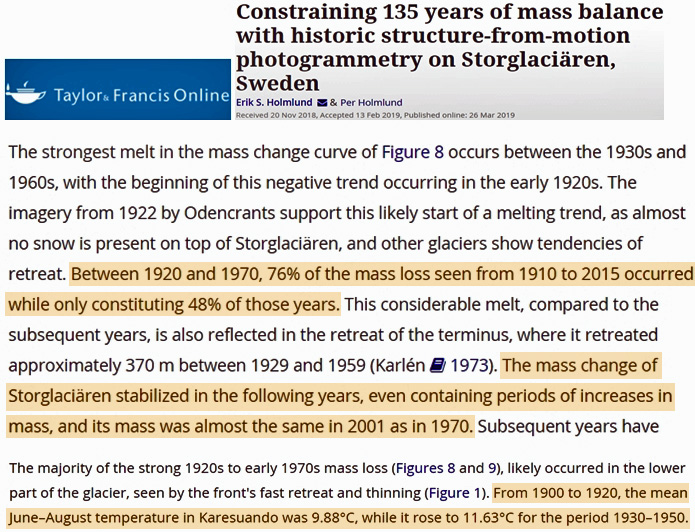
“The strongest melt in the mass change curve […] occurs between the 1930s and 1960s, with the beginning of this negative trend occurring in the early 1920s. The imagery from 1922 by Odencrants support this likely start of a melting trend, as almost no snow is present on top of Storglaciären, and other glaciers show tendencies of retreat. Between 1920 and 1970, 76% of the mass loss seen from 1910 to 2015 occurred while only constituting 48% of those years. This considerable melt, compared to the subsequent years, is also reflected in the retreat of the terminus, where it retreated approximately 370 m between 1929 and 1959 (Karlén 1973). The mass change of Storglaciären stabilized in the following years, even containing periods of increases in mass, and its mass was almost the same in 2001 as in 1970.”
“Various weather parameters from Tarfala Research Station, a kilometre north east of Storglaciären, exist since 1945, measuring average summer and winter temperatures of +5.5°C and −8.9°C, respectively. From 1900 to 1920, the mean June–August temperature in Karesuando was 9.88°C, while it rose to 11.63°C for the period 1930–1950.”
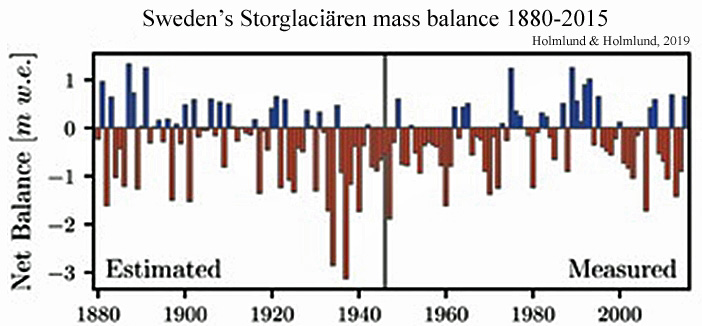
“[G]enerally lower ELA between 1880 and the 1930s, with occasional high values, and the ELA reaches comparable lows during the late 1970s and 1990s, corresponding with positive mass balance. The curve thus suggests similar conditions in the late 1800s to, for example, the 1990s.”
A West Greenland glacier that had previously been the “single largest source of mass loss” to sea level rise (a staggering contribution of 9/100ths of a cm during 2000-’10) has recently begun “dramatic thickening” after an abrupt reversal to cooling (-2°C) since 2014.
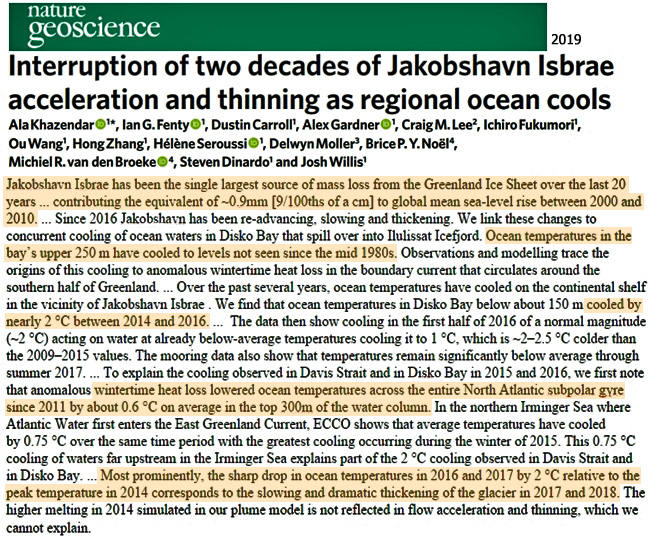
“Jakobshavn Isbrae has been the single largest source of mass loss from the Greenland Ice Sheet over the last 20 years. During that time, it has been retreating, accelerating and thinning. Here we use airborne altimetry and satellite imagery to show that since 2016 Jakobshavn has been re-advancing, slowing and thickening. We link these changes to concurrent cooling of ocean waters in Disko Bay that spill over into Ilulissat Icefjord. Ocean temperatures in the bay’s upper 250 m have cooled to levels not seen since the mid 1980s. Observations and modelling trace the origins of this cooling to anomalous wintertime heat loss in the boundary current that circulates around the southern half of Greenland.”
“Over the past several years, ocean temperatures have cooled on the continental shelf in the vicinity of Jakobshavn Isbrae . We find that ocean temperatures in Disko Bay below about 150 m cooled by nearly 2 °C between 2014 and 2016.”
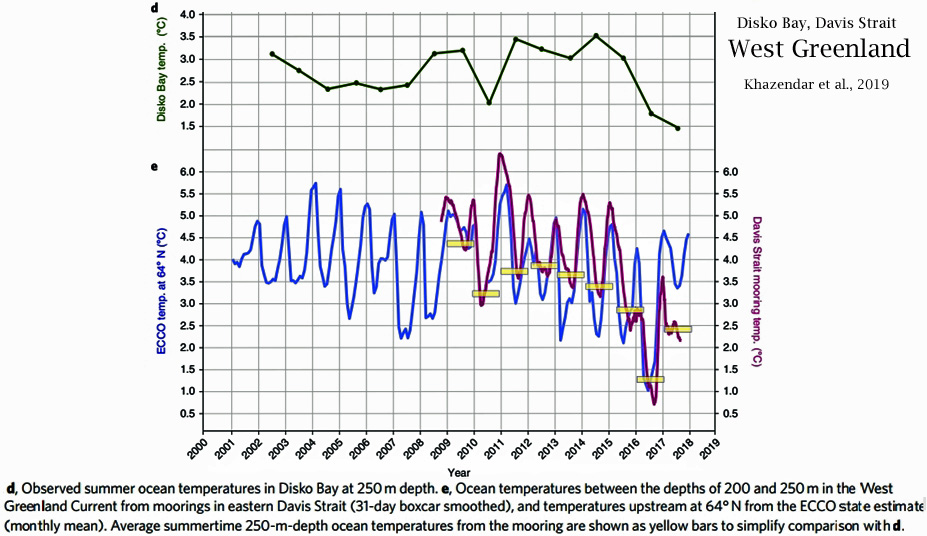
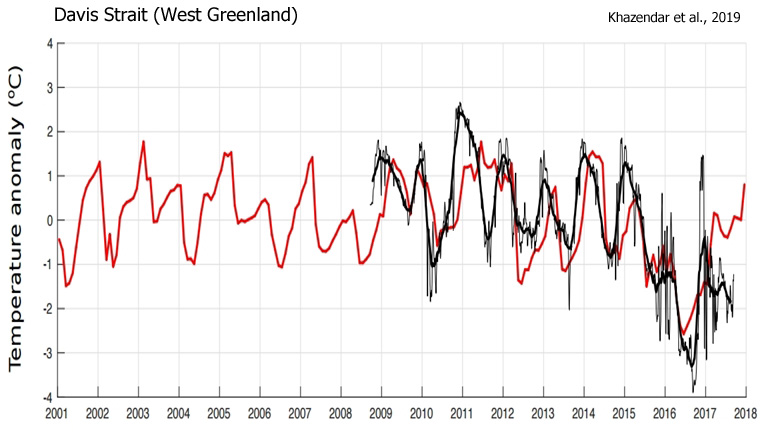
“The data then show cooling in the first half of 2016 of a normal magnitude (~2 °C) acting on water at already below-average temperatures cooling it to 1 °C, which is ~2–2.5 °C colder than the 2009–2015 values. The mooring data also show that temperatures remain significantly below average through summer 2017.”
“Since the late 1990s, Jakobshavn developed Greenland’s largest cumulative ice discharge anomaly, contributing the equivalent of ~0.9mm [9/100ths of a cm] to global mean sea-level rise between 2000 and 2010.”
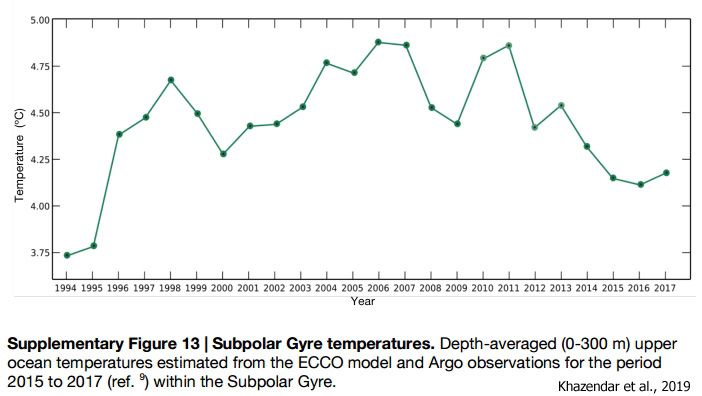
“To explain the cooling observed in Davis Strait and in Disko Bay in 2015 and 2016, we first note that anomalous wintertime heat loss lowered ocean temperatures across the entire North Atlantic subpolar gyre since 2011 by about 0.6 °C on average in the top 300m of the water column (Supplementary Fig. 13). In the northern Irminger Sea where Atlantic Water first enters the East Greenland Current, ECCO shows that average temperatures have cooled by 0.75 °C over the same time period with the greatest cooling occurring during the winter of 2015. This 0.75 °C cooling of waters far upstream in the Irminger Sea explains part of the 2 °C cooling observed in Davis Strait and in Disko Bay.”
“Most prominently, the sharp drop in ocean temperatures in 2016 and 2017 by 2 °C relative to the peak temperature in 2014 corresponds to the slowing and dramatic thickening of the glacier in 2017 and 2018. The higher melting in 2014 simulated in our plume model is not reflected in flow acceleration and thinning, which we cannot explain.”
Posted in Cooling/Temperature, Glaciers |


More in this book:
https://archive.org/details/glaciervariation00ahlm
Page 31 “endless series of climatic fluctuations”