Scientists admit that 3 different Greenland Summit (GISP2) temperature reconstruction “strategies” produce 3 different paleoclimate temperature results. The reconstructions chosen as the most “robust” are therefore the ones that align best with the authors’ presuppositions.
In a new study published in Quaternary Science Reviews scientists (Döring and Luenberger, 2022) report they reject a reconstruction of Greenland Summit temperatures that shows it has cooled ~4°C since Roman times (shown below as the red trend line, extended to 2000 C.E.).
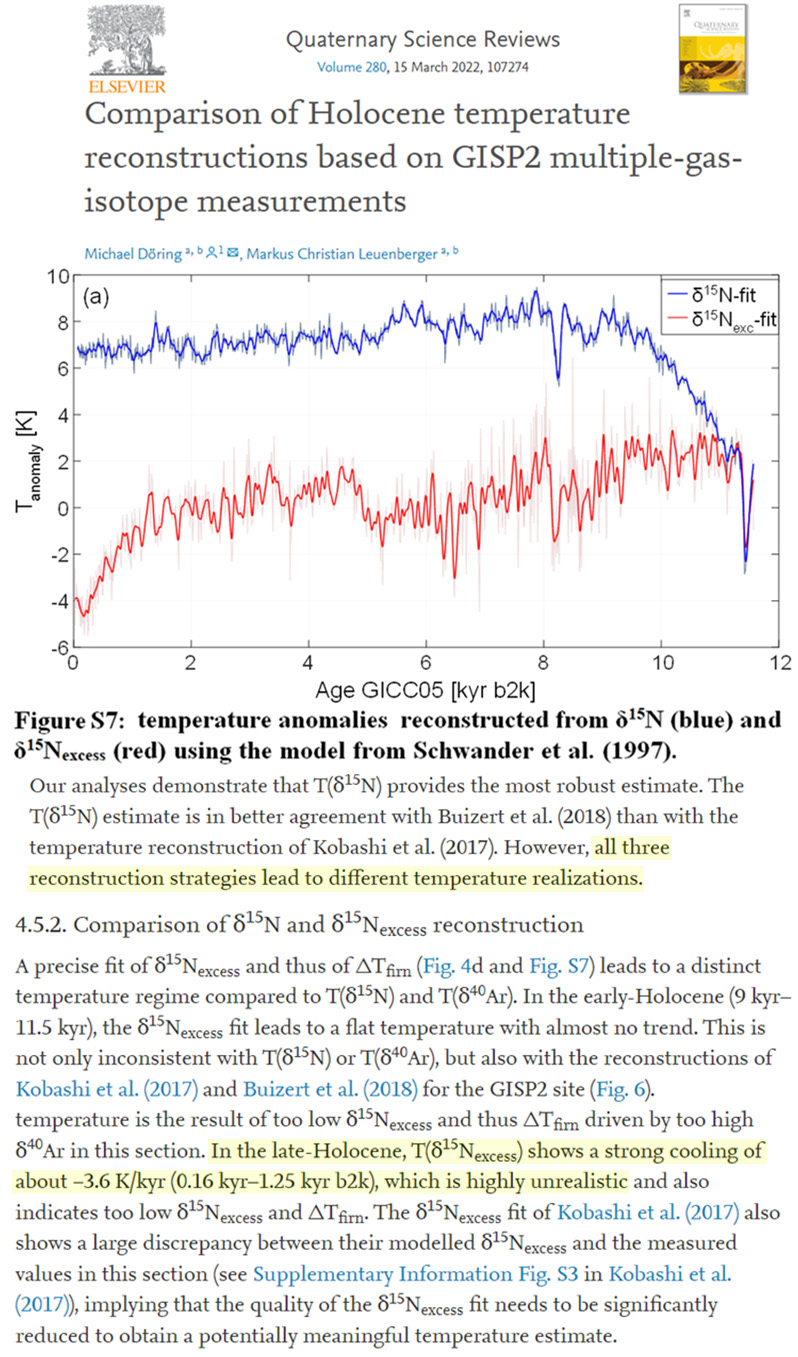
Image Source: Döring and Luenberger, 2022
They claim this temperature reconstruction showing cooling into the recent century is “highly unrealistic”. It doesn’t support the claims of an alarmingly rapid and unprecedented warming of the modern Arctic. It also doesn’t align with two other GISP2 reconstructions that use different model “strategies” and thus produce different temperature results.
Had this reconstruction depicted unusual warming in the last century (to 2000 C.E.), it would likely not have been rejected. This may demonstrate the selection bias inherent in paleoclimate studies. Scientists are not above tendentiously tossing out the data that do not conform to what they believe to be truth.
For example, Neftel et al. (1982) had published a paper in the journal Nature documenting a CO2 rise of about 230 ppm (~190 ppm to 430 ppm) from roughly 12,000 to 10,000 years ago for a Greenland ice core. The CO2 record showed fluctuations of >100 ppm throughout the Holocene. Then, using the very same data from the same ice core a few years later, Neftel et al. (1988) only displayed the CO2 readings that aligned with the narrative that CO2 only fluctuated between 250 and 280 ppm between 12,000 and 5,000 years ago. The 390, 410, and 430 ppm CO2 measurements still existed, but they were not shown in the more recent publication.
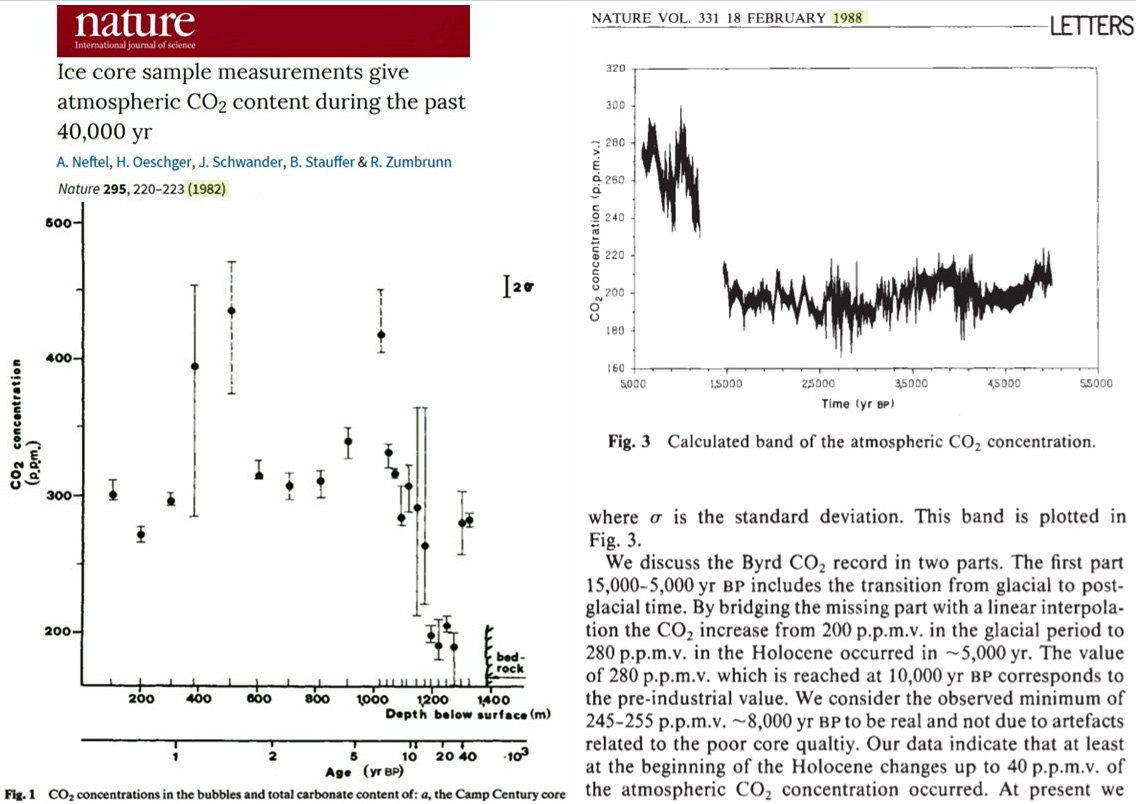
Image Source: Neftel et al. (1982) and Neftel et al. (1988)
The ~4°C Greenland Summit cooling since the Roman Warm Period depicted in the Döring and Luenberger reconstruction is consistent with other reconstructions for this region documenting a conspicuous Late Holocene expansion of Greenland’s ice volume and ice area extending into the modern period (Mikkelsen et al., 2018, Weiser et al., 2021, Nielsen et al., 2018). These reconstructions suggest Mid-Holocene temperatures may have been “more than 5°C above present” across Greenland.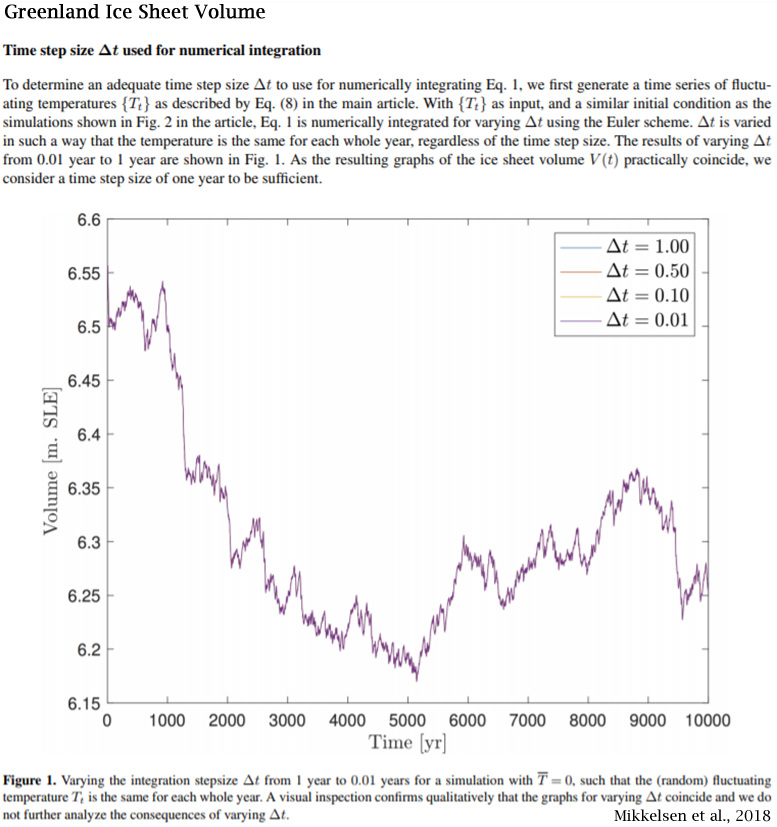
Image Source: Mikkelsen et al., 2018
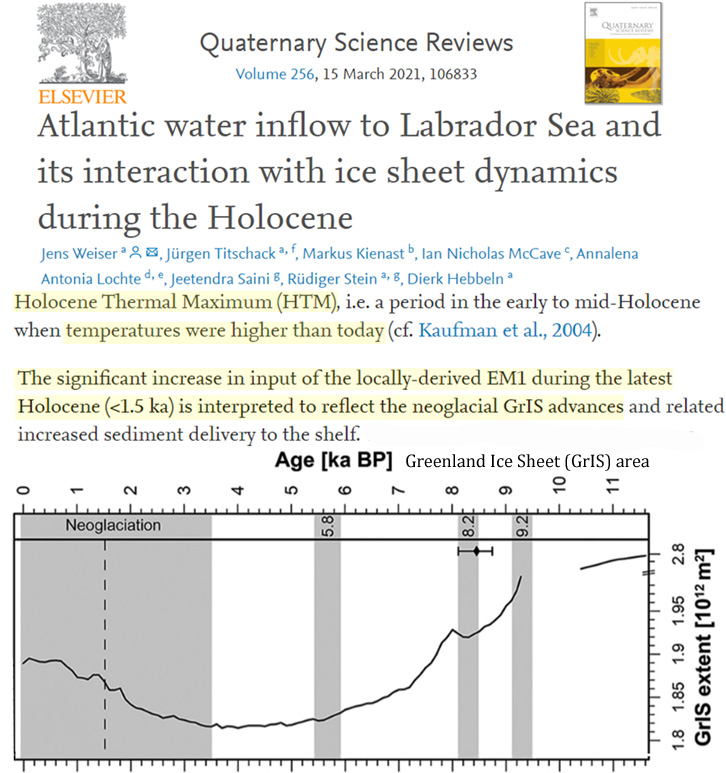
Image Source: Weiser et al., 2021
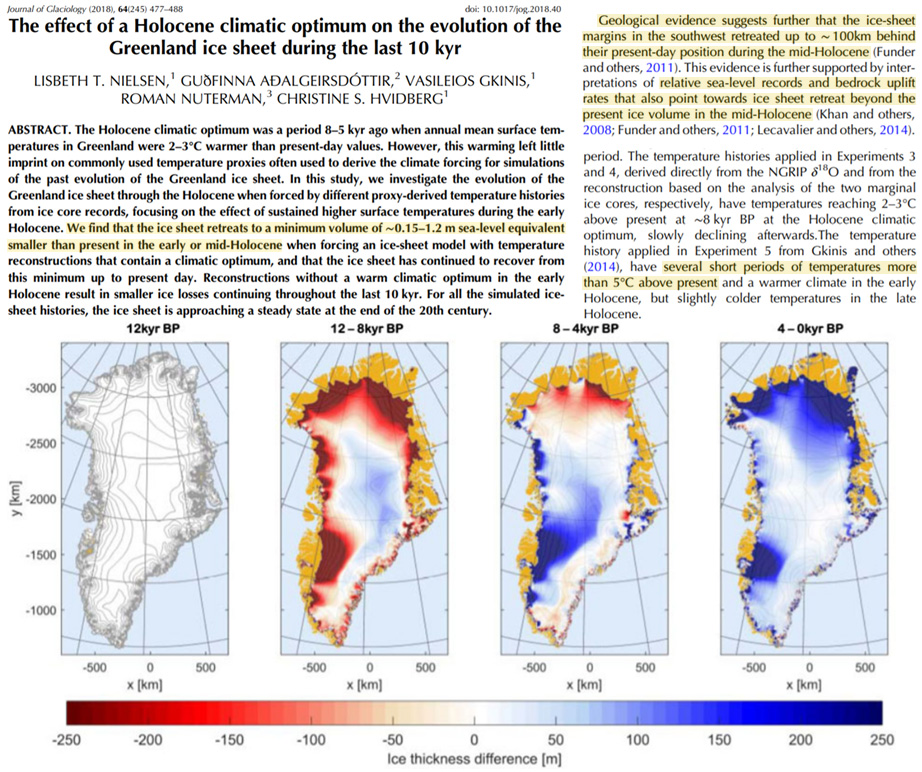
Image Source: Nielsen et al., 2018
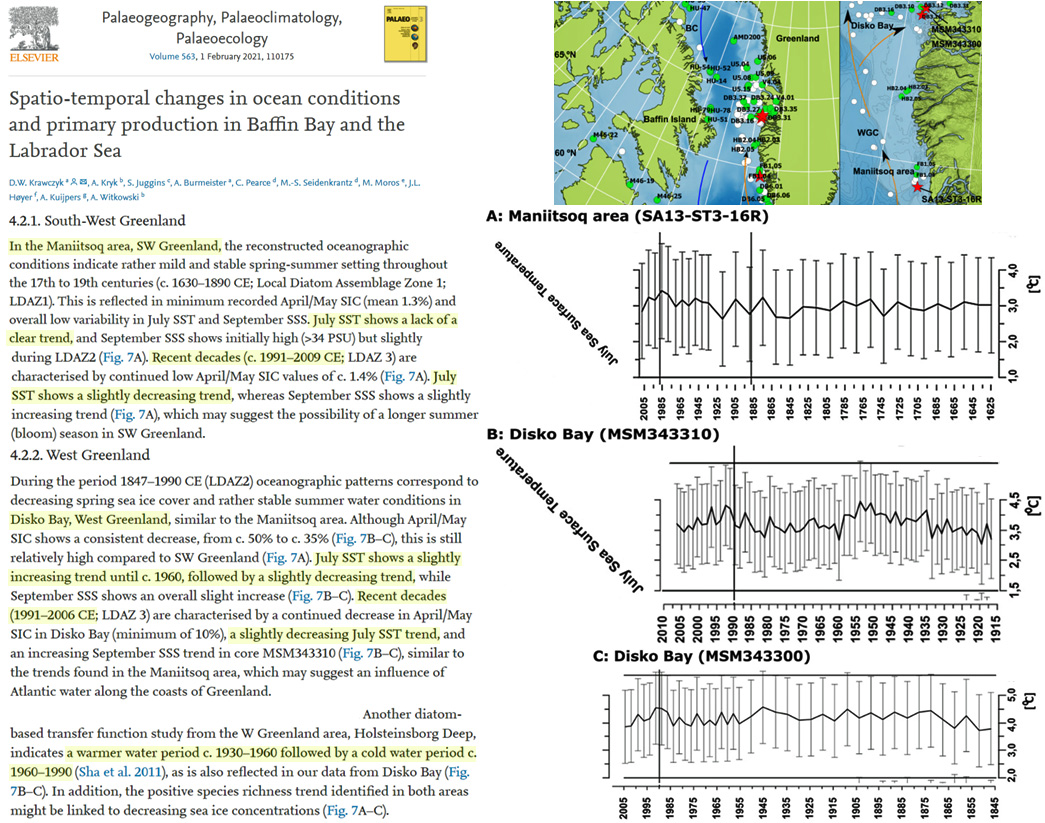
Other temperature reconstructions indicate modern Greenland temperatures are 6-8°C colder than they were during the Early and Middle Holocene (Allan et al., 2021), and there were as-warm or warmer temperatures during the 1600s to 1800s (Krawczyk et al., 2021) in southwest Greenland, with a “slightly decreasing trend” in recent decades.
Thus, a progressive cooling for the last 2,000 years continuing into the 21st century may be no less “realistic” than other Greenland temperature reconstructions that depict less modern era cooling.
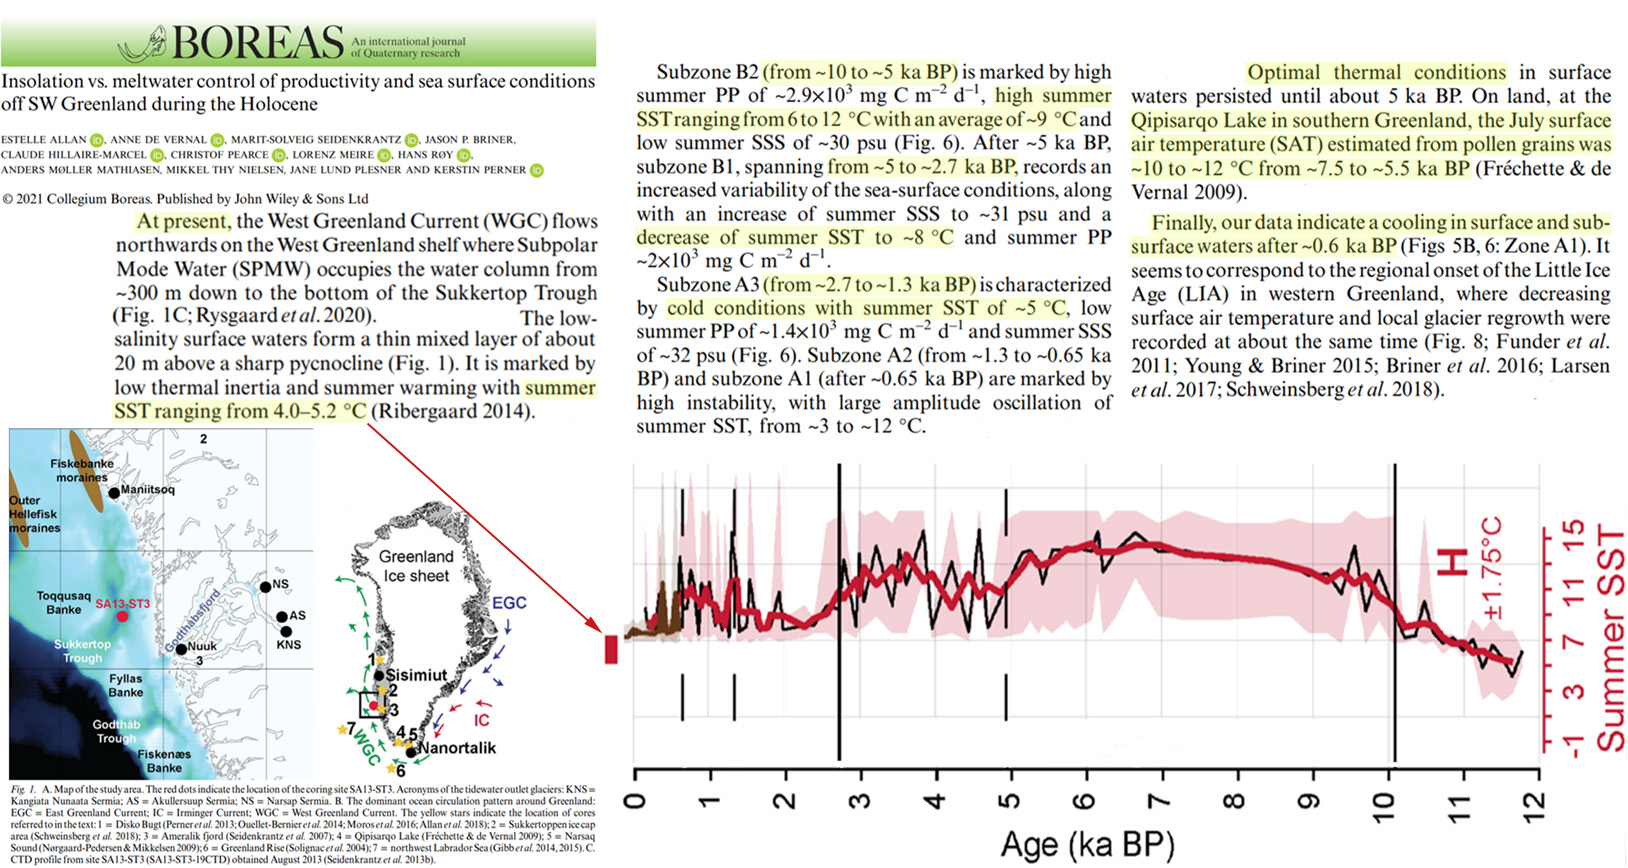
Image Source: Allan et al., 2021


“New Analysis Of Greenland’s GISP2 Temperatures Expose Selection Bias In Paleo Reconstructions”
From a scientific point of view, using selection bias is politics, not science.
Ha Ha …. I am reminded of the old quote from my days in university in the 1970’s “torture the data until it yields the correct results”.
Back then we were being sarcastic but these days it is the normal way of operating.
Excellent work which shows the pseudo-scientific bias being perpetrated on data to feed a false narrative.
Ernst-Georg Beck showed that the fraud on CO2 measurements begun with Callendar in the 40s when he carefully discarded any data and published papers which did not cooperate with the “CO2 emission from human activity induces climate warming” narrative.
Ernst-Georg Beck’s thesis summary :
https://friendsofscience.org/assets/documents/180CO2_summary.pdf
The thesis :
180 Years of Atmospheric Co2 Gas Analysis by Chemical Methods
https://21sci-tech.com/Subscriptions/Spring%202008%20ONLINE/CO2_chemical.pdf
They have to erase the settlements also.
Settlements of Norwegians harvesting from a land the named Greenland.
Eventually abandoned due to cooling during 1300-1400.
In addition, to increasing crop yields, increased CO2 enables plants to live in regions were there is sparse rainfall. C3 plants (trees, cereal crops, and shrubs) lose roughly 50% of the water they absorb due to trans-respiration (loss of water from the plant’s stomata which are holes in the leaves to let in CO2). When CO2 rises C3 plants produce less stomata which reduces the water loss in the plant. This results in more water at the root of the plant which enables synergistic bacteria on the roots to produce more nitrogen byproducts which increases plant growth.
A higher level of atmospheric CO2 enables plants to make more effective use of water and enables the plant to survive in regions of low rainfall such as deserts.
http://www.omafra.gov.on.ca/english/crops/facts/00-077.htm
Ontario, Canada Ministry of Agriculture, Food, and Rural Affairs
Carbon Dioxide In Greenhouses
The benefits of carbon dioxide supplementation on plant growth and production within the greenhouse environment have been well understood for many years
For the majority of greenhouse crops, net photosynthesis increases as CO2 levels increase from 340–1,000 ppm (parts per million). Most crops show that for any given level of photosynthetically active radiation (PAR), increasing the CO2 level to 1,000 ppm will increase the photosynthesis by about 50% over ambient CO2 levels.
The level to which the CO2 concentration should be raised depends on the crop, light intensity, temperature, ventilation, stage of the crop growth and the economics of the crop. For most crops the saturation point will be reached at about 1,000–1,300 ppm under ideal circumstances.
http://www.sciencedaily.com/releases/2003/05/030509084556.htm
Greenhouse Gas Might Green Up The Desert; Weizmann Institute Study Suggests That Rising Carbon Dioxide Levels Might Cause Forests To Spread Into Dry Environments
…..However, the Yatir forest is growing at a relatively quick pace, and is even expanding further into the desert.
http://news.nationalgeographic.com/news/2009/07/090731-green-sahara.html
The green shoots of recovery are showing up on satellite images of regions including the Sahel, a semi-desert zone bordering the Sahara to the south that stretches some 2,400 miles (3,860 kilometers). Images taken between 1982 and 2002 revealed extensive regreening throughout the Sahel, according to a new study in the journal Biogeosciences.
Why did Neftel remove the high 390, 410, and 430 ppm CO2 measurements?
Is the data invalid or is the data removed because the Greenland ice core maybe are more affected by melting and high temperatures that the Antartic icecore?
Anyway, the below article is interesting.
https://wattsupwiththat.com/2020/01/07/greenland-ice-core-co2-concentrations-deserve-reconsideration/