Instead of focusing on probabilistic percentages and constructed correlations between two events in efforts to determine potential causality, 4 scientists have revisited the requisite conditions for causality in applying the scientific method. They find “the common perception that increasing CO2 causes increased [temperature] can be excluded because it violates the necessary condition for this causal direction.”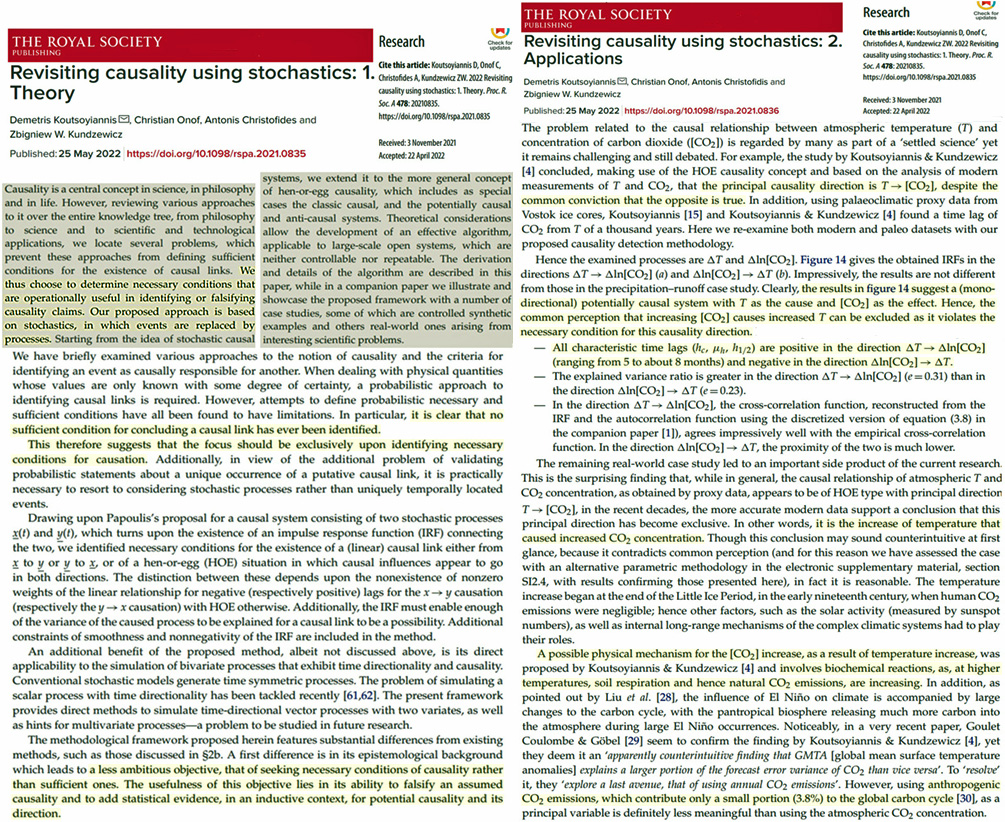
Image Source: Koutsoyiannis et al., 2022 (1) and Koutsoyiannis et al., 2022 (2)
In the modern, politically-charged version of climate science there is an emphasis on (anthropogenic) attribution and theoretical confirmation from the manufacture of visually-satisfying correlations.
The scientific method, in contrast, requires repeated and vigorous attempts to falsify the hypotheses used to construct the theory in question. Modern climate science often skips this process.
Instead, there is a presupposition that the determination of causality can be achieved via the construction of a curve-fitted correlation between two variables, then imagining any alternative causal variables can be “ruled out” if and when these alternative curves don’t align as well as the preferred variables do.
For example, if the theory is that polar bears cannot survive without thick sea ice in summer, the current emphasis is on seeking confirmation that polar bear populations are declining. A declining population trend can then be neatly paired with trends in declining Arctic sea ice, suggesting a causal link. The assumption that polar bears need thick sea ice to catch seals and survive (even though they may have evolved 4-5 million years ago, or when the Arctic was 22-25°C warmer-than-today) is not subjected to falsification. It’s simply accepted as established truth that sea ice is essential to polar bear survival. And if anyone disagrees with this presuppositional truth, she is smeared as a “denialist” deluded by misinformation-peddling internet bloggers (e.g., Harvey et al., 2017).
The Real Scientific Method: Observing Stochastic Processes
Two companion papers (Koutsoyiannis et al., 2022 (1) and Koutsoyiannis et al., 2022 (2)) have just been published by scientists from Greece, the UK, and Poland in The Royal Society journal.
The first paper describes the flaws with claiming one can establish a causal link by associating trend shape fitment between two events. The authors assert the scientific method requires focusing on the stochastic processes or operational conditions necessary for causation. This allows an observational analysis to falsify assumed causalities that violate essential causal conditions.
For example, it is well known physics that causes cannot lag effects. If the paleoclimate temperatures began cooling 5,000 years before CO2 concentrations began falling, the decline in the CO2 could not be said to have caused the cooling due to the causality sequencing violation.
Chicken or Egg Causality? CO2 vs. Temperature
Over the years, there have been many papers published on the question of whether the CO2 concentration drives the modern temperature changes or the temperature changes drive the CO2 change.
Wang et al. (2013) indicate that only 10% of the variance in global CO2 growth rates can be explained by fossil fuel emissions. Instead, there is a “strong and persistent coupling (r² ≈ 0.50) between interannual variations of the CO2 growth rate and tropical land-surface temperature during 1959-2011.”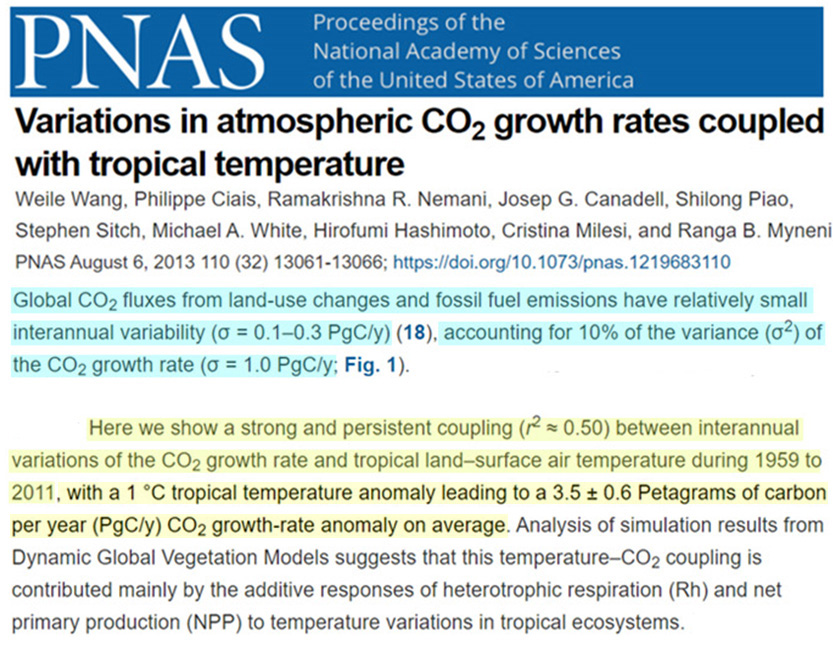
Image Source: Wang et al., 2013
Jones and Cox (2005) compare the “clear similarity” between the CO2 growth rate anomalies and their correspondence to El Niño events (warming) and the negative growth rate anomalies corresponding to La Niña events (cooling). They assert that it is “unlikely that these anomalies can be explained by an abrupt increase in anthropogenic emissions, as the anomalies are much larger than the annual increases in fossil fuel emissions.”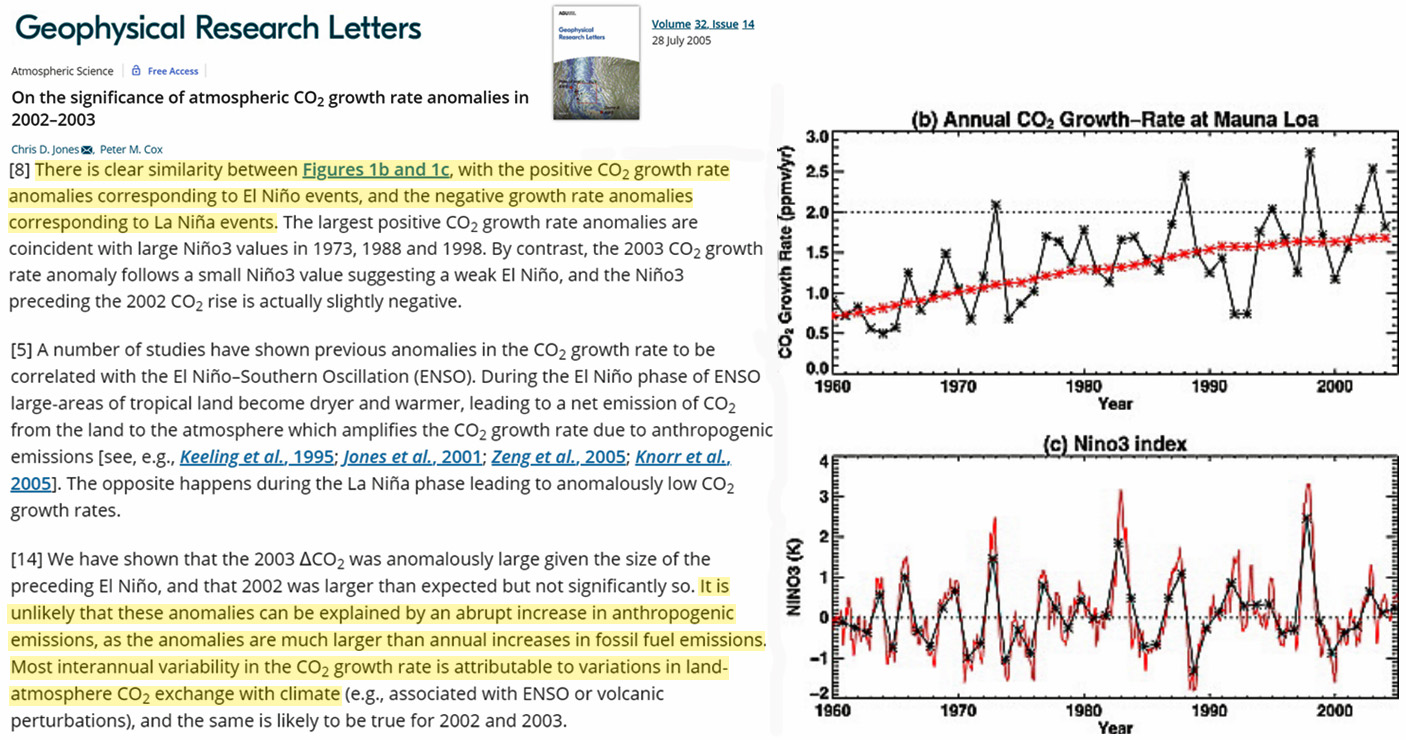
Image Source: Jones and Cox, 2005
Just how much growth is there in the year-to-year rate of fossil fuel emissions? As Wang et al. note, often it is only about 0.1 to 0.3 GtC/yr. Sometimes even less. (For example, in the chart below, there was no year-to-year change, and, in fact, a decline, in the annual fossil fuel emissions growth rates from 1980 to 1984.)
Dr. Jarl Ahlbeck (2009) assessed these growth rate anomalies were so “clearly insignificant” they could not explain the increase in the atmospheric CO2 composition. Thus, anthropogenic emissions were omitted from the correlation coefficient equation. In contrast, the temperature “is the dominating variable, and the efficient for the temperature is strongly significant” in explaining the CO2 growth rate anomalies from 1980 to 2008.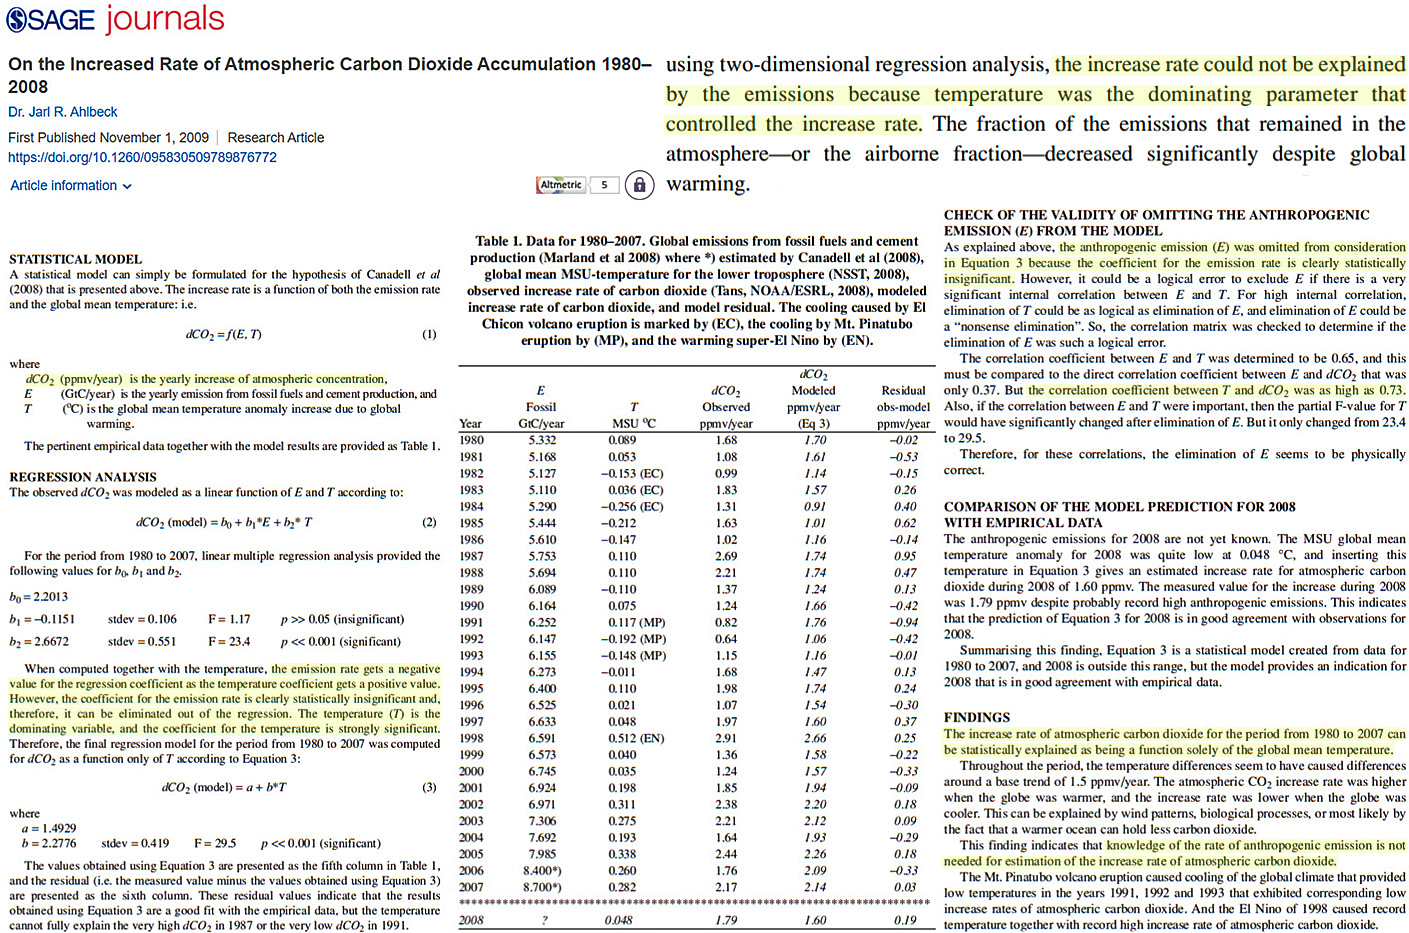
Image Source: Ahlbeck, 2009
Dr. Humlum and colleagues (2013) further clarify the sequencing of global atmospheric CO2 versus temperature and also conclude “changes in atmospheric CO2 are not tracking changes in human emissions.” They even specify the observed time lag for the T→CO2 sequencing. The CO2 growth rate changes occur 9 months after tropospheric temperature changes and 11-12 months after sea surface temperature changes.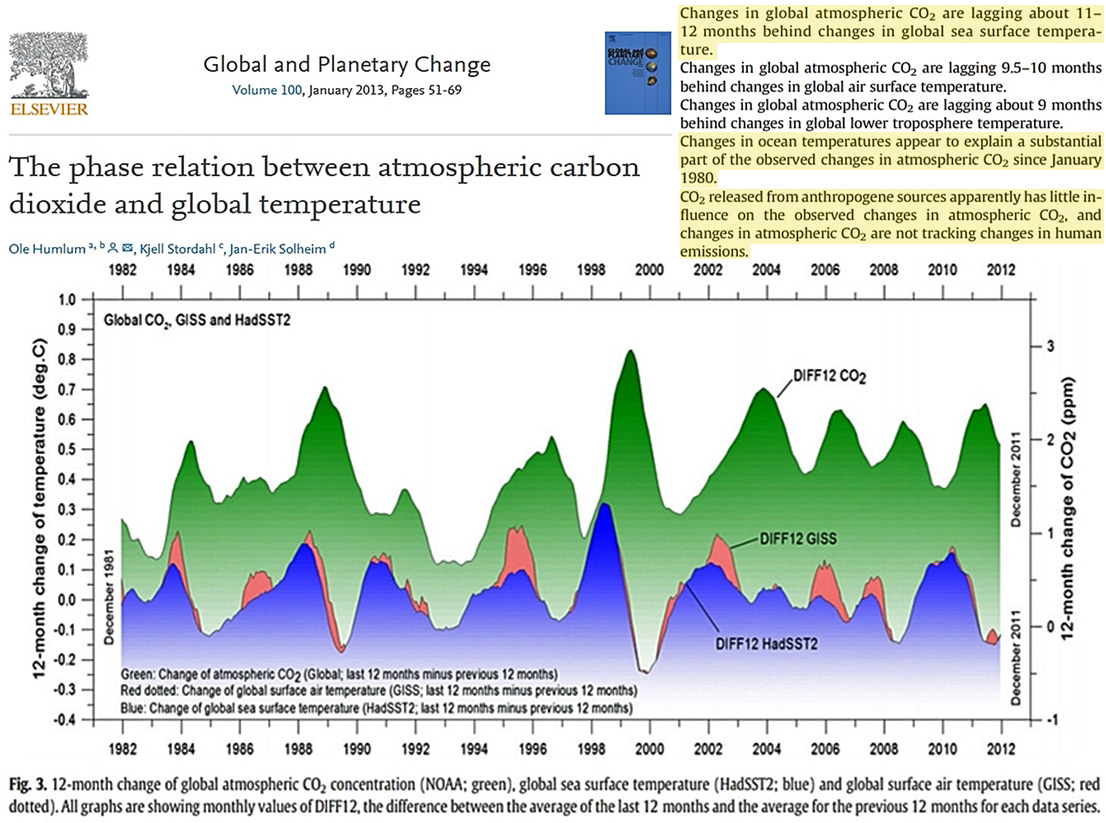
Image Source: Humlum et al., 2013
Even researchers who clearly do not want the observations to show the temperature explaining the majority of CO2 growth rate changes are admitting this is what the data indicate. Coulombe and Göbel (2021) reluctantly report that global mean surface temperature anomalies “cause more CO2 than the reverse,” a finding that contradicts “common wisdom.”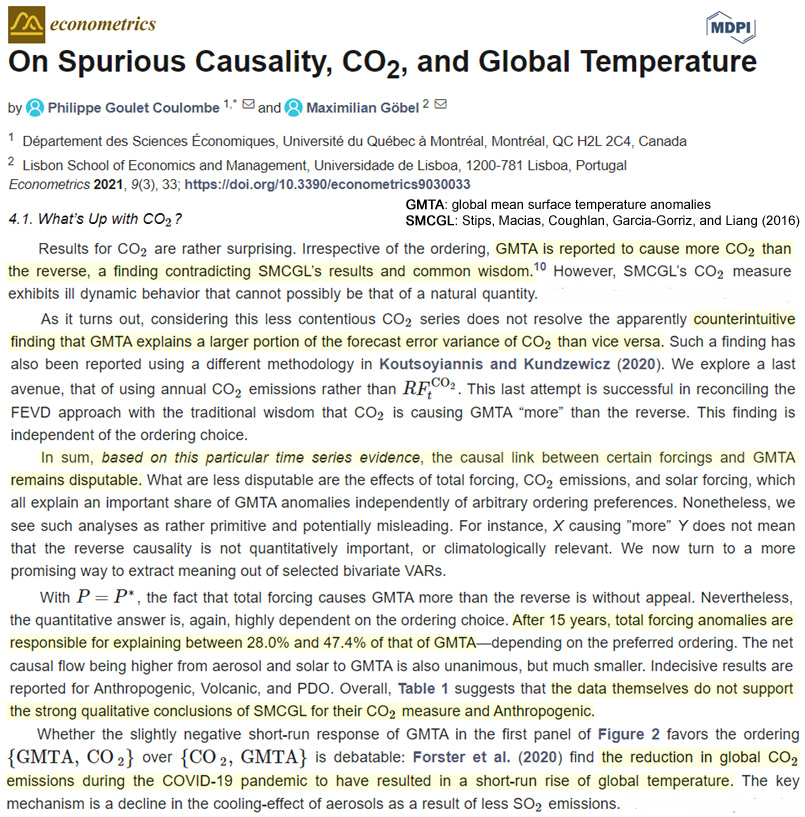
Image Source: Coulombe and Göbel, 2021
The Koutsoyiannis Papers: Temperature As Cause, CO2 An Effect
Koutsoyiannis and Kundzewicz (2020) analyze the sequencing of the changes in CO2 growth rate versus temperature changes using freely-available data. They find that each and every result shows a temperature (T) leading CO2 (T→CO2) directionality. The probability values are 100,000 times more likely (“about 4 to 5 orders of magnitude”) to be in the T→CO2 direction and not in the CO2→T direction. Utilizing tropospheric temperatures available from UAH, the CO2 values are shown to lag behind T values by about 6 months.
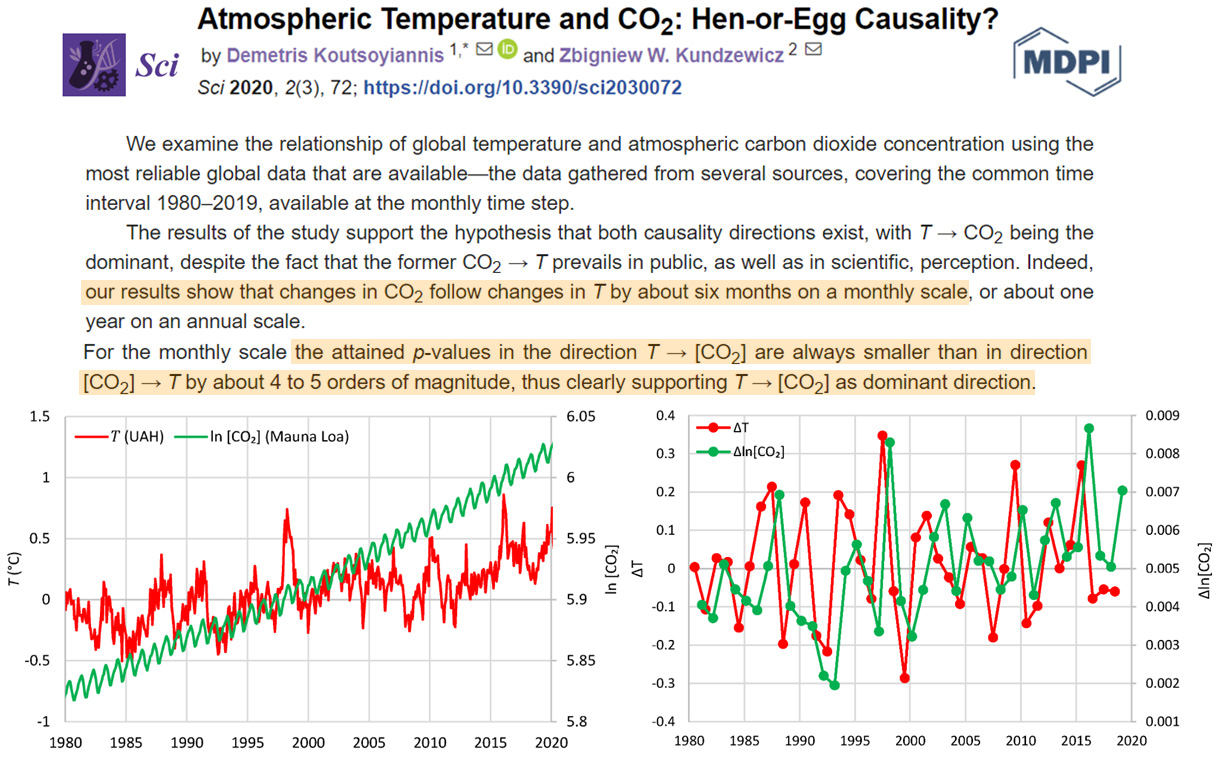
Image Source: Koutsoyiannis and Kundzewicz, 2020
The companion paper (Koutsoyiannis et al., 2022 (2)) applying the scientific method to the chicken-or-egg, T-or-CO2 causation question does not support the “common conviction” that human CO2 emissions are driving modern global warming.
Noting that a causality process requires that causes cannot lag effects in sequencing potentialities, the authors suggest there is “a (mono-directional) potentially causal system with T as the cause and [CO2] as the effect.” The CO2 lag time is about 5-8 months.
“Hence, the common perception that increasing [CO2] causes increased T can be excluded as it violates the necessary condition for this causality direction.”
Perhaps the science is not settled after all.
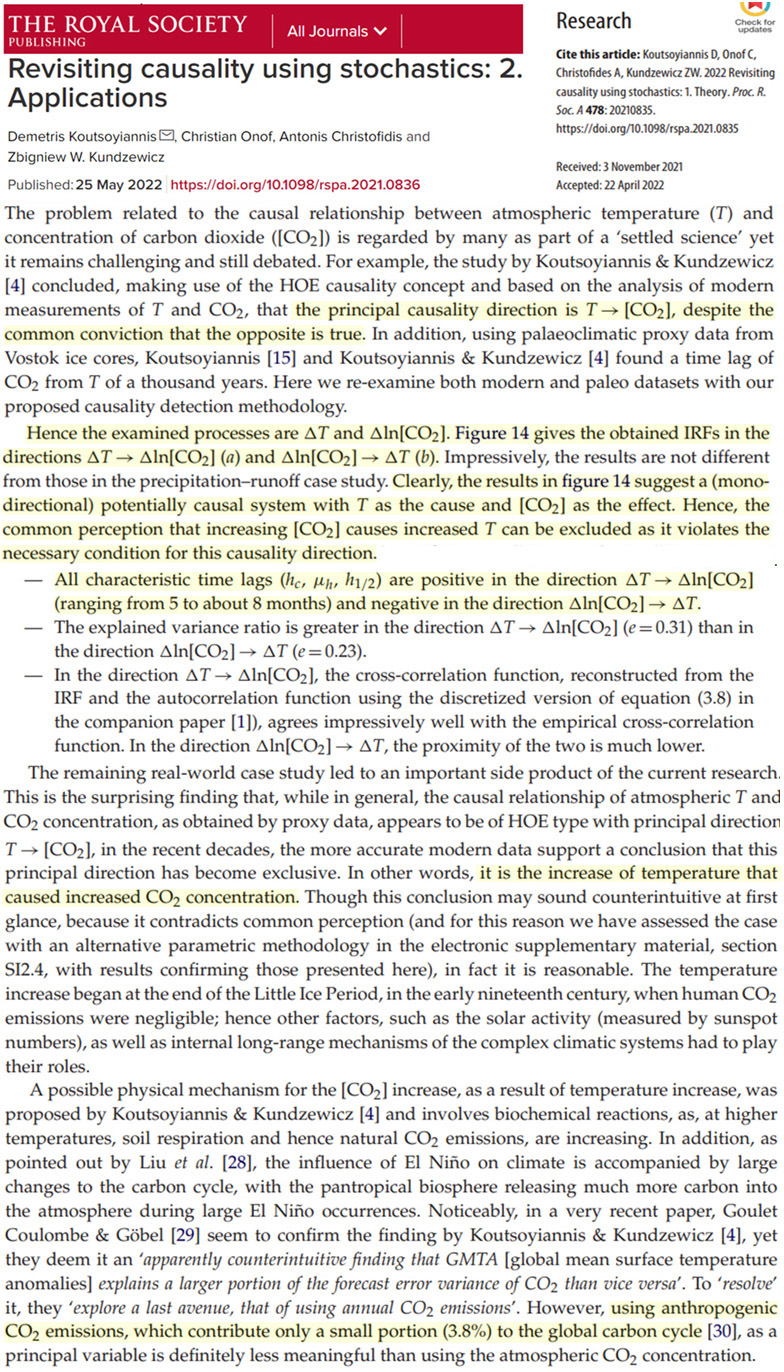
Image Source: Koutsoyiannis et al., 2022 (2)
Dr. Koutsoyiannis provided this e-mail summary of the two papers in a comment.


[…] Royal Society: Scientific Method Application Shows The Perception CO2 Causes Global Warming ‘C… […]
We’ll have to revise sicentific method, then. It gets the wrong result.
Great post !
This confirms what I have noticed (and posted here some time ago) about the cross-correlation analysis between [CO2] and T in a presentation by Pr Murry Salby :
https://youtu.be/HeCqcKYj9Oc?t=516
The right part of the diagram shows the positive correlation from T towards [CO2] with a lag of some months.
The left part of this diagram shows a weak but negative correlation from [CO2] towards T with also a lag of some months.
Anyone who wants to provide a theory explaining that a [CO2] increase induces a T increase should – before even start anything – address those facts.
Apr 29, 2022 Climate Change Roundtable ep13: The Truth About Global CO2 Emissions
Streamed LIVE at noon CT on Friday, April 29: Climate Change Roundtable Host Andy Singer and Heartland’s Linnea Lueken and Jim Lakely cover the truth about global carbon dioxide emissions and the indispensable nature of fossil fuels
.
https://youtu.be/LNIHvKNAoJs
Apr 26, 2016 Rising CO2 Levels Greening Earth by NASA Goddard
From a quarter to half of Earth’s vegetated lands has shown significant greening over the last 35 years largely due to rising levels of atmospheric carbon dioxide, according to a new study published in the journal Nature Climate Change on April 25. The greening represents an increase in leaves on plants and trees equivalent in area to two times the continental United States.
https://youtu.be/zOwHT8yS1XI
[…] Kenneth Richard, No Tricks Zone, June 2, 2022 https://notrickszone.com/2022/06/02/royal-society-scientific-method-application-shows-the- […]
[…] Kenneth Richard, No Tricks Zone, June 2, 2022 https://notrickszone.com/2022/06/02/royal-society-scientific-method-application-shows-the- […]
[…] Kenneth Richard, No Tricks Zone, June 2, 2022 https://notrickszone.com/2022/06/02/royal-society-scientific-method-application-shows-the- […]
[…] Kenneth Richard, No Tricks Zone, June 2, 2022 https://notrickszone.com/2022/06/02/royal-society-scientific-method-application-shows-the- […]
[…] Richard 작성, No Tricks Zone, 2022년 6월 2일 https://notrickszone.com/2022/06/02/royal-society-scientific-method-application-shows-the- 지각 – 이산화탄소 – 원인 – 지구 온난화 – 배제 가능 […]
[…] Kenneth Richard, No Tricks Zone, June 2, 2022 https://notrickszone.com/2022/06/02/royal-society-scientific-method-application-shows-the- […]
[…] Kenneth Richard, No Tricks Zone, June 2, 2022 https://notrickszone.com/2022/06/02/royal-society-scientific-method-application-shows-the- […]
Complete nonsense.
There are too many climate change variables to know what any one of them does. There may also be unknown variables.
CO2 is a greenhouse gas.
Increasing greenhouse gases reduces Earth’s ability to cool itself by an unknown amount. The 50% increase of CO2 since the 1700s, starting with a rough estimate based on ice cores, is very likely to have caused some amount of global warming. How much is unknown. But the warming has been pleasant, and harmed no one — we do know that.
People who claim that CO2 does nothing, and people who claim CO2 does everything, belong in the same category: fools. And If they publish a peer reviewed study with those conclusions, they are still fools.