What Is Sea Level Really Doing?
by Ed Caryl
This is the second article I’ve written on sea level. For a review see A Level Look at Sea Level.
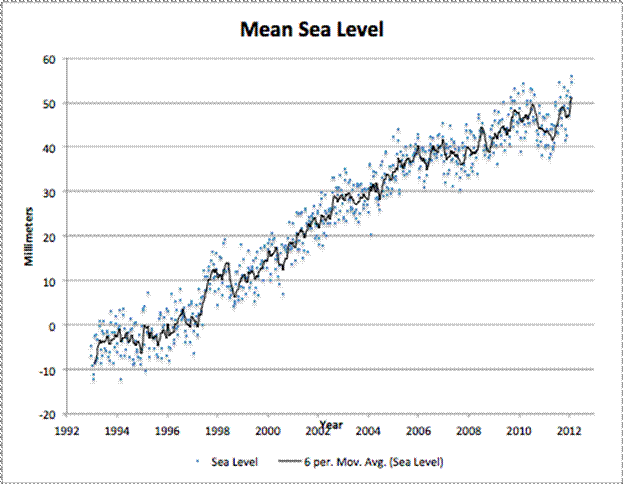
Figure 1: Mean Sea Level, citation: Nerem, R. S., D. Chambers, C. Choe, and G. T. Mitchum. “Estimating Mean Sea Level Change from the TOPEX and Jason Altimeter Missions.” Marine Geodesy 33, no. 1 supp 1 (2010): 435. Source here.
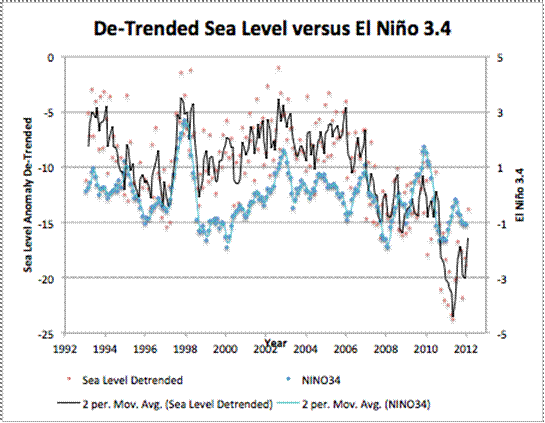
Figure 1 above is the mean sea level according to the University of Colorado. According to their web site, the recent dip in sea level was due to the 2010 El Niño. This struck me as a bit strange, as the 1998 El Niño is clearly visible as a positive rise in that year, not a negative peak. Below is a plot of monthly Niño 3.4 index against a de-trended monthly sea level plot. Niño 3.4 data from here. The de-trend number used was 3.14 mm/year.
Figure 2 is a plot of the El Niño 3.4 index and a de-trended plot of sea level.
It is easy to see that the El Niño trace and the de-trended sea level trace line up well. It is also obvious that the recent flattening in sea level would have been seen earlier if not for the El Niño. The El Niño hid part of the drop in trend that really started in 2005. The El Niño was clearly not the cause of the drop, it hid the early part of the flattening trend.
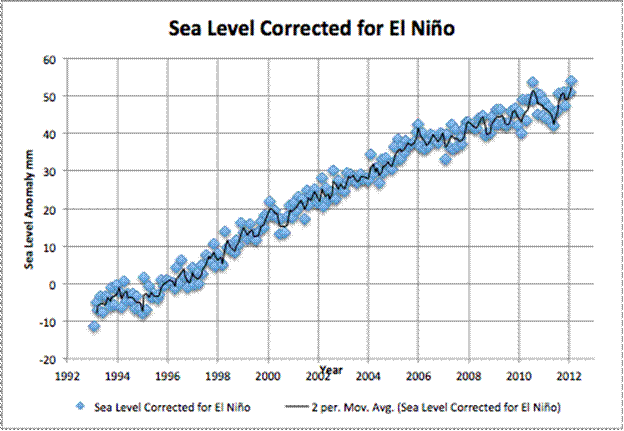
Because the data overlies so nicely, we can subtract the El Niño effect from sea level.
Figure 3 is mean sea level with the El Niño 3.4 index (X2) subtracted.
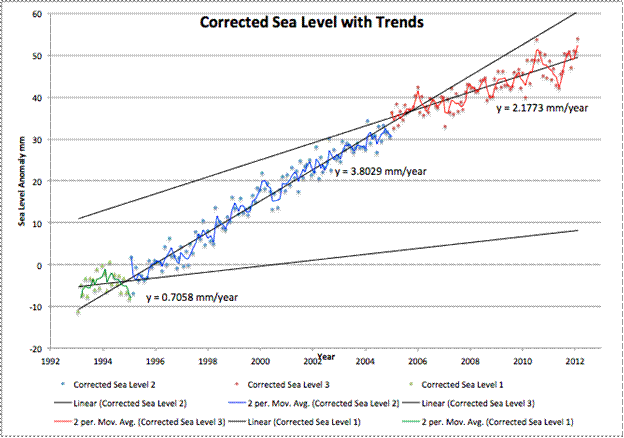
Now the El Niño spikes are gone and we see a fairly smooth rise except for changes in the trend: flat in the first two years, a steady rise from 1995 to 2006, then a much slower rise since 2005 to the present. If we measure these trends we see this:
Figure 4 is the sea level plot of figure 3 with linear trends.
Sea level roughly follows global temperature because sea water expands when it warms and shrinks when it cools. In 1993, Mt Pinatubo caused a two-year period of cooling, which was reflected in sea level. By 1995, that effect had ended, and a ten-year period of warming began. In 2005, the warming ended (ignoring the El Niño peaks) and sea level advance returned to the lower long-term rise rate.
The University of Colorado (amid some controversy) has added a 0.3 mm/year “GIA correction” to the sea level trend data. Their explanation is that Glacial Isostatic movement has made the oceans deeper and wider (on average) resulting in increasing the capacity of the oceans to hold water. But all interest is in ocean level at the shoreline, not how much the oceans can hold. If the oceans can hold more water, the level at the shoreline will go down, not up.
Here is a quote from their web site, here.
In order to answer these questions, we have to account for the fact that the ocean is actually getting bigger due to GIA at the same time as the water volume is expanding. This means that if we measure a change in GMSL of 3 mm/yr, the volume change is actually closer to 3.3 mm/yr because of GIA. Removing known components of sea level change, such as GIA or the solid earth and ocean tides, reveals the remaining signals contained in the altimetry measurement. These can include water volume changes, steric effects, and the interannual variability caused by events such as the ENSO. We apply a correction for GIA because we want our sea level time series to reflect purely oceanographic phenomena. In essence, we would like our GMSL time series to be a proxy for ocean water volume changes. This is what is needed for comparisons to global climate models, for example, and other oceanographic datasets.”
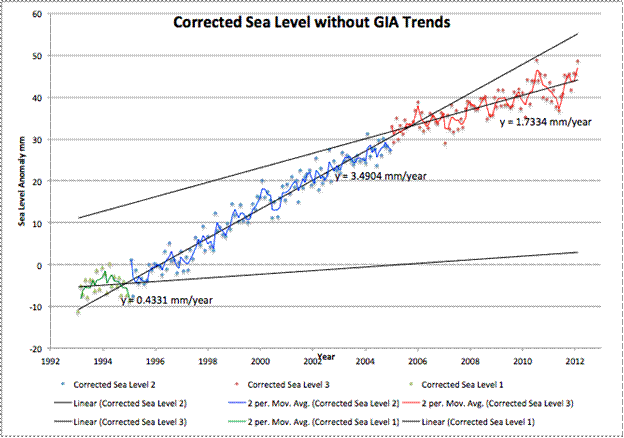
We are not interested in ocean water volume, all interest is in level. We want to know when Al Gore’s beachfront mansion will be flooded. That is why we call it, “sea level,” not “sea volume.” Backing out the GIA “correction” results in the following chart:
Figure 5 is Figure 4 with the 0.3 mm/year GIA “correction” removed.
This result is even closer to the historic sea level trends seen by tide gauges. If the trend of the last seven years continues through the rest of the century, the total rise will be exactly 6 inches (15.25 cm) by 2100. Even if the rate returns to the rate of the previous ten years, the total rise will only be one foot (30.5 cm), hardly anything to fear. If the often predicted cooling over the next 30 or 40 years takes place, there may not be any sea level rise at all.
Al, you don’t need to sell your California mansion. But you knew that, didn’t you?


We want to know when Al Gore’s beachfront mansion will be flooded.
😀
Very good charts. It would be interesting to know how much of sea level rise is due to ancient aquifer depletion. Anyone got a number for that, in mm/yr?
0.77 mm/ year.
http://www.nature.com/ngeo/journal/vaop/ncurrent/abs/ngeo1476.html
I wrote to Steve Nerem at CU raising exactly your point about the GIA adjustment almost a year ago and never got a reply –
Date: Wed, 27 Jul 2011 09:43:03 +0100 (BST)
From: Paul Matthews
To: Steve Nerem
Subject: Your confused definition of sea level
Dear Steve
As a scientist, I am concerned by your confusing and misleading
web pages regarding sea level rise.
The GIA adjustment appears to be an attempt to compute ocean
volume rather than actual sea level.
If you want to measure the total ocean volume, fair enough,
but in this case you should label the graphs as
total ocean volume, not sea level.
By computing volume and labelling it as sea level you
provide a gift to the skeptics who are accusing you
of fiddling the figures to exaggerate sea level rise.
Paul Matthews
Figure 5 tells the whole story and fits with everything else I’ve come across about the declining sea level rise. However, those who insist that we will be inundated here in North Carolina by sea level rise don’t seem to care about observed (historical) data.
Fortunately, the NC Senate, with the help of input from an independent group (NC-20) that provide historical data voted to not take precautions suggested by “scientists” from the NC Coastal Resources Commission (NC CRC) who based their opinion on models of sea level rise.
Hoo boy!
The letters to the editor of a major newspaper in Raleigh (The News and Observer) had some choice comments:
“What fun those Republican legislators in the state House are providing us. I always thought that they wanted to take us back to the 19th century. Now I realize that their dream is to take us even further back, to the 11th century and the heady days of Cnut (or Canute), King of the English, who failed to hold back the waves by royal decree. Today, of course, they’re so much more powerful: All they have to do is to pass legislation to prevent the ocean level from rising…”
(http://www.newsobserver.com/2012/06/17/2139452/david-e-crean-science-by-decree.html)
And…(Note that “scientists” using climate models, not data, is focused on in this letter)
“North Carolina’s proposal to use a straight-line [historical] projection of past sea-level rise to predict future rise has attracted much attention. In predicting sea-level rise, scientists rely on climate models that predict a much faster rate of rise…
(http://www.newsobserver.com/2012/06/17/2139455/ralph-c-heath-sea-level-snow.html)
And…
“Your June 8 article “Senate panel cuffs coastal forecast” reveals just how far the climate change-deniers and their anti-environment, science-hating minions have penetrated the workings of our state government…
(http://www.newsobserver.com/2012/06/17/2139453/keith-feather-sea-level-fiction.html)
Whew! And…what information did the NC CRC “scientists” use? A commenter from the coast noted in a WUWT post [2:37 PM]:
“The NC CRC’s [Coastal Resource Commission] Science Panel & scientists:
– Used the Least Reliable Tide Gauge Data in NC.
– Used Obsolete Reports
– Used only One-sided Sea Level Rise reports
– Used only One-sided Global Warming reports,
– Admitted they did no science, only a “Literature Search”.
– No 4 miles inundation of NC Tidelands over 150 years is visible .
– Ignored US Coast Survey , and US Fish Services Tide Gauge Data 1850 1950.
– Said, ‘What’s the Big Deal, Let’s wait 5 Years and see what happens.’
– Confuse Erosion due to dredging, winds, waves and currents with inundation.
– Have not answered questions about the above concerns.
Thankfully, it looks like NC Legislators want verifiable Science
upon which to base multi billion dollar public policy decisions that
could harm tens of thousands of local, taxpaying property owners.
This is serious business, and it’s good NC doesn’t base decisions on
a comedy skit.
Bill Price Pine Knoll Shores [on Bogue Banks, central NC coast]
PS: It might be helpful to urge the Science Panel to participate in an
Open Public Forum to answer above and other questions about their science.
So far they have declined.”
(http://wattsupwiththat.com/2012/06/13/a-refreshing-change-on-sea-level-policy-use-historical-data-rather-than-projections/#more-65605)
Now, I might be wrong, but for some reason, I don’t think the “scientists” involved in the NC CRC would accept Figure 5. Or their supporters.
But, I could be wrong…[sarc]
Great job, Pierre—thanks!
[…] https://notrickszone.com/2012/06/18/data-show-sea-level-rise-has-slowed-down-over-the-last-7-years/ Share this:EmailPrintTwitterDiggFacebookStumbleUponRedditLike this:LikeBe the first to like this. […]
I enjoyed the article but please stop saying the Gore has “beach front property”. He owns a house in Montecito which has hilltop ocean views.
[…] Data Show Sea level Rise Has Slowed Down Over The Last 7 Years […]