By Ed Caryl
On Friday, June 22nd, 2012, the The National Academy of Science issued a press release titled, “California Sea Level Projected to Rise at Higher Rate Than Global Average; Slower Rate for Oregon, Washington, But Major Earthquake Could Cause Sudden Rise”. Just in time for Rio+20.
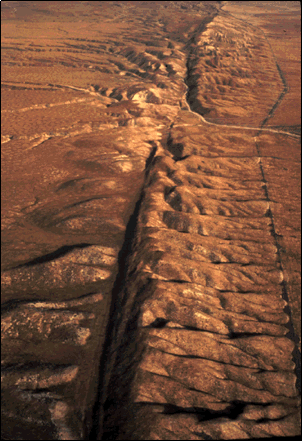
Figure 1: Arial photo of San Andreas fault in California Central Valley.
The press release was picked up by the Associated Press, and in turn, on Saturday the story appeared in newspapers all across the country, including my local paper, and most California papers. The press release breathlessly stated:
The committee that wrote the report projected that global sea level will rise 8 to 23 centimeters by 2030, relative to the 2000 level, 18 to 48 centimeters by 2050, and 50 to 140 centimeters by 2100. The 2100 estimate is substantially higher than the United Nation’s Intergovernmental Panel on Climate Change’s projection made in 2007 of 18 to 59 centimeters with a possible additional 17 centimeters if rapid changes in ice flow are included.
For the California coast south of Cape Mendocino, the committee projected that sea level will rise 4 to 30 centimeters by 2030, 12 to 61 centimeters by 2050, and 42 to 167 centimeters by 2100. For the Washington, Oregon, and California coast north of Cape Mendocino, sea level is projected to change between falling 4 centimeters to rising 23 centimeters by 2030, falling 3 centimeters to rising 48 centimeters by 2050, and rising between 10 to 143 centimeters by 2100. The committee noted that as the projection period lengthens, uncertainties, and thus ranges, increase.
The committee’s projections for the California coast south of Cape Mendocino are slightly higher than its global projections because much of the coastline is subsiding. The lower sea levels projected for northern California, Washington, and Oregon coasts are because the land is rising largely due to plate tectonics. In this region, the ocean plate is descending below the continental plate at the Cascadia Subduction Zone, pushing up the coast.
Extreme events could raise sea level much faster than the rates projected by the committee. For example, an earthquake magnitude 8 or greater north of Cape Mendocino, which occurs in this area every several hundred to 1,000 years with the most recent in 1700, could cause parts of the coast to subside immediately and the relative sea level to rise suddenly by a meter or more.”
Of course the newspapers picked the most extreme of the above numbers, stating a six inch rise by 2030, and three feet by 2100. I downloaded and read the entire paper, all 275 pages, including 15 pages of “boiler-plate” introduction, title pages, table of contents, Committee members names, etc, and 95 pages of references. The 150 or so pages of real content essentially repeated the above four paragraphs, ad nauseam, with supporting hyperventilation about extreme storms, cliff and beach erosion, and wetlands damage. Surprisingly, the last paragraph, and the last part of the title, on the possibility of an earthquake event, had the least discussion.
Willis Eschenbach was the first to respond to this drivel. By Saturday evening he had posted his response on WUWT here, pointing out the impossibility of the above projection, using the actual San Francisco tide gauge plot. Others, in the comments to his posting, added details. I will add a few more.
The geology of the west coast of the U. S. is dominated by two features. The southern coast of California is moved by the San Andreas fault. From Point Reyes north of San Francisco, to the Gulf of California, the coast is moving to the northwest at about 2.5 inches (6.3 cm) per year. There is very little motion up or down as can be seen in Figure 1 above.
North of Cape Mendocino, ground motions are dominated by the Cascadia Subduction Zone. The Juan de Fuca plate is sliding under the North American Plate. The bending of the North American Plate looks like a playing card being pushed at the edge: the edge bends down, but further back the card bends up, and further back yet, it bends down again. In the case of the Northern California, Oregon, Washington, and Southern British Columbia coasts, the edge is off-shore, the upward-bending part is the coast, and inland is bent down again.
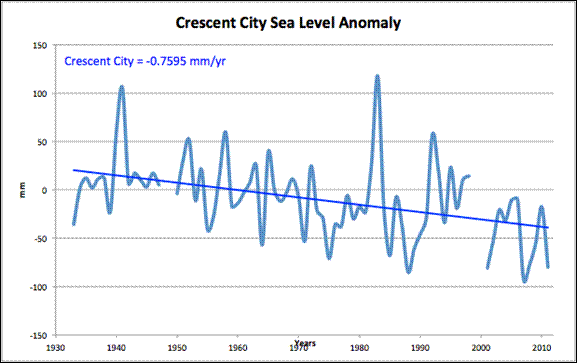
Tide gauges reflect these motions. Crescent City is on the California coast just south of the Oregon boarder in the subduction zone, well north of Cape Mendocino.
Figure 2 is the sea level changes at Crescent City, California. Crescent City is rising at about 0.76 mm per year. In 75 years, there has been no significant change to that trend. Sea level rise will not be a problem to Crescent City.
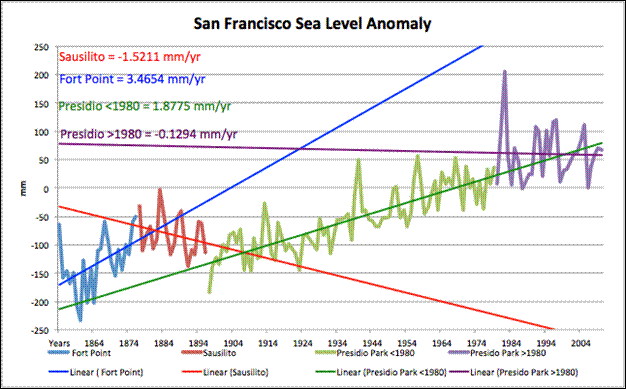
Figure 3: Sea level anomaly at San Francisco.
The tide gauge at San Francisco has been at three locations. Early on it was at Fort Point, then at Sausalito, before moving to Presidio Park near the Golden Gate Bridge before the turn of the century. During the whole history of this gauge, the trend has been a rise of about 1.4 mm per year. But as you can see from figure 2, there have been four distinct periods with very different trends. Since 1980, including the El Niño of 1982, the trend has been flat or slightly down, at about -0.13 mm per year. This precludes any rise of 6 inches by 2030. The prediction should be between this trend and the last 115 year trend, or between a fall of about 0.4 cm (about -1/8th of an inch) and a rise of 5.6 cm (about 2.2 inches).
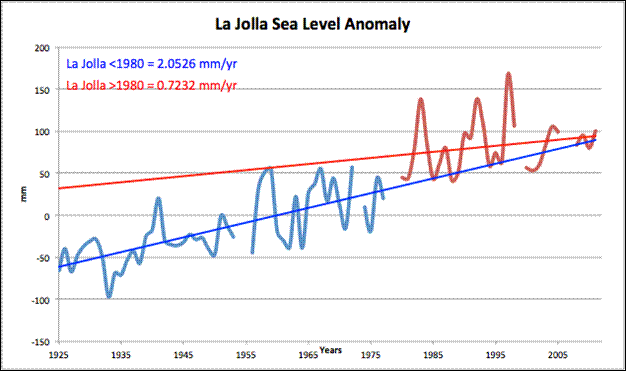
The last 30-year trend could be an artifact of local changes at San Francisco. To check that, two tide gauges further south were checked. Gauges around Los Angeles were avoided, because oil reservoir depletion and water injection, aquifer depletion and restoration, have altered coastal rise and fall much more than sea level changes. Instead, two tide gauges further south, La Jolla and San Diego, were examined.
Figure 4: Sea level changes at La Jolla, California.
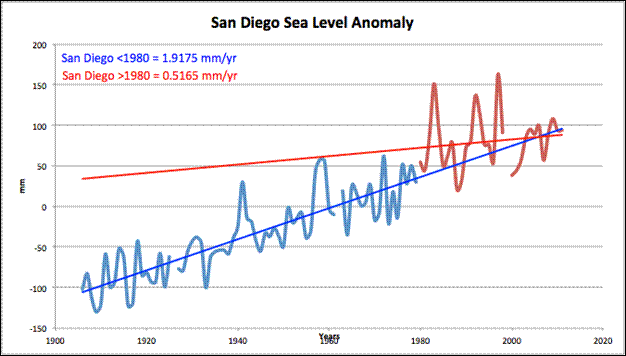
Figure 5: Sea level change at San Diego, California.
These two gauges roughly agree, with a long-term trend of about 2 mm/year rise, and a short term trend of about 0.6 mm rise. These would correspond to a rise of between 1.8 cm and 6 cm (0.7 inch to 2.4 inches) by 2030, hardly catastrophic. Extending these trends to 2100 would result in a 2 to 7 inch rise, far short of the National Academy of Science prediction.
Part 2
Oregon and Washington Sea Level
On the evening of January 26th, 1700, at 9:30 PM, the world ended! At least it did for many Native Americans on the coast of Oregon and Washington, and First People on Vancouver Island, British Columbia in Canada. A magnitude 9+ earthquake, lasting several minutes, knocked everyone standing off their feet, collapsed native long-houses, and made people motion-sick. Elders told the children to run for high ground. After spending a cold night in the hills, the children returned to find their villages totally gone. Whole tribes from Crescent City, California to Vancouver Island, were wiped out. Across the Pacific in Japan the next day, multiple waves came ashore:
It flooded farmed fields, ruined salt kilns, damaged fishermen’s shacks, ascended a castle moat, entered a government warehouse, drove people to high ground, and probably ran 2 kilometers up a river…. It wrecked houses not only by flooding them but also by starting a fire. It contained multiple waves that range in reported time from midnight until the following noon. The tsunami initiated a nautical accident in which were lost two crew members and tons of rice.”
We know the exact date and time because it took 10 hours for the tsunami to cross the Pacific and be recorded in Japan. We know what happened to Native Americans and First People in Canada from oral histories and archaeological evidence. The coastal elevation immediately sank five feet (1.5 meters). Drowned forest tree rings show death occurred between the 1699 and 1700 growing seasons. Some dead cedar snags still stand in inland wetlands on the Washington coast.
Similar events have happened 13 times since the eruption of Mt Mazama (Crater Lake) in Oregon 7770 years ago. The shortest interval between these events has been 390 years, the longest, about 1000 years. The next one could happen around 2100, or it could wait until 2700. For an idea of the devastation that will result, look to the Japanese tsunami of last year. It could be much worse because the fault that could slip is much longer and it is much closer to the coast.
Sea level rise is not a hazard on the U. S. Pacific coast. Mega-thrust earthquakes are the real hazard. Thankfully, on the Cascadia Subduction Zone, they are separated by hundreds of years. The National Academy of Science needs to look at real tide gauge data and do some real science.


But then we have the news media…Today’s Raleigh News& Observer’s page 1 headline: “Rate of Atlantic sea-level rise is faster.” Four times faster “along portions of the Atlantic coast than globally, according to a new [USGS]Survey report…” And where is this information to be found? The journal Nature Climate Change.
I have no idea whether the data cited in the article are credible or verifiable, but the paradigm of the report (and others like it) is always “global warming” or “climate change.” Regardless of any other factors mentioned, human activity is always the root cause.
Oh. The article also notes that a National Research Council report “projects an average 3-foot rise in California by…2100…” I think they need do some real science, as you suggest, Pierre.
Already de-bunked:
http://stevengoddard.wordpress.com/2012/06/25/peer-review-to-be-underwater-by-the-year-2008/#comments
It isn’t rising seas, it’s falling land. There isn’t much one can do about that.
[…] No Tricks Zone Share this:PrintEmailMoreStumbleUponTwitterFacebookDiggRedditLike this:LikeBe the first to like this. This entry was posted in Climate Change and tagged climate hysteria, climate models, climate research, PlayStation® climatology, sea level rise. Bookmark the permalink. ← Hockey Schtick: New paper finds sunshine has increased in Iran over past 26 years […]