Geologist Dr. Sebastian Lüning and Prof. Fritz Vahrenholt have sifted through recent scientific literature looking for evidence that global sea level rise has accelerated over the last 3 decades.
Their result: “The scientific facts speak very clearly against it. It is only a question of time before the idea disappears from the public discussion.”
Lüning and Vahrenholt examined recently published papers on the subject and they present their findings (translated in English and condensed by P Gosselin).
================================
Case studies from around the world: no evidence of accelerating sea level rise over the last 30 years
by Sebastian Lüning, Fritz Vahrenholt
1. GPS-monitored global tide gauges
In 2009 Guy Wöppelmann et al examined what effects vertical land movement had on the sea level data from tide gauges and published their results in the Geophysical Research Letters. The scientists evaluated globally 227 stations whose elevation was monitored by GPS. 160 of these stations were located at a distance maximum 15 km from the coast. By measuring the vertical movement of the tide gauges, they were able to apply a correction. From this they calculated a mean global sea level rise of 1.61 mm/year over the last century. Figure 1 shows that sea level rise has remained constant since 1940 – no acceleration over the last 70 years!
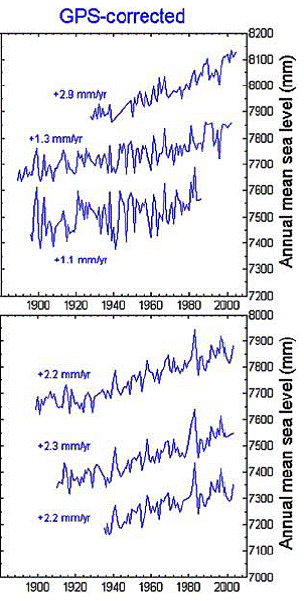
Figure 1: Sea level development for that last 100 years for northern Europe (top) and northwest America (bottom) based on tide gauges. No acceleration since 1940. Source: Wöppelmann et al. (2009).
2. Arctic Ocean shows no acceleration
2. Another important paper appeared in June, 2012 in the Geophysical Research Letters. A team lead by Olivier Henry of the Centre National de la Recherche Scientifique in Toulouse, France, examined 62 tide gauges along the coast of Norway to Russia over the last 62 years. The study yielded some surprising results. Beginning in 1950 Arctic sea level remained relatively stable (Figure 2). Sea level then began to rise in 1980 and reached a high point in 1990, which has yet to be surpassed. From 1995 to 2009 the authors calculated a mean sea level rise rate of 4 mm/year.
What is especially fascinating is that sea level at this region was in sync with the Arctic Oscillation (AO), see Figures 2 and 3. There’s been a decoupling only for the last 10 years, which is too short a time period to draw any sound conclusions. One thing is certain: The AO will also impact sea level behaviour there in the future.
Not only does temperature impact sea levels globally, but so do natural oceanic cycles. Ocean cycles can lower or raise sea levels, and accelerate or slow them down. An overall acceleration in sea level rise in the Arctic Ocean due to melting ice over the last 30 years cannot be detected.
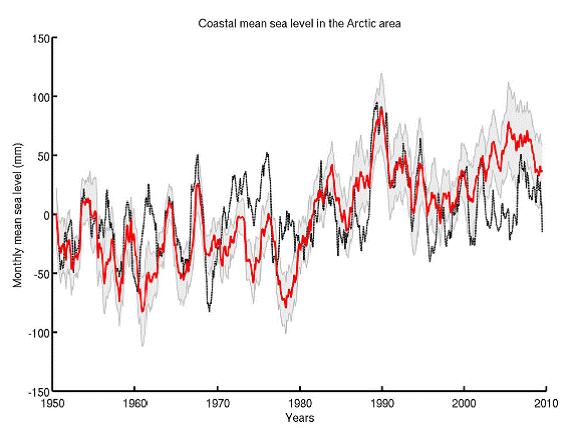
Figure 2: From 1950 to 2000 sea level changes are predominantly in sync with the Arctic Oscillation (black curve). Figure from Henry et al (2012).
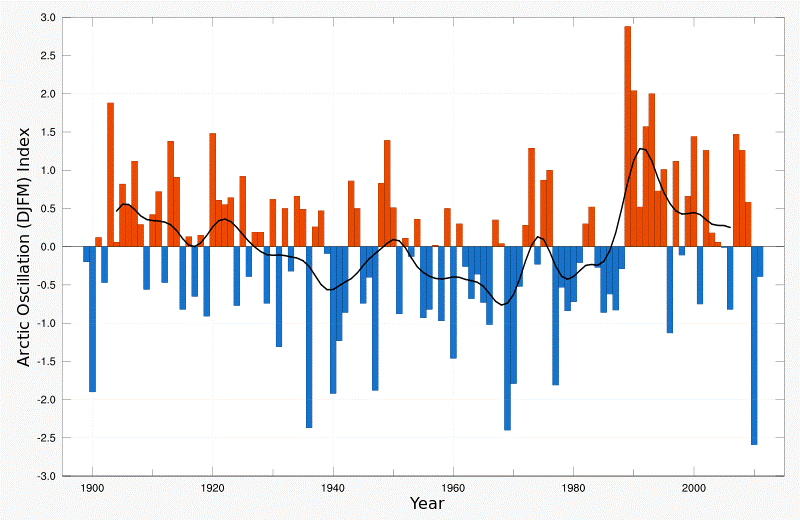
Figure 3: Arctic Oscillation Index (Source: Wikipedia).
3. New Zealand
Now let’s go to the other side of the globe – New Zealand, where only a few tide gauges go back to 1900. John Hannah and Robert Bell of the University of Otago and the National Institute of Water and Atmospheric Research respectively published a paper in January 2012 in the Journal of Geophysical Research. The new curves show that sea level rise has been steady since 1940 (Figure 4). The development in New Zealand is similar to the global situation. The long-term New Zealand trend is 1.7 mm sea level rise per year.
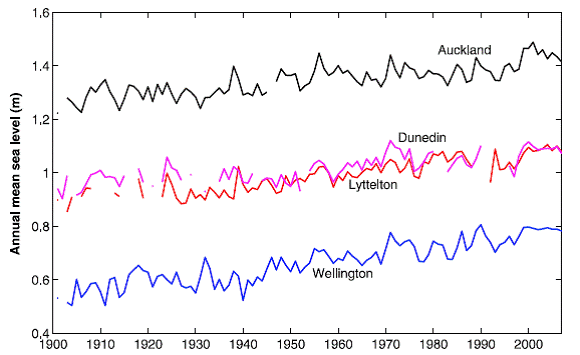
Figure 4: Sea level development from four New Zealand coastal tide gauges. Here there’s been no acceleration in sea level rise over the last 70 years. Figure from Hannah & Bell (2012).
Particularly interesting in the Hannah and Bell study is that New Zealand sea level rise is characterized by decadal cycles. Sea level rose and dropped in sync with the Pacific ocean cycles (Southern Oscillation Index, SOI and others), see Figure 5. Also see report from the NIPCC.
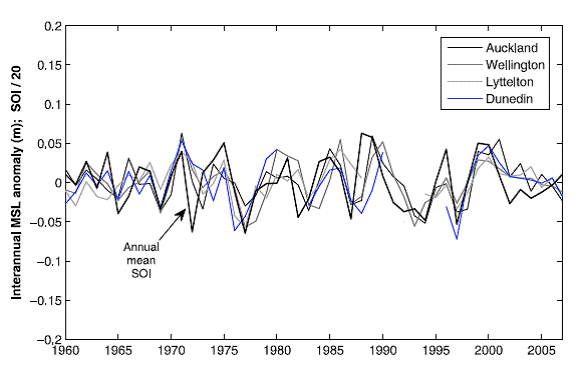
Figure 5: Shown are four New Zealand sea level tidal gauge series (thin curves), along with the Southern Oscillation Index (bold black curve). Source of figure: Hannah & Bell (2012).
4. Tasmania
In January, 2012, an international team led by Roland Gehrels of the University of Plymouth published a new study in the Earth and Planetary Science Letters examining the sea level history of Tasmania. Using cores taken from salt marshes, they reconstructed sea level development for the last 6000 years. Especially interesting are the last 200 years.
Sea level rose between 1900 and 1950 at a rate of 4.2 mm per year (Figure 6), but slowed down considerably in the second half of the 20th century to an average of only 0.7 mm per year – similar to southern New Zealand. No sea level rise acceleration is detectable in the Australian New Zealand region over the last decades. In fact, just the opposite is true. Sea level rise slowed down in the second half of the century.
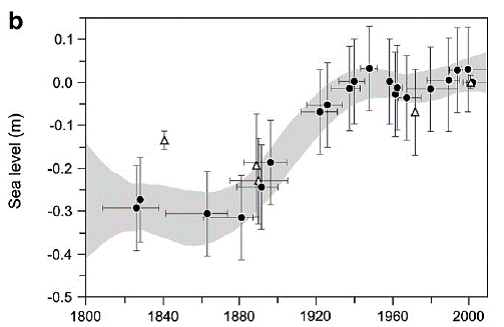
Figure 6: Sea level rise around Tasmania over the last 200 years. Sea level rise slowed down during the second half of the 20th century. Source of diagram: Gehrels et al. (2012).
5. Tarawa Atoll
Simon Donner of the University of British Columbia closely examined sea level development for the last 20 years for the Japanese atoll Tarawa and published his findings in the journal Eos in April 2012. Now hold on to your seat: tide gauges show that the sea level around Tarawa did not rise at all during this period (Figure 7)!
Moreover, the sea level fluctuations depicted by the curve are mainly due to the El Nino effect. In 1998 sea level dropped a full 45 cm as the transition was made from a powerful El Nino to a La Nina. Also see articles by Mark Lynas and Roger Pielke Sr.
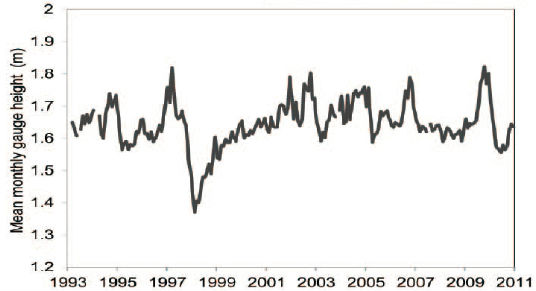
Figure 7: Sea level development around the Tarawa atoll based on tide gauges. There is no detectable rise. Diagram source: Donner (2012).
6. Bay of Biscay
In May, 2012, a study by Eduardo Leorri of East Carolina University appeared in the Quaternary Science Reviews. Examining sediment cores, the scientists studied sea level development of the Bay of Biscay for the period going back 10,000 years. As Figure 8 shows, sea level rise slowed down 7000 years ago.
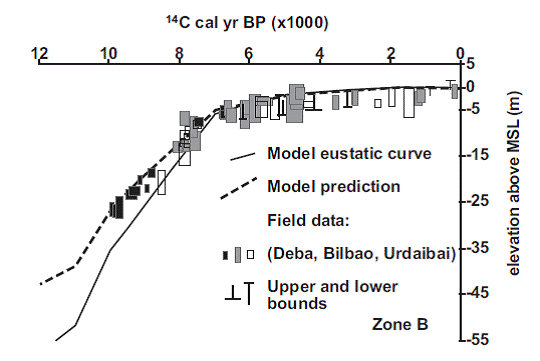
Figure 8: Sea level rise in the Bay of Biscay. Diagram source: Leorri et al. (2012).
Leorri and his team compared the results to coastal tide gauge readings from the region for the last 200 years. From 1800 to 1900 (Figure 9), sea level was stagnant. Then it began to rise around 1900. But no unusual acceleration can be detected over the last 30 years.
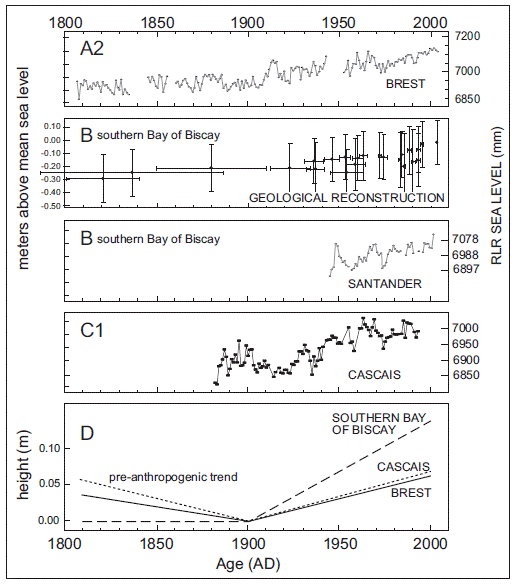
Figure 9: Coastal tide gauge measurements from the Bay of Biscay. Diagram source: Leorri et al. (2012).
7. Tony Brown, sea level of the last 2000 years.
A comprehensive presentation of pre-industrial sea level development was made by Tony Brown, who published his results at Judith Curry’s blog (blog article, detailed pdf-version). Readers should refer to pages 23-26, where Brown brings up some interesting points on sea level rise over the last 2000 years. Referring to the work of Aslak Grinsted of the University of Lapland from 2010 in the Journal Climate Dynamics, it is discussed whether the sea level of today has reached the levels of the Medieval Warm Period.
In any case, natural and anthropogenic causes have to be considered and properly attributed. Like the Hockey Stick episode, sea level development can in no way be considered as a monotone and non-eventful phenomenon. It too has varied naturally over the centuries, and the natural factors will continue to play a major role.
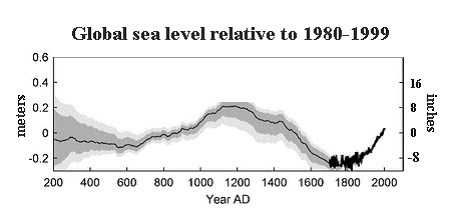
Figure 10: Sea level development model of the last 2000 years. The bold black curve starting in 1700 is a geological reconstruction by Jevrejeva et al. (2006). Modified as to Grinsted et al. (2010).
In May, 2012 at WUWT, Paul Homewood led an interesting discussion on whether sea level rise accelerated during the recent decades when compared to the 20th century. He concludes that satellite measurements may be flawed.
In summary, our global sea level journey produced some good results, some very remarkable results, depending on your point of view. Signs of an accelerating sea level over the last 30 years could not be found in any of the studies.
It doesn’t look good for the acceleration fans.


“Source found for missing water in sea-level rise” http://www.nature.com/news/source-found-for-missing-water-in-sea-level-rise-1.10676
This indicates that some of the so called man made sea level rise is “the extraction of groundwater for irrigation and home and industrial use”.
The German article http://www.kaltesonne.de/?p=4536 has a graph at the end of the story that shows the ground water contribution. It’s base on the Nature Geoscience ($32) article http://www.nature.com/ngeo/journal/vaop/ncurrent/full/ngeo1476.html
Devolution: Red-green government of NRW plans “bicycle speedways” so that “commuters can drive longer distances conveniently”. This is intended to reduce congestion.
http://regionales.t-online.de/nrw-will-mit-radschnellwegen-staus-auf-strassen-vermeiden/id_57914198/index
I wonder whether they have thought this through. I am not sure who is the bigger load on the environment after driving 2 * 50 km – my small LPG Polo or me after biking for four hours. I have tested it. It takes quite a refill. Cheap LPG won’t do.
Tarawa isn’t a “Japanese atoll” – it is one of the islands belonging to the nation of Kiribati, and was occupied by the Japanese during WWII.
One place largely ignored in discussions and arguments about Pacific sea-levels is the Hawaiian Islands. The main group which includes O’ahu (Honolulu) doesn’t show any acceleration at all, apart from Big Island (Hawai’i Island) which has the active volcanoes – it would seem so be sinking. Honolulu gauge shows 1.44 mm/year since 1905 (to mid-2011). The others (apart from Big Island) range from 1.26 to 2.04 mm/year. GPS shows Honolulu to be currently sinking at about 0.3 mm/year. AFAIK it hasn’t been adjusted for, so the sea-level rate would have been lower if it had been.
I looked at (and posted on) the Hawaiian group because I guessed that being roughly in the middle of the Pacific they wouldn’t be affected by the higher-than-average rise in the western Pacific, nor the near stasis in the east, exemplified by no rise at all since 1980, from San Francisco southwards. I reckon I was right.
[…] fact. This is despite the obvious data manipulation of Jason II. Well, yesterday, the NoTricksZone reports that Geologist Dr. Sebastian Lüning and Prof. Fritz Vahrenholt have sifted through recent […]
[…] No Tricks Zone Share this:PrintEmailMoreStumbleUponTwitterFacebookDiggRedditLike this:LikeBe the first to like this. This entry was posted in Climate Change and tagged climate research, sea level rise. Bookmark the permalink. ← BASIC nations call for rollback of EU carbon tax on aviation […]
[…] a handy article in English at NoTricksZone with a link to the original in […]
[…] https://notrickszone.com/2012/07/13/german-survey-of-recent-scientific-literature-shows-no-signs-of-a… […]