Saturday I posted about a recently published study by He YuXin et al, which happened to catch the watchful eye of Sebastian Lüning of kaltesonne.de/. Lüning comments on what the paper means for Michael Mann:
=================================================
 Medieval warmth at the northern Tibetan Plateau casts doubt on Michael Mann’s temperature map
By Dr. Sebastian Lüning
In 2009 the inventor of the renowned hockey stick graph Michael Mann and his colleagues published a paper in the journal Science where they attempted to refute the global significance of the Medieval Warm Period. The idea behind the paper was to show that the warmth in some areas was offset by cold in other parts of the world. To show this the authors searched out places that were colder than normal 1000 years ago.
The problem was the Atlantic region, which had an excellent amount of data to support the Medieval warmth. Here the temperatures stood at least at today’s levels. Therefore Michael Mann searched around for other regions where far less data was available and found the Central Eurasian region would do just fine. The scarcity of available data left lots of room for interpretation. This is how the authors plotted a huge region of cold over a large swath of Central Eurasia during the Medieval Warm Period, which supposedly offset the inconvenient Atlantic warmth.
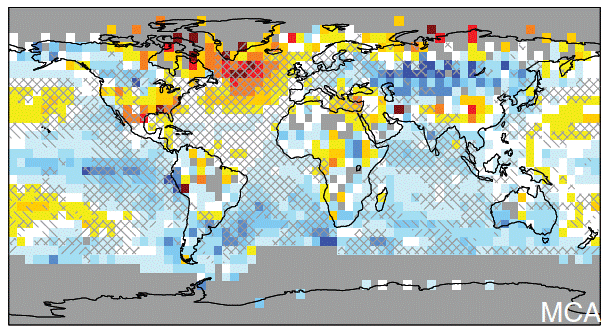
Figure 1: Temperature anomalies during the Medieval Warm Period 1000 years ago as to Mann et al. (2009). In Central Eurasia the authors interpreted a pronounced cold zone.
A Chinese team of scientists led by He YuXin of the University of Hong Kong, however, took a very close look at Mann’s liberally interpreted data and his postulated Central Eurasian cold zone. Using sediment cores extracted from two different lakes and using the so-called alkenone method, the Chinese scientists reconstructed the temperature development over the past 2000 years for the northern Tibetan Plateau, which according to Mann was significantly colder 1000 years ago.
The surprise was big when the new, hard data showed the opposite was in fact true. It turns out that the region of the theoretical cold in the northern Tibetan Plateau during the Medieval Warm Period was indeed not colder but was warmer than today, see Science Bulletin.
In their paper, YuXin and his colleagues made yet another interesting discovery. In the abstract they write: ‘Further, our temperature reconstructions, within age uncertainty, can be well correlated with solar irradiance changes, suggesting a possible link between solar forcing and natural climate variability, at least on the northern Tibetan Plateau.’
The surprisingly good synchronicity between sun and climate in the region of study is clearly visible from the study’s chart:
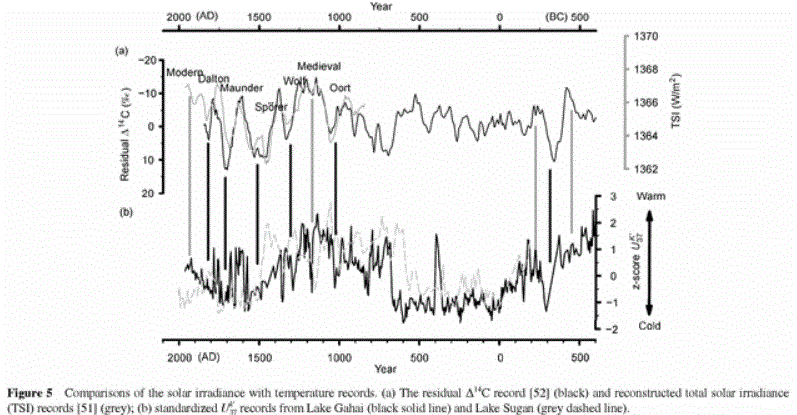
Figure 2: Good agreement between the temperature development at the northern Tibetan Plateau (lower curve) and solar activity over the past 2500 years. From YuXin et al, 2013.
==========================================
Photo credit Lüning: kaltesonne.de/


Lots of temperature reconstructions from all over the world have been published since Mann’s 2009 paper. It would indeed be interesting to see how many contradict his claims.
Meanwhile governments continue inflicting pain through policies based on ideology and greed of the super rich. Ontario is about to despoil the minimally impacted watershed of Lake Superior with industrial wind developments under the “GREEN” Energy Act and is seeking more excuses for alarmist action.
Can you help to innundate them with scientific arguments against this stupidity?
We could repost any submissions from outside the province.
http://www.ebr.gov.on.ca/ERS-WEB-External/displaynoticecontent.do?noticeId=MTE4MzMy&statusId=MTc3MDg5&language=en
The Ontario Ministry of the Environment posted on the Environmental Registry
http://www.ebr.gov.on.ca/ERS-WEB-External/displaynoticecontent.do?noticeId=MTE4MzMy&statusId=MTc3MDg5&language=en
its discussion paper regarding “Greenhouse Gas Emissions Reductions”. Comments are accepted until April 21. Wind turbines feature prominently on the report cover, even though not mentioned specifically.
The report begins as follows, “Climate change threatens the natural environment that sustains us. Governments around the world recognize this and are reducing greenhouse gas emissions to mitigate the effects of climate change and focusing on sustainable development to help industries stay competitive in the emerging low‐carbon economy.”
[…] northern Tibetan Plateau casts doubt on Michael Mann’s temperature map By Dr. Sebastian Lüning HERE, but let us focus on what the Chinese team discovered about the […]
One would hope that at some point, the news media would have a flashbulb (remember those?) go off and suddenly come to realize: Hey! Those who claim AGW/Climate Change don’t know what they are talking about! Unfortunately, these findings will probably be ignored as so many others.
However, given that we appear to be heading into another solar minimum, things could get interesting, based on the findings of YuXin et al in Figure 2!
The ,media are the fifth column. We are on our own.
Mann went to a lot of effort to construct this map from paleo proxies … but the incredible thing is almost evry single proxy he used shows up as warmer than today … the proxies are marked on a side by side map in the paper – and almost all of his ‘medieval cooling’ is simply modelled.
I hope more sientists follow the Chinese lead and investigate some of those other cool spots:
Available here: (needs a log in – no cost) Global Signatures and Dynamical Origins of the Little Ice Age and Medieval Climate Anomaly. Michael E. Mann, Zhihua Zhang, Scott Rutherford, Raymond S. Bradley, Malcolm K. Hughes, Drew Shindell, Caspar Ammann, Greg Faluvegi, Fenbiao Ni
http://www.sciencemag.org/content/326/5957/1256.short
http://www.sciencemag.org/content/326/5957/1256.full.pdf
Note Figure 2 – the top figures showing the temperature anomaly map of the world for the MCA (compared to the 1961 to 1990 period) ..and the weighted proxies on the right…to me it is an incredible construct: Note all the blue (cooler than recent times) on the map.
However, there is warming indicated in the immediate area of the majority of the proxies!!
Starting in northern America we see a cluster of proxies – by the temperature anomaly map, all apparently warmer than now, except for one cooler site. Down to the Caribbean … neutral, but heavily weighted..
Peru, Ecuador, looks like it was warm there…. back up to Greenland … a very warm spot…, across to Europe, only two proxies, one heavily weighted, but both warmer, across to northern Russia …one isolated proxy with an isolated warmer spot … to central China, there is a cooler spot …then head a bit east in China..another very hot spot…then all the way down to Tasmania and New Zealand – Tasmania is cooler, NZ is warmer than now…… Back to Africa, 3 proxies, one cooler (and heavily weighted) and one very lightly weighted and warmer, and one neutral…
Then look at all the modeled cooling on the map … right across central Asia, based on 4 proxies (!!), all of which were warmer except one… ALL of the Southern Ocean, the southern Indian Ocean, and southern Atlantic oceans were supposedly much cooler, (based on Tasmania, and three proxies in Africa?!!) All of the eastern Pacific is shown as cooler, … based on a string of proxies in the western Americas, which were mainly warmer, and perhaps eastern China ..warmer also?
Fig. 2. Reconstructed surface temperature pattern for MCA (950 to 1250 C.E.) and LIA (1400 to 1700 C.E.). Shown are the mean surface temperature anomaly (left) and associated relative weightings of various proxy records used (indicated by size of symbols) for the low-frequency component of the reconstruction (right). Anomalies are defined relative to the 1961– 1990 reference period mean.
[…] (Graph From YuXin et al, 2013.) (To learn more see https://notrickszone.com/2013/04/15/back-to-the-penalty-box-chinese-paleo-climatolgists-slap-down-hig… ) […]