The website of geologist Dr. Sebastian Lüning and Professor Fritz Vahrenholt, authors of the new book: “The Neglected Sun“, has a general solar activity progress report with some interesting observations on solar cycle 24 and comments about upcoming solar cycle 25.
=================================
The Sun In July 2013 – News and Some Statistics
By Frank Bosse
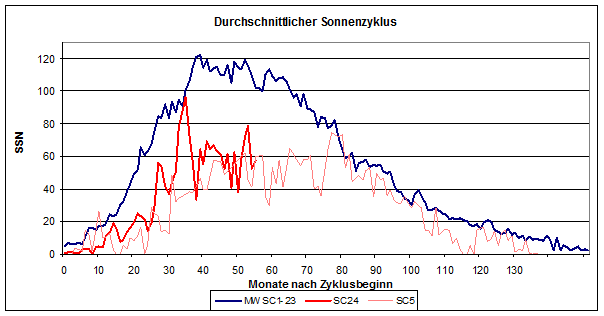
According to the Solar Influences Data Analysis Center (SIDC) in Brussels, the “official” solar sunspot number (SSN) last month was 57.0. Thus it reached only 57% of the mean value of cycles 1-23 in the corresponding time period, see graph below: “Average Solar Cycle”:

The chart is a plot of sunspot number (SSN) versus months after the start of the cycle.dark blue: mean value of cycles 1-23, red curve is the current cycle 24, and the gray curve is cycle no. 5.
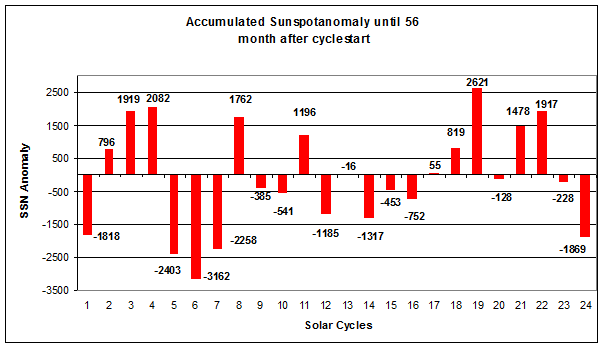
If you calculate using the entire Cycle 24. then we get an activity level that is only about 45% of the mean value. The comparison of all cycles up to the current month:

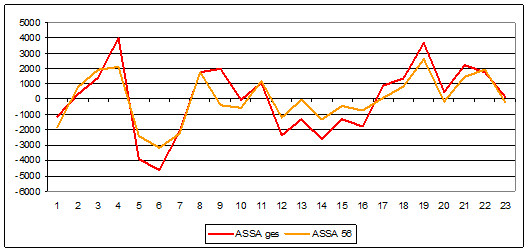
You have to go back all the way to 1827 (SC 7) to find a comparably small activity like what we have seen since 2009. Leif Svalgaard once called the sun a “messy place” in order to tell us that our mother star is always full of surprises. Could there be an unexpected increase in Solar Cycle 24 activity coming up and what is the probability of that happening? Here the solar sunspot number anomalies of the previous chart (ASSA 56 – the accumulated solar sunspot anomaly after 56 months after the start of the cycle) is compared to the total sum of the anomalies (ASSA acc) of the previous cycles 1-23:

Result: There’s a very high probability (average 88%) that we will continue to see an extremely weak solar cycle. A lot indicates an anomaly of -2400 at the end of Cycle 24. Signs show that we are already past the maximum. Also renowned the website spaceweather.com determined this on 26 July 2013. Readers of our monthly Sonneninfo already suspected this earlier (see “The sun in June 2013 – on the way to a grand minimum? New work on the possible consequences“). Here the polar solar fields were depicted. Last month also confirmed the measurement data: The polarity has switched and the maximum is behind us. So how long will the weakening of SC24 take?
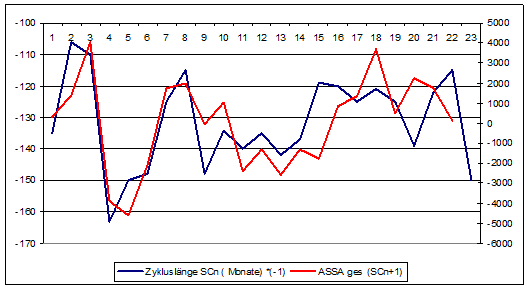
This question is hardly unimportant for telling us what to expect from the upcoming SC25. It has long been known that a long solar cycle of weaker activity is followed by a similar cycle, and vice versa. When you plot the length of the previous cycle with accumulated sunspot anomaly (“ASSA acc”) together with the following cycle, you get this interesting diagram:

Blue curve shows SCn (months) *(-1); Red curve ASSA (SCn+1)
The inverted cycle length of Cycle 1 (blue) was compared with the ASSA acc (red) of the subsequent Cycle 2. Just the length of Cycle 23 (May 1996 until November 2008: 150 months instead of 131.5=10.9 years on average) should have led to the prediction of a weaker Cycle 24, the correlation is over 0.7. In the meantime David Hathaway of NASA has recognized: “Relationships have been found between the size of the next cycle maximum and the length of the previous cycle…”.
Summarizing: The current Cycle 24 is in total the weakest since 1820, the probability of a change into stronger activity is only 12% and the length of the cycle can certainly be a useable indicator for the development of the upcoming SC 25. If solar scientists Livingtson and Penn are correct, SC 25 may be even weaker than SC 24 should the magnetic field strength B in the lower chart fall to 1400 Gauss on average. Below this limit no sunspot can be created, as you can see at the bottom of the chart. The last time that happened, it is suspected, was during the solar Maunder Minimum from 1645-1715.

Source: leif.org


Arresting solar cycle data. So—With Arctic Ice Extent the highest it’s been since at least 2006* and record low temperatures for this date**, and Antarctic ice extent >2SD above “normal,”*** it would appear that we might be entering a grand experiment.
Do these conditions, along with the solar cycle data provided, predict another Little Ice Age? Or worse?
And – have the AO and AMO turned negative? If so, will cooling conditions be enhanced?
*http://ocean.dmi.dk/arctic/old_icecover.uk.php
**http://ocean.dmi.dk/arctic/meant80n.uk.php
***https://notrickszone.com/2013/08/03/calling-mark-serreze-antarctic-open-sea-water-in-death-spiral-soon-penguins-wont-know-what-water-is/
“It has long been known that a long solar cycle of weaker activity is followed by a similar cycle, and vice versa.”
The above statement seems neither logical nor historically correct. But I guess a “messy Sun” can find a way to get out of such a hole.
“the correlation is over 0.7”
So about half the time it works and half the time it doesn’t.
I asked Leif (Dr. Svalgaard from Stanford Univ.) on WUWT the other day about sunspots and have read a number of his posts on this topic.
First, he believes and has publications suggesting that there is no Modern Solar Sunspot maximum, that sunspots need to be recalibrated. Also, in common with the standard position, that TSI does not vary that much and he believes it has a relatively small effect on temperatures.
He also is now wondering if low sunspots might correlate with high temperatures and vice versa. This would be the opposite of the standard interpretation where low sunspots during Dalton and Maunder minimums seem to correlate with very cold times in earth’s recent history. He said that maybe there was a lot of volcanic activity that led to the cold temperatures during these minima.
We may have a good test of this soon as we are in a low sunspot cycle. I asked him what the level of understanding of this was and he said medium to low. So my point is that here we have one of the leading solar scientists and he agrees that much is to be learned yet before we understand it and also has two areas related to sunspots where he thinks that the truth is the opposite of what people have believed for many years. Yet, he as best I can tell is a luke-warmer and falls solidly in the mainstream that believe CO2 is or may have a large effect, greater than the effect of the sun. So, this whole meme of the 97% and settled consensus science is nonsense – as most scientists readily admit. Real scientists don’t like the use of “consensus” to stop debate or think it is helpful.