Fritz Vahrenholt and Frank Bosse have released their November solar activity report. It follows in English.
===================================
The sun in November 2013: You’re going to have to add more antifreeze
By Frank Bosse and Fritz Vahrenholt
(Translated, edited by P Gosselin)
In November 2013 the sun showed signs of more activity as sunspot number (SSN) was 77.6. This solar cycle month (the 60th of the current cycle) was therefore “only” 32% below the level of a normally active sun. Just as a reminder: February 2013 was 66% below the mean value of all the previous observed cycles 1-23! Compared to the mean (blue) the current cycle (red) appears as follows:
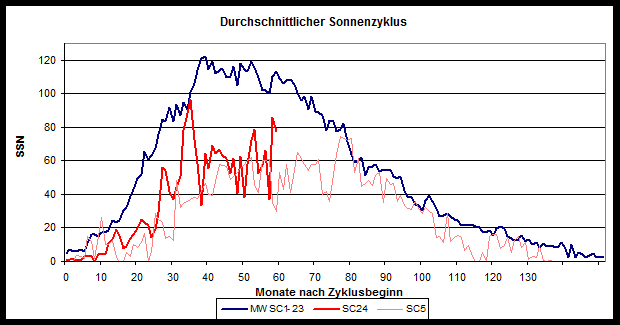
Figure 1: Current cycle 24 (red) versus mean solar cycle (blue) and solar cycle 5 (gray).
Since solar cycle 24 began in December 2008, we have been witnessing a much weaker than normal solar cycle. Temporary spikes like those of last month reaching mean value have been the exception rather than the norm. Thus we continue to be on a similar track as SC 5, which was the first of the Dalton Minimum just after 1800. If one accumulates the sunspot number anomalies of each cycle up to the current month 60, we get the following graphic:
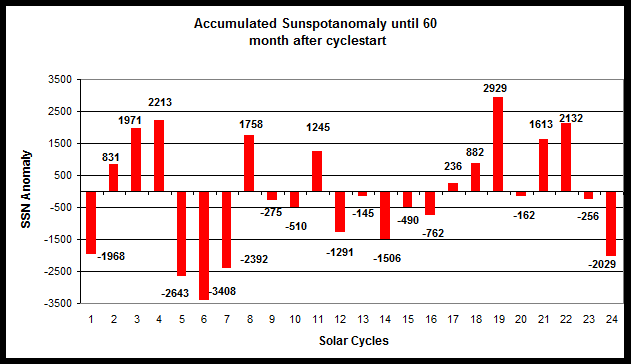
Figure 2: Accumulated sunspot anomaly for each cycle after 60 months.
One immediately sees the abrupt drop in solar cycle 23, which ended in April 2006. Already SC 23 was slightly below normal, and the current cycle has been the calmest since SC 7 in 1833.
What lies ahead?
We have already cited forecasts based on physical attributes where the behavior of the corona (a very warm zone above the visible surface of the sun) and the magnetic field strength about the sun spots suggest continued weakening activity for the next solar cycle (Livingston/Penn). We now cite a study by Salvador (2013) that attempts to reconstruct solar cycles using planetary tidal effects on the sun. Even though we view this approach with skepticism, an amazing level of congruence with observed data is achieved:
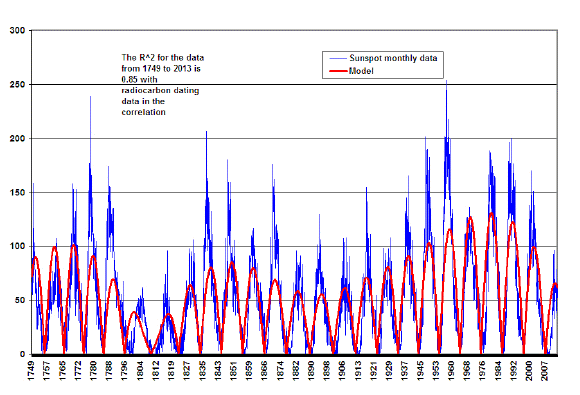
Figure 3: Source: study by Salvador (2013).
The red curve depicts the model and the blue curve shows the observed sunspot data since 1749. On this basis the author then makes a forecast where he takes the data starting in 1987 and calibrates his models using amplitudes and extends it into the future:
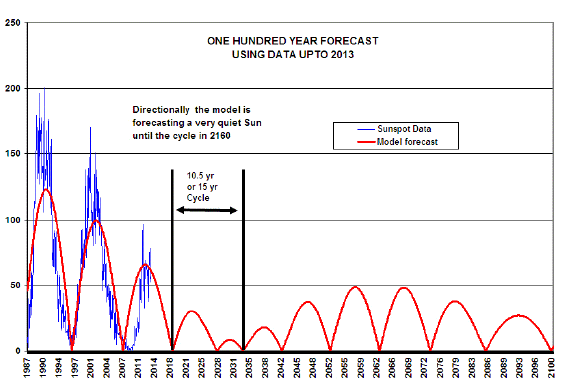
Figure 4. Source: Figure 7 of study by Salvador (2013).
Also in his model, SC 25 and 26 are projected to be very weak and in fact he forecasts a weak sun to persist until the end of the century. It is not our intention to forecast so far into the future, but little is expected to happen with our sun in the next 30 years the author of the article believes in addition to other authors. What impact will this have on the Earth? Shouldn’t the drop in solar activity have and impact? What follows is a chart of the global wintertime temperature distribution comparing the values of the last 10 years to the 12 years that preceded them:
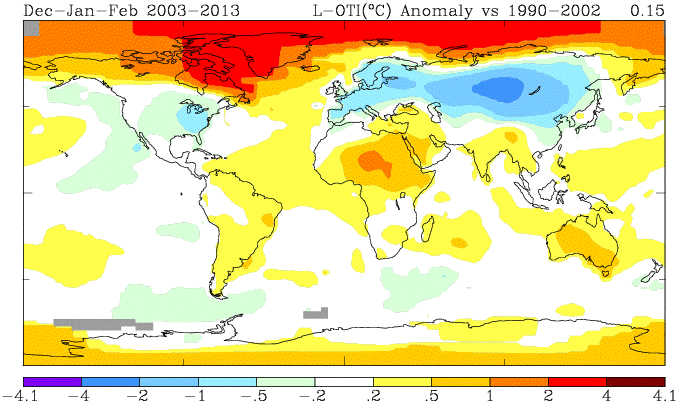
Figure 5. Source: GISS
The land-based temperatures in the winter between 30N and 60N have fallen. Especially the Eurasian region has been experiencing much colder winters since 2002. The datasets yield the following interesting results:
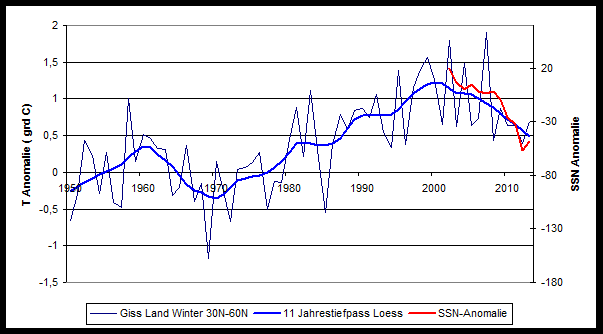
Figure 6.
Depicted by the red curve is the annual SSN anomaly since 2002 as to the first figure. Can the drop since 2003 indeed at least be partially because of the reduced solar activity?
There is plenty of literature available on this, and a possible relation is explained by Sarah Ineson (2012) in a presentation by the British Met Office. The reduced UV radiation of the sun at low activity has an impact on the stratosphere and this has an effect especially on the winter circulation down to the Earth’s surface.
What does this tell us?
The trend to colder winters here in Europe and elsewhere, all the way to China in the Far East and the east coast of the USA, has truly been robust over the last 10 years. From this we conclude that we hardly can anticipate warmer winters for the near future and that it may remain that way for a very long time should the solar relationship be confirmed. Therefore add more anti-freeze in the windscreen wiper reservoir of your car! Winter has arrived and likely it isn’t going to be a mild one!


This seems to get more complicated with each new report whether it be about the Sun or something else. Here in Washington State, over the last couple of years, we have been getting reports of high or low fish (and other critters) numbers – salmon up, sardines down, for example. The PDO was discovered and quantified in the search to explain the harvest from the north Pacific Ocean. Some local reporters have blamed the most recent numbers on the use of fossil fuels (aka climate change) without exhibiting a clue as to the historical context.
The PDO is somewhat cyclical (~60 years) and seems to follow events in the ENSO area of the globe. ENSO, the PDO, others, and cold winters may be driven by UV radiation but a good explanation is (__ fill in the blank __). ‘not yet ready’ ??
Anyway, we are looking at about -20 degrees C. tonight and have antifreeze in the car and a block heater plugged in.
—————————-
About 2 years ago regarding:
Title: “A cold oceanographic regime with high exploitation rates in the Northeast Pacific forecasts a collapse of the sardine stock”
http://www.ncbi.nlm.nih.gov/pmc/articles/PMC3306684/
[…] details and more graphics are HERE, the paper […]
[…] här artikeln är baserad på artikeln The sun in November 2013: You’re going to have to add more antifreeze. Den ursprungliga artikeln är på tyska: Die Sonne im November 2013: Sie werden noch etwas […]
Pierre, if the correlation between the sun and our climate is real and if the forecast to 2160 is correct then, with the Milankovic cycles where they are now, this could provoke the next ice age. Couldn’t it?
I’m not even going to speculate that far into the future. Lots of experts out there, though, saying there’s nothing to worry about concerning a coming ice age.
Richard Tol has assessed that there is a net benefit to Global Warming up until at least a + 2deg C or perhaps by about 2080.
See http://www.spectator.co.uk/features/9057151/carry-on-warming/
Summarised Matt Ridley says there
“Britain’s climate policy is due to cost us £1.8 trillion over the course of this century. In exchange for that sum, we hope to lower the air temperature by about 0.005˚C, which will be undetectable by thermometers. The accepted consensus among economists is that every £100 spent fighting climate change brings £3 of benefit.
So we are doing real harm now to impede a change that will produce net benefits for 70 years. That’s like having radiotherapy because you are feeling too well.”
At the same time the obverse should be examined to clarify the potential cost of likely and impending Global Cooling. It may well be that real cooling would be truly catastrophic economically in the immediate or short term.
The Met Office CET values show that temperatures in the UK in this millennium have significantly declined and that in 2013 the first six months were dramatically cooler by almost 2deg C than the average of the previous 12 years.
Although this is a “cherry picked” one off it would seem to be a significant change in the context a growing line of colder winters in the Northern hemisphere.
“Climate Change” has to cut both ways. It is certain that any measures to control CO2 emissions cannot possibly protect the world from a cooling change.
In the light of current solar activity that cooling process could well be upon us already. So the CAGW movement is pointing the world in exactly the wrong direction
A very short course on global climate.
Temperature is controlled by:
Diurnal, day and night, clouds.
Very short term – days to weeks – atmospheric waves.
Seasons.
Short term – a year to a few years – ENSO, PDO, AMO.
Medium term – 20 years to several centuries – Solar Activity.
Long term – 10,000 years and longer – Melankovich cycles, orbital factors.
Extra credit:
CO2 is driven by all the above because of ocean solubility with temperature. It has little effect on temperature because of water vapor and cloud negative feedback.
You might read my comment here:
http://meteolcd.wordpress.com/2013/11/25/the-winters-they-are-cooling/
which shows that that indeed a cooling winter trend seems very “robust” (how I like that qualifier!) here in Luxembourg, and that the mean winter temperatures seem to correlate well with the winter NAO.