Germany’s Deutsche Wetterdienst cherry-picks its way to warming, hiding that the temperature has been cooling since 2000.
================================================
The German Weather Service has a problem with the climate
By Dr. D. E. Koelle
(Translated/edited by P. Gosselin)
One typically regards the Deutsche Wetterdienst (DWD) as a serious organization that supplies us with reliable weather data. But when it comes to climate, doubt grows when one reads the statements made by leading DWD representatives with respect to the press conference in Berlin over the year 2013.
In it they announce “that the warming is marching on” even though this is not the case according to the DWD’s own data – especially in Germany! Such a claim can only be explained by a political instruction or a hasty allegiance to a government climate policy. Even the director of the Max Planck Institute for Meteorology in Hamburg, Prof. Dr. Jochem Marotzke, said “I don’t know of any serious colleague who would deny that it hasn’t gotten warmer over the last years.”
1990 reference period one today date reference period, which is also used in the USA. When that period is used things look quite different:
The year 2013 is 0.2°C below normal.
A second example used is that today is 1.2°C warmer in Germany than in 1881. Here as well a low temperature reference point is selected again. If, for example, the year 1860 were selected, then the difference would be only half as much, approx. 0.6°C.
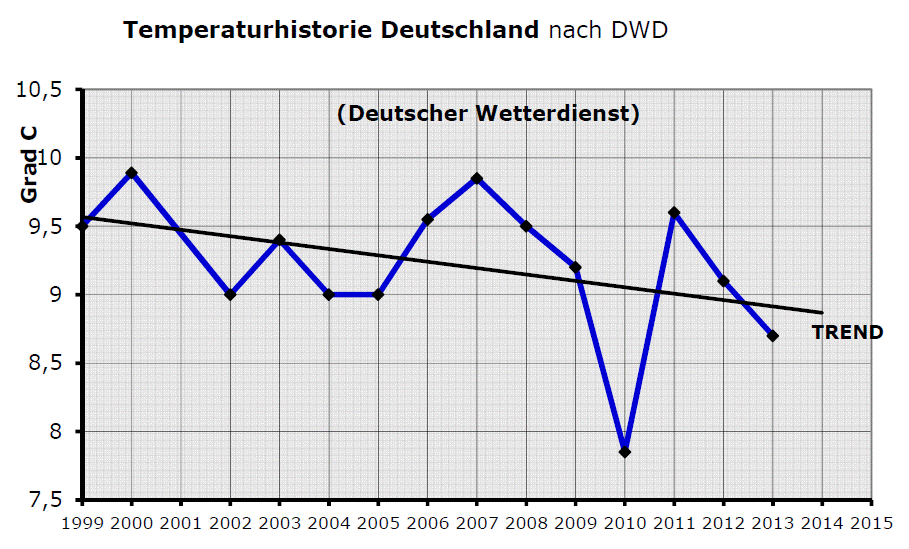
And there is no mention of the fact that the annual temperatures in Germany dropped 0.6°C from 2000 to 2013 (using DWD data!) and that 2013 was the second coldest year of the last 14 years (Figure 1). It was not possible to find any chart showing the recent development at any of the DWD’s Internet pages. Obviously it just doesn’t fit with the prescribed climate ideology. Also when one considers the time period since 1990, there has not been any temperature rise. Instead there has been an almost constant level.
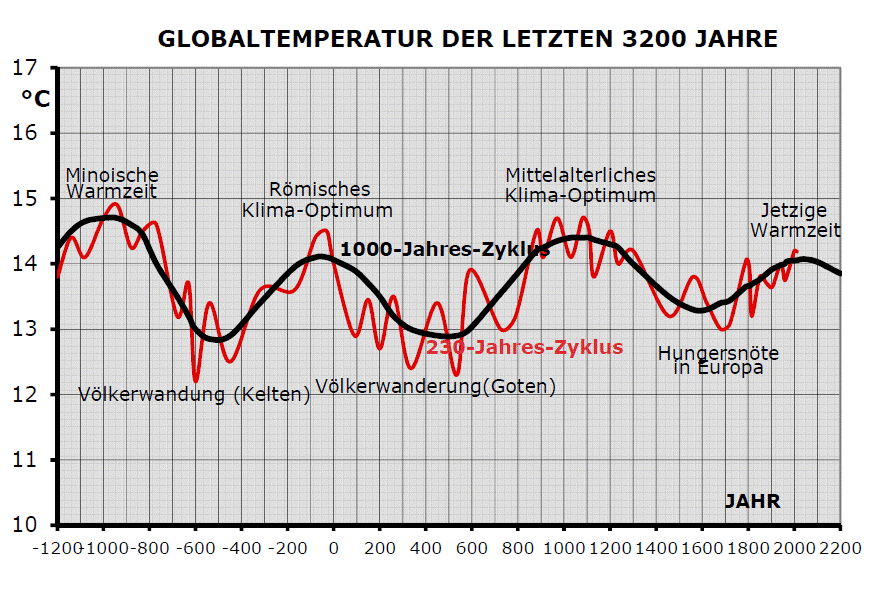
A third example mentioned by the DWD is the claim that the 1983 – 2012 time period is likely the warmest of the last 1400 years, citing the IPCC report. Doesn’t the DWD have its own historical data? Doesn’t the DWD know that not only 1000 years ago was it just as warm as today, but also over the last 3200 years it was just as warm on multiple occasions (and that without the influence of CO2)?
Figure 2 depicts the climate history which shows that warm periods were always times of political stability and economic prosperity. On the other hand the cool periods that occurred between the warm ones were times of instability (migration) and famine occurring due to drought.

Figure 1: Germany annual temperature data 1999-2013, using the DWD’s own data.

Figure 2: Global temperatures over the last 3200 years.


Just as weird in Australia, where some days have been adjusted so the minimum temperature is HIGHER than the maximum. See http://www.warwickhughes.com/blog/
As you note cold weather times aren’t nice. Looks like there will be political instability shortly in Germany.
It is possible to have the minimum higher than the maximum on the same day; if the minima and maxima are expected to occur during specific parts of the day. e.g. the minimum is the lowest temperature before 6 a.m. and the maximum the highest recorded between noon and 6 p.m.
This can produce “nonsense” results if e.g. a very cloudy/rainy day follows a hot spell with rain clouds moving in rapidly in the morning, essentially preventing further heating of the ground; while early precipitation results in a rapid removal of surface heat. The result is a day that just seem to get colder and colder; or at least, doesn’t get any warmer after the late-morning chill.
Bernd, in the instance referenced by Graeme No.3, this has come about in the migration to the BoM’s ACORN dataset … it is a new, much tortured, dataset. In order to get T min. > T max. based on TOBS, there’d have to be some very significant weather phenomena given the prevalent ‘hot’ temperatures in Australia. Your points is taken, though. 😉
But Bernd,
these were ADJUSTED figures. Actually the maximums weren’t adjusted, just the minimums, which means the average rises. The average of the 2 is used for calculating the Global temperature.
I wonder why who would want a rising series of temperatures?
Quack doctors have the sincere wish that their patients become more healthy.
These real temperature DWD declines are matched in the UK MO Central England Temperature Record:
temperature gain since 1850 – 2000 ~+0.7 degC
temperature loss 2000 – 2013
annual ~-0.89degC
winter ~-1.55degC
see http://www.metoffice.gov.uk/hadobs/hadcet/data/download.html
However in the first half of 2013, (January – June) an even more extreme decline in the UKMO CET record occurred. For those six months the UKMO CET temperatures were a full 1.89°C lower than the monthly averages of the previous 12 years.
These declines have been seen widely throughout Europe and the remainder of the Northern Hemisphere. The effect has been mirrored in the Southern hemisphere.
And never forget that the last recent millennium 1000 – 2000 AD has been the coolest 1000 year period of the Holocene epoch.
Dr. D. E. Koelle: “Doesn’t the DWD know that not only 1000 years ago was it just as warm as today, but also over the last 3200 years it was just as warm on multiple occasions (and that without the influence of CO2)?”
The last part of that should be: “(and that without the influence of man-made CO2)?” as there most certainly was atmospheric CO2, except that virtually none of it was from man-made sources.