Response to NOAA’s claim adjustments are improvements
By Mike Brakey
The email from NOAA’s Derek Arndt confirms that they conducted a massive rewrite of U.S. data in 2014. He also confirmed that the 1913 Maine climate data was indeed lowered a whopping 40F as noted in my article, Black Swan Climate Theory.
My response is based on actual unadjusted temperature data from the Lewiston-Auburn area of Maine, which I secured from a local source and provided in prior emails. (I have attached that data and links to the websites the data was extracted from). As shown in Chart 1, between 1895 and 1937, the Lewiston-Auburn region (Zone 19 in Chart 2) was typically ¾0F warmer than Maine’s overall state average, based on NOAA data I downloaded in 2013.
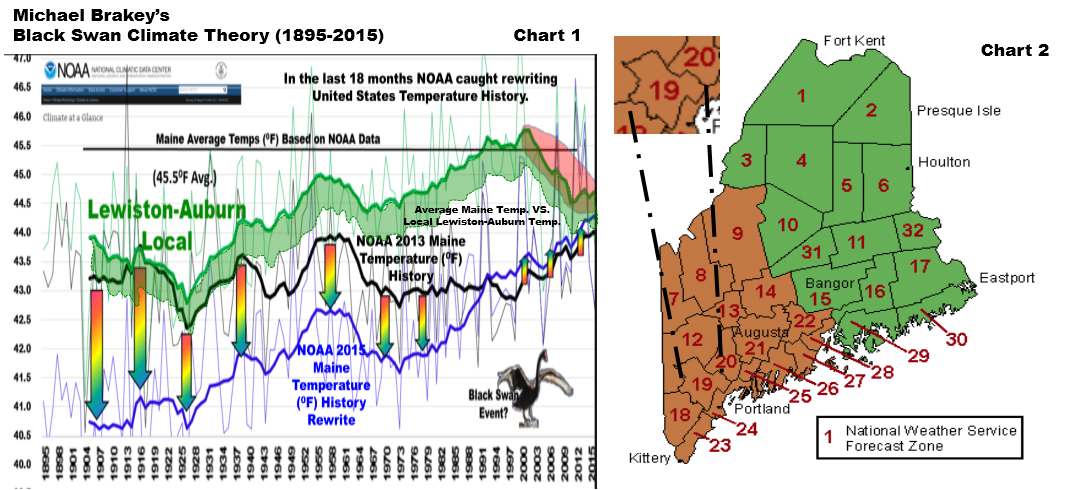
Chart No. 1 & 2.
This data is the black line on Chart 1. I would expect the Lewiston-Auburn area to be slightly warmer than Maine as a whole because it is in southern Maine. Based on the 2013 data, Maine’s average temperatures were about ¾0F colder or less than those for Lewiston-Auburn during the period from 1904 to 1939, and again from 2008 through the present.
The green shaded area shows what the NOAA data would have looked like if that ¾0F difference had remained constant through 2015. Looking at the year 1913, I might agree with Mr. Arndt that they had an error and I would understand a temperature correction of approximately ¾0F, but not 40F.
Contradictory data
I am suspicious of the NOAA data, both the original from 2013 and the revised, between 1940 and 2008 because the Maine average temperatures are so significantly less than those for the Lewiston-Auburn region. The other oddity is that there was a downward trend in temperatures for Lewiston-Auburn starting in 1998. However, both sets of NOAA data show temperatures rising for the state of Maine during that same time period.
As well-intended as I believe most NOAA associates likely are, I implore NOAA to please make available the plain, unexciting, unfiltered temperature data (as typified by the green line in Chart 1 above). If the RAW temperature data is always made available, I would be happy to entertain any theories and projections NOAA or IPCC wishes to make…as long as we all know the true base line (similar to what we have for the green line in Chart 1 with Lewiston-Auburn historical temperature data).
In conclusion, I implore NOAA to return credibility to its website, by getting out of the statistical smoothing and adjusting business and by just providing the scientific community with the basic unfiltered temperature data at all of its site locales. Let’s stay away from all the havoc created between Charts 3 and 4.
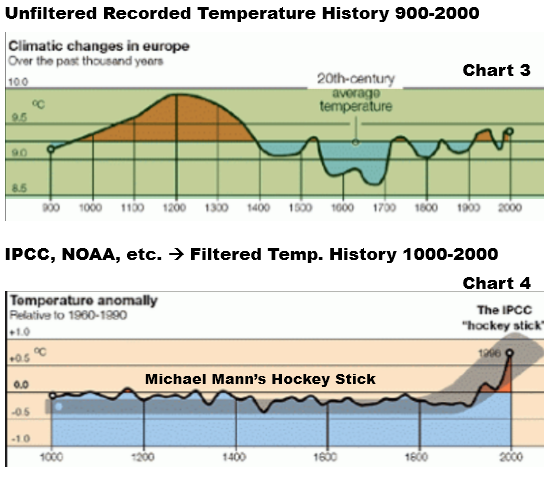
Chart no. 3 & 4.
Watch the entire series of YouTube videos on how I found the NOAA adjustments.


I agree that NOAA should provide RAW data, either directly or via links to other sources, if only to provide traceability. Most agencies do that, e.g. the Australian BoM.
But they also need to provide “homogenised” (adjusted) data, to remove non-climatic effects such as station moves or changes in how thermometers were enclosed. A properly radiation-screened thermometer can be several degrees C cooler than one that isn’t.
Your graph shows that green and black (unadjusted) are inconsistent, the temperature difference changes too much between 1895 and now. The graph also shows that green and blue (adjusted) ARE consistent, the temperature difference is approx constant. That does not prove though that the blue is correct, but your argument about the average temperature does not prove that the blue is incorrect. There could easily be a 4F difference in temperature between nearby stations, if there are differences in elevation, distance from the sea, topography, vegetation or ground water.
In the quality control process at climate centers, outlying values are flagged and removed, and non-climatic changes such as changes in siting or instrumentation show up as step changes. The problem here is that even when the unadjusted record is clean of step changes, the file is adjusted through altering the values or deleting data submitted by the weather authorities. And the adjusted files typically show increased warming rates, 83% of the time in one sample set of stations.
https://rclutz.wordpress.com/2015/04/26/temperature-data-review-project-my-submission/
There may be valid reasons for large net changes in warming trends due to homogenisation in some areas (e.g. transition from imperfect to near-perfect radiation screening). You have to show clear errors, not just point out large trend changes and say that therefore they must be wrong.
Iceland and Paraguay are (I believe) clear errors, but it is quite striking that many have complained about US adjustments, but no clear errors have yet been identified there.
Not errors; clear fraud:
“US Temperatures Have Been Falsely Adjusted According to the Level of Carbon Dioxide in the Atmosphere”
You haven’t heard of this in the last 2 and 1/2 years? I’m not surprised; nobody on any side of the debate has learned anything, you all just keep pushing what you think you know–but you don’t.
Well aware of it, Harry.
SG showed an R^2 of 0.99 for the correlation between adjustments and the change in atmospheric CO2
Way beyond pure chance. !
A thought experiment for you: imagine 2 plots, one your weight versus time, the other the height of trees versus time. Both look very similar (roughly linear trends), does that mean that trees are controlling your weight?
Mikky says:
9. May 2015 at 9:20 PM
“You have to show clear errors, not just point out large trend changes and say that therefore they must be wrong.”
For years now the trolls are running tireless deflection campaigns for the crooks. This will not help you. The problem is, people store stuff before the government crooks replace it with the latest forgery.
https://stevengoddard.wordpress.com/data-tampering-at-ushcngiss/
It looks like you are detecting step changes by a standalone method, looking only at the time series in question. That method is poor and will either miss many step changes, or have a very high false alarm rate from genuine changes in weather. Much better is to look at differences between nearby stations.
Why don’t you stop making excuses. Have you any idea what kind of “keying error” in a daily data entry it would take to cause a 4.0 degree error in the Annual value. 4 x 365 = 1460 degrees
Do you honestly think that there was no “Quality Control” check done on the keying that looks for totally ridiculous values like that.
This is not the only problem in this area, see this report.
http://junkscience.com/2015/05/08/gordon-fulks-physicist-provides-another-example-of-temp-record-cheating/
I bottom line, is that these so-called adjustments, often based on nothing but suppositions and whims, are responsible for a good 1/2 to 2/3 of the so-called warming.
They are also responsible for the almost complete removal of Tom Wiggly’s “inconvenient” 1940 peak which was once present in nearly every NH data set, thus allowing the warming trend from 1940 to 2000 to be massively exaggerated. That peak destroyed the alarmista story, and had to be removed… so they invented methods and passed them through peer-review… the rest is re-written history.
darn.. must have got my html wrong, I only wanted the word “every” in bold. Can it be fixed ?
“As well-intended as I believe most NOAA associates likely are”
Oh, I wouldn’t go that far given the general state of Western governments at this point. I think they’re overgrown with lazy parasites who do anything for their monthly tax money cut.
This reminds me of an old Russian joke “The future is known, it’s the past that keeps changing”. Who knows, maybe someone at NOAA has a Russian background.
Why can’t they accept that oceans make temperature changes?
https://rclutz.wordpress.com/2015/05/10/empirical-evidence-oceans-make-climate/