The first 2016 hurricane season predictions are starting to come out. And if the one by Global Weather Oscillations is on the right track, then US coastal areas may want to already start bracing for greater hurricane activity.
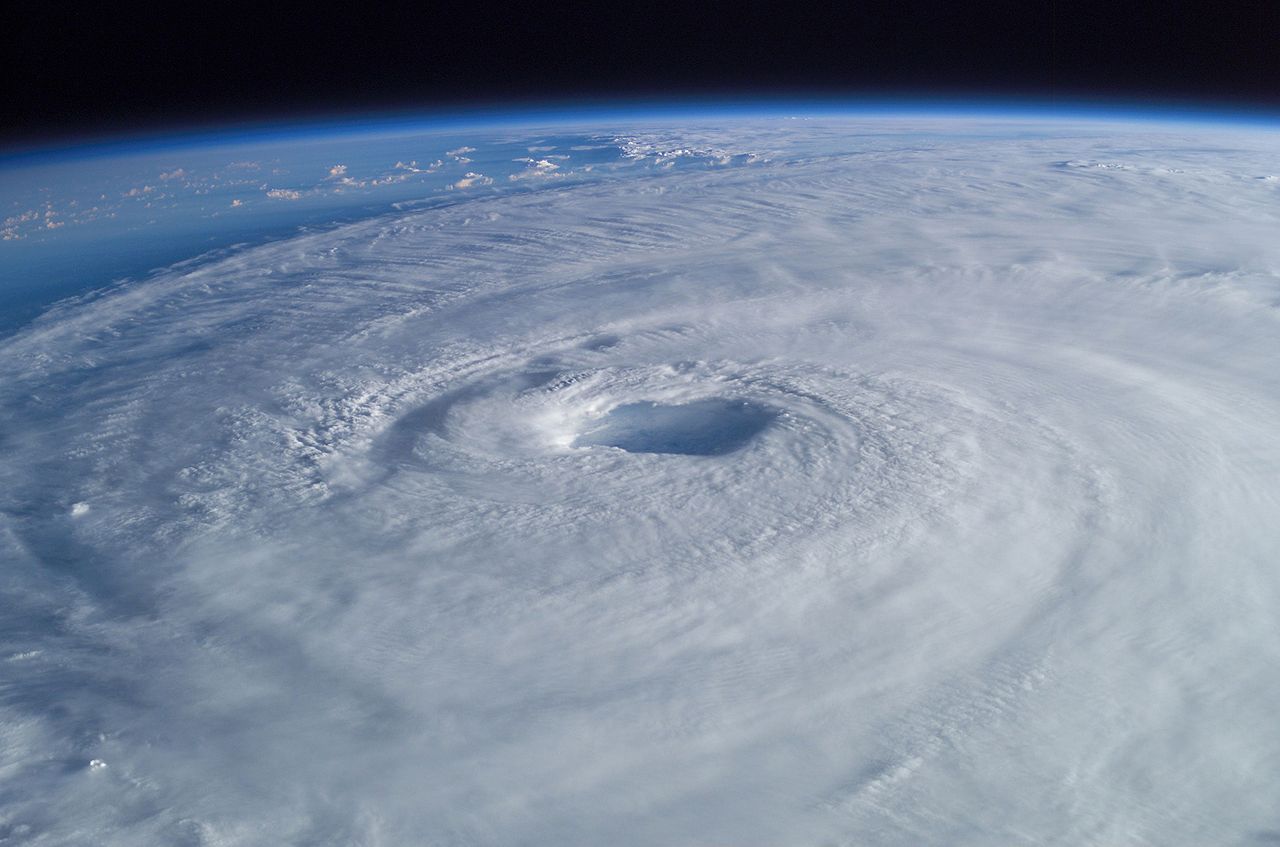
Hurricane Isabel. Photo by Mike Trenchard, Earth Sciences & Image Analysis Laboratory , Johnson Space Center. Public Domain
In fact this year we should expect US hurricanes to very likely play a crucial role in the US presidential elections, especially amid the climate change hysteria within the mainstream media and Democrat alarmist politicians. Recall what happened in 2012.
Strongest in over 4 years
Former NOAA meteorologist David Dilley of Global Weather Oscillations (GWO) says the 2016 and 2017 Atlantic hurricane seasons will be the strongest in over 4 years, and have the most United States hurricane landfalls since 11 were experienced during the destructive seasons of 2004 and 2005.
GWO has issued the most accurate predictions of any organization over the past 7 years, and says that unlike the past three hurricane seasons, which were dominated by hostile atmospheric conditions that subdued hurricane activity, the next few years will be in a “Climate Pulse Hurricane Enhancement Cycle” that will provide very favorable conditions for development of tropical storms and hurricanes.
The Atlantic Basin Hurricane Season runs from June 1 to December 1, and on the average has 12 named storms, 6 hurricanes and 2 or 3 major hurricanes. The 2015 hurricane season officially ended with 11 named storms, 4 hurricanes and 2 major hurricanes. Hurricane Alex formed on January 14th of this year, only 6 weeks following the official ending of the 2015 season – but nearly 5 months prior to the beginning of the 2016 hurricane season. Alex was officially called the first hurricane of the 2016 Hurricane Season, based on the January to December Gregorian January – not the natural climate and weather calendar that drives development of tropical storms during a season.
But with Hurricane Alex being more closely attached to the 2015 into early 2016 El Niño and the climate season – this means the 2015 hurricane season actually had 1 additional named storm and hurricane. This brings the total for the 2015 season up to 12 named storms and 5 hurricanes, which is very close to the long term average of 12 named storms and 6 hurricanes.
El Niños normally suppress hurricanes, but…
The numbers for the 2015 season are very important when it comes to predicting the upcoming hurricane seasons. The occurrence of an El Niño during a hurricane season typically suppresses the number of named storms significantly – but it did not in 2015 – and this is a signal for what is in-store the next few seasons.
CEO David Dilley of GWO says the combination of the El Niño ending before the 2016 hurricane season, and the high number of named storms (12) connected to the 2015 season, signals that a “Climate Pulse Hurricane Enhancement Cycle” is now in place, and this will provide very favorable atmospheric conditions for hurricane development and landfalls during the next couple of years.
Most dangerous and costly in over 10 years
Mr. Dilley predicts the upcoming 2016 and 2017 seasons will be much stronger than the past three seasons, and it will likely be the most dangerous and costly period in over 10 years. The 2016 season will have 17 named storms, 9 hurricanes, and 4 major hurricanes. Three of the GWO United States prediction zones are at high risk for hurricane conditions in 2016. One of the zones has a high risk for a major impact hurricane. The 2017 season will be more dangerous and costly than 2016, with 17 named storms, 9 hurricanes, 5 major hurricanes, and several of the GWO prediction zones will be at high risk for major impact hurricanes. Over the two year period, GWO expects 5 to 8 United States Hurricane Hot Spots.
Models predict hurricanes 2 to 3 years in advance
GWO is the only organization that issues detailed preseason predictions two years into the future for 11 United States prediction zones from New England to Texas. GWO’s predictions have been the most accurate of any organization the past 7 years, and GWO is the only organization that predicted the occurrence of Hurricane Ike (2008), Irene (2011), and Sandy (2012). Hurricanes Irene and Sandy were predicted 2 to 3 years in advance.
What makes GWO standout from other organizations is their commitment to research and development of GWO’s “Climate Pulse Technology” (CPT). The CPT prediction model incorporates natural mechanisms that control the rhythm of weather and climate cycles, which in-turn control future hurricane paths. Research over the past 30 years has found that each of the Atlantic and Gulf coastal zones have different weather cycles, and within each cycle, there exists smaller weather cycles which make each zone unique. Once all of the cycles are discovered, GWO then uses the Climate Pulse Technology to accurately assess the intensity of a future hurricane seasons, and the probability risk for hurricane or tropical storm conditions within a prediction zone for that year.
GWO Webinars, detailed hurricane zone predictions, prediction performance over the past 7 years, graphics, and the “free” climate change e-book “Earth’s Natural Climate Pulse” (authored by David Dilley) can be acquired through the Global Weather Oscillatlions web site. In addition, an interactive electronic subscription to the GWO’s hurricane predictions can also be acquired through GWO’s working partner XtremeGIS the risk management division of the Wall Street Network.
87% accuracy
When GWO predicts a high probability for hurricane conditions within one of their prediction zones, it is red-flagged as a hurricane or tropical storm “Hot Spot”. GWO’s hot spot predictions for the United States have been nearly 87 percent accurate since 2006, and instrumental for long-range planning by companies and other organizations. GWO is the only organization that predicts hurricane conditions for specific zones, and for up to 4 years in advance. Detailed predictions for the 11 hurricane zones can be obtained by going to the Global Weather Oscillations web site.


Well 2016 is 62 years after the very bad 1954 hurricane season, and the period of the AMO is about 62 years.
So it makes sense, although prediction is always hard especially about the future.
I wonder what Bill Gray has to say about this prediction?
Not by a warmist using CO2 forcing so they CAGW crowd will reject this paper and claim any increase in hurricane intensity and frequency is due to CO2 causing CAGW leading to increased ocean temperature
Make a note to revisit this issue next February.
The big El Niño of 1997-98 was followed by the
1998 Atlantic Hurricane Season [link below has list and map]
Mitch was a high casualty event in Central America.
http://www.nhc.noaa.gov/data/tcr/index.php?season=1998&basin=atl
14 events – Alex to Nicole
4 tropical storms
10 hurricanes
Al Gore claimed (2005) that CAGW would raise hurricane intensity. Here in Florida I am bracing for the impact that failed to materialize.
Did Al Gore lie? Or is he an imbecile? If you are charitable you will say “No” to those alternatives and admit that he was mistaken.
Such a trivial prediction, that after 10 years without a major hurricane that the coming season will be more costly than the last decade.
I’ll believe it when I see it…
http://www.nbcmiami.com/news/local/NBC-MIami-review-Hurricane-predictions-are-wrong-about-half-the-time-95081124.html
And this is why GWO has the best track record during the past 7 years. Back in 2009 all organizations except GWO went predicted a strong season – but here at GWO we said weak because there would be an El Nino – and we were correct. Back in 2013 all organizations said it would be a strong season – but GWO said hostile winds and weak season and it ended up being the 3rd weakest in 53 years. In 2014 organizations called for a very weak season because they expected an El Nino – GWO said “no El Nino” and it ended up near normal. Then in 2015 most organizations except TSR and GWO predicted way too weak, only TSR and GWO predicted the closest, and with 5 hurricanes (counting Alex in January that should be tagged to the 2015 season).
from the website
“Hurricanes Irene and Sandy predicted 3 years in advance.”
Can’t be. There are too many unknowns, any one of which can either prevent a storm from forming, cause one to form when it otherwise might not have or redirect it from it’s anticipated trajectory to an entirely different one. And that’s in the same week, day or even hour. Sorry, but I’m not buying it.
I watched your video, and wish that you had posted it to begin with.
https://www.youtube.com/watch?v=w4hbKF5-qUE
It makes sense. Glad I live in Florida.
OK, David, I’m watching another of your presentations.
https://www.youtube.com/watch?v=F0Y7DYDLIl0
And your ideas appear to hold together rather well, a lot better in fact than the alternatives. It’s-becoming clear why the warmists don’t like them.
I still think no one can predict the exact time and path of a hurricane, as you seem to admit on your website when claiming 85% success. My initial opposition was based on what I still think may be your “overselling” your method, in claiming to have predicted specific storms years in advance. But I’m open to what does work, now that I’m getting the details.
So, apologies for the negativity, and thanks for posting those videos I found.
I am not certain where to put this SL comment.
In a 2015 SL article here David Burton demonstrated how there is no acceleration in the tide gauge record. It was also mentioned that reservoir storage may have artificially lowered the trend. CAGW proponent Sod injected this criticism of that idea…
sod 20. September 2015 at 7:58 AM | Permalink “2.
Sod, quoting the post, “The mid-20th century dam-building boom (think Aswan!) has ended. ”
Sod said, Are you serious about this point? This source has done the calculation for a km³ of water (less than 3 microns). https://climatesanity.wordpress.com/conversion-factors-for-ice-and-water-mass-and-volume/ Aswan dam (132 km³) was filled over 6 years. Have you done any kind of calculation on this subject that supports your “acceleration thesis”??? – See more at: https://notrickszone.com/2015/09/03/sea-level-analyst-not-possible-to-torture-coastal-tide-gauge-data-into-yielding-a-sea-level-rise-anywhere-near-3-3-mmyr/#sthash.pXcGFoUq.dpuf
looking at Sods link we find this information…
How much does one Gigatonne of melted ice (1 km³ of water) raise the oceans?
The oceans occupy 361 million square kilometers ( 361 x 106 km²) of the Earth’s surface.
If one cubic kilometer of water (i.e., one gigatonne of water) is spread evenly over the entire 361 million square kilomters, the thickness of the new layer of water will be given by:
1 km³ / 361 x 106 km² = 2.78 x 10⁻⁶ meters = 2.78 microns.
Or, in terms of gigatonnes:
1 Gt x (1 km³/Gt) / 361 x 106 km² = 2.78 x 10⁻⁶ meters = 2.78 microns / Gt
Sod summarizes…”That is, one cubic kilometer of water (i.e., one gigatonne of water) will add less than 3 millionths of a meter to the oceans!”
How many gigatonnes of ice must melt to raise the oceans one inch?
1 inch = 25.4 mm = 2.54 x 10⁻² meters
The number of gigatonnes of water that must be added to the oceans to raise the sea level 1 inch is given by:
1 inch x (2.54 x 10⁻² m / inch) / (2.78 x 10⁻⁶ m / Gt) = 9137 Gt
So, 9137 km³ of water will raise the oceans 1 inch
Let’s do the basic research Sod assumed was meaningless. Per the global reservoir storage capacity chart, about 5,250 sq kilometers of reservoir storage added during the 50 year period from 1955 to 2005!
Each sq. kilometer of manmade storage is 2.78 microns that that the oceans did not rise due to humans reservoir building. 5,250 x 2.78 microns is 14,595 microns withheld from the oceans for the 50 year period from 1955 to 2005.
This is .575 inches of S.L. rise which did not occur in that period, or 14.6 millimeters for the fifty year period; effectively artificially lowering the trend .292 millimeters per year below what it would have been without humans lowering the natural trend through adding reservoir storage.
Since 2005 global reservoir storage has basically flat lined, meaning that to isolate the natural and CO2 component of SL rise, the last 10 years of sea level rise should be lowered .292 millimeters per year if one wishes to compare those ten years to the 55 year period preceding it. (Alternatively one could of course adjust up the previous trend from 1955 to 2005 by .292 mm per year.) In truth the trend for adding storage capacity begins to flatten around 1985, going completely flat by 2005. This adds significantly to David Burtons post.
Joe Bastardi has already issued a similar suggestive forecast. 2016 worse, 2017 worse. 1950s being his analoque
It would be interesting to hear what Piers Corbyn thinks about this forecast.
David A.
Are you assuming all reservoirs average 1km depth?
I suggest 10m average might be more likely.
so dive your 14.6mm by 100 to give 0.146mm of rise underestimated in 50 years.
How scary is that?
It is based on a graphic, Dam and Reservoir Storage capacity 1900 to 2010 given in the metric of cubic kilometers, so it should be accurate.
https://www.e-education.psu.edu/earth111/sites/www.e-education.psu.edu.earth111/files/Module5/Earth111Mod5Fig1.png
https://www.google.com/url?sa=i&rct=j&q=&esrc=s&source=images&cd=&cad=rja&uact=8&ved=0ahUKEwi49t-y_t7KAhVX8GMKHVohCBcQjhwIBQ&url=https%3A%2F%2Fwww.e-education.psu.edu%2Fearth111%2Fnode%2F893&psig=AFQjCNEAwhw6s29f4ecdH1ahmsoWAYFM_g&ust=1454705397172950
To be fair average mean storage may make this close to .2 mm per year, less but not insignificant, and strengthening David Burton’s argument of no acceleration in SL based on tide gauges.
Were there actually 5 land falling Hurricanes in 2015, because I seem to have missed them?
Or was that just Hurricanes created at Sea?
http://www.nhc.noaa.gov/data/tcr/index.php?season=2015&basin=atl
Map is below list.
TS Bill came into Texas, in June.
A post indicated that “Joe Bastardi has already issued a similar suggestive forecast. 2016 worse, 2017 worse. 1950s being his analoque” – question is; when did he come out with his prediction, and how concise was it?
Mr. Dilley issued concise predictions for 2016-2017 seasons back in mid-December 2015 and began issuing the 11 zone predictions at that time. GWO also posted January 01 on the GWO web site (www.GlobalWeatherOscillations.com) the numbers predictions for 2016 and 2017, then followed up with the Press Release on February 01. GWO has also been conducting weekly Webinars discussing the 2016-17 predictions since mid-December. Bottom Line: GWO was likely the first organization to predict the upcoming 2-year period.
I’m 9 minutes into this.
https://www.youtube.com/watch?v=w4hbKF5-qUE
So far so good.