As of mid-September, there have already been 77 peer-reviewed scientific papers authored by several hundred scientists linking solar activity to climate change. There were 43 as of the end of June, as seen here. In other words, there have been 34 more papers linking solar forcing to climate change made available online just since July.
This publication rate for 2016 is slightly ahead of the pace of published papers linking solar forcing to climate change for 2015 (95 Solar-Climate papers ) and 2014 (93 Solar-Climate papers). At this rate, it is likely that a list of 300+ scientific papers linking solar forcing to climate change will have been made available between 2014 and 2016.
In addition, there have already been 41 papers published in science journals this year linking natural oceanic oscillations (i.e., ENSO, NAO, AMO, PDO) to climate changes. There were 27 such papers as of the end of June.
The solar-ocean oscillation climate connection has gained widespread acceptance in the scientific community. For example, see “35 New Scientific Publications Confirm Ocean Cycles, Sun Are the Main Climate Drivers”
The latest papers linking solar activity as well as ocean oscillations to climate changes are listed below. Not only do these papers describe solar activity and ocean oscillations as the dominant mechanisms of climate change, they provide evidence that the modern, post-1950 period does not contain the highest temperatures of the last few hundred years. In fact, these papers each document that temperatures during some periods of the 1700s and/or 1800s were just as warm or warmer than present temperatures.
That periods with much lower CO2 concentrations (of about 280 parts per million, or 0.028% of atmospheric gases) could have warmer-than-now temperatures (with present CO2 concentrations reaching 400 parts per million) defies claims that variations in CO2 primarily (or even exclusively) determine the temperature of the planet’s water and air, and that natural variations in solar activity, ocean heat distribution/cycling, clouds, volcanic activity…play little to no role in long-term climate change.
Perhaps this CO2-drives-climate paradigm needs to be updated to reflect the growing body of scientific evidence that the Sun and natural ocean cycling are primarily what drive temperature variations — not CO2.
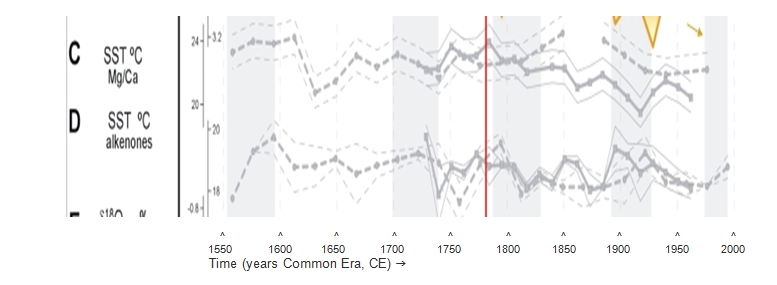
1. Incarbona et al., 2016 (Sicily, Aegean Sea)
Comparison between the records and multi-decadal atmospheric circulation patterns and climatic external forcings indicates that Mediterranean circulation destabilisation occurs during positive North Atlantic Oscillation (NAO) and negative Atlantic Multidecadal Oscillation (AMO) phases, reduced solar activity and strong tropical volcanic eruptions. They may have recurrently produced favourable deep-water formation conditions, both increasing salinity and reducing temperature on multi-decadal time scales.
[B]oth NAO and AMO are of importance for the Mediterranean climate variability. In particular, at multidedacal scales, positive NAO phases lead to decreased precipitation (i.e. higher salinity) while negative AMO leads to reduced SSTs. Both processes may have favoured deep-water formation events on relatively long time scales.
Thermohaline circulation destabilisations in the Mediterranean circulation also seem to be linked to reduced solar activity (ref. 40; Fig. 4D) and to frequent volcanic eruptions (ref. 41; Fig. 4E). Solar activity modulates patterns in surface temperature and pressure that resemble NAO phases, through dynamical coupling processes between the stratosphere and the troposphere that transmit the solar signal to the Earth’s surface. The increase in sulphur aerosols from tropical volcanic emissions produces stratospheric and surface conditions that resemble the positive NAO phase and cause decrease in oceanic heat content, with long-lived temperature anomalies extending to the mid-depth and deep ocean, an increase in sea ice volume and enhancement in the overturning circulation of the North Atlantic Ocean following these eruptions. These phenomena may have shaped the North Atlantic atmospheric pattern, which in turn may have led to Aegean SSTs cooling and thus surface buoyancy loss and enhanced Eastern Mediterranean deep-water formation during EMT-like events.
2. Lyu et al., 2016 (China)
The reconstructed April–July MMT series exhibited six cold and seven warm periods. The longest cold period lasted from AD 1645 to 1677 (33 years), with an average temperature of 0.5 ◦C below the mean value. The longest warm period, however, lasted from AD 1767 to 1785 (19 years), and the average temperature was 0.69 ◦C above the mean value (Table 4). Four cold (1605–1616, 1645–1677, 1911–1924, and 1951–1969) and warm (1795–1807, 1838– 1848, 1856–1873, and 1991–2008) periods were consistent with other results of tree-ring reconstructions in northeast China (Shao and Wu, 1997; Yin et al., 2009; Wang et al., 2012; Zhu et al., 2015). In addition, two cold periods (1645– 1677 and 1684–1691) were consistent with the Maunder Minimum (1645–1715), an interval of decreased solar irradiance (Bard et al., 2000). … The three temperature series exhibited significantly low temperature periods during the 1950s–1970s, which coincided with a slight decrease in solar activity from AD 1940 to 1970 (Beer et al., 2000; Fig. 7).
[P]revious studies suggest that climate change in northeast China was also linked to the solar activities and global land–sea atmospheric circulation during certain pre-instrumental periods (Chen et al., 2006; Wang et al., 2011; Liu et al., 2013). It is generally accepted that the climate warms during periods of strong solar activity (e.g., the Medieval Warm Period) and cools during periods of low solar activity (e.g., the Little Ice Age; Lean and Rind, 1999; Bond et al., 2001).
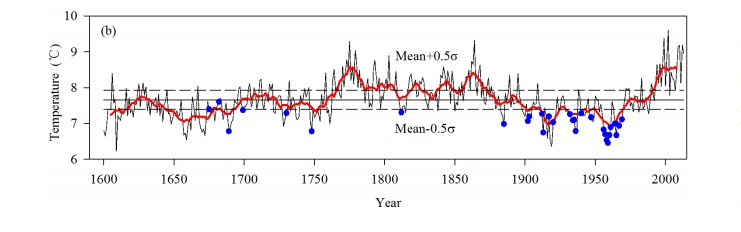
“Reconstruction of April-July minimum temperature on Laobai Mountain for the last 414 years [1600-2014]. The smoothed line indicates the 11-year moving average, and blue dots represent minimum freezing events.”
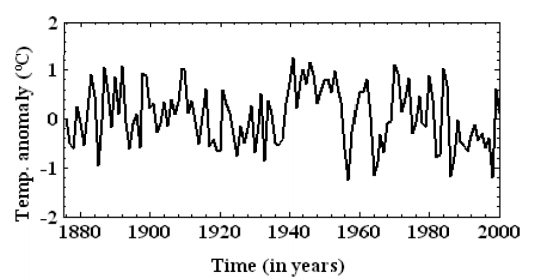
3. Sunkara and Tiwari, 2016 (India)
To study the imprints of the solar–ENSO–geomagnetic activity on the Indian subcontinent, we have applied singular spectral analysis (SSA) and wavelet analysis to the tree-ring temperature variability record from the Western Himalayas. Other data used in the present study are the solar sunspot number (SSN), geomagnetic indices (aa index), and the Southern Oscillation Index (SOI) for the common time period of 1876–2000. Both SSA and wavelet spectral analyses reveal the presence of 5–7-year short-term ENSO variations and the 11-year solar cycle, indicating the possible combined influences of solar–geomagnetic activities and ENSO on the Indian temperature. Another prominent signal corresponding to 33-year periodicity in the tree-ring record suggests the Sun-temperature variability link probably induced by changes in the basic state of the Earth’s atmosphere. In order to complement the above findings, we performed a wavelet analysis of SSA reconstructed time series, which agrees well with our earlier results and increases the signal-to-noise ratio, thereby showing the strong influence of solar–geomagnetic activity and ENSO throughout the entire period. The solar flares are considered responsible for causing the atmospheric circulation patterns. The net effect of solar–geomagnetic processes on the temperature record might suggest counteracting influences on shorter (about 5–6-year) and longer (about 11–12-year) timescales. The present analyses suggest that the influence of solar activities on the Indian temperature variability operates in part indirectly through coupling of ENSO on multilateral timescales. The analyses, hence, provide credible evidence of teleconnections of tropical Pacific climatic variability and Indian climate ranging from inter-annual to decadal timescales and also suggest the possible role of exogenic triggering in reorganizing the global Earth–ocean–atmospheric systems.
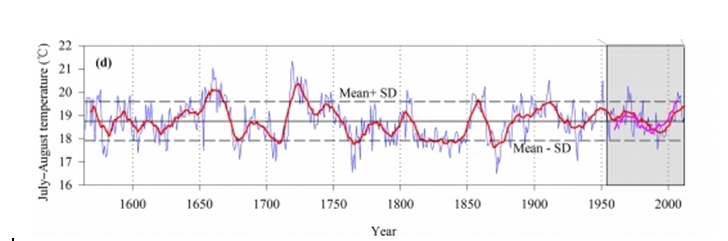
4. Zhu et al., 2016 (China)
A 368-year maximum temperature reconstruction
During the period 1875–1955, late summer temperature fluctuated less strongly than before or thereafter. In general, the average length of cold periods was shorter than that of warm periods. The cold period of 1869–1877 was the longest and coldest cool period had a mean of 17.63°C. The longest warm period extended from 1655 to 1668, and the warmest period in AD 1719–1730 had a mean of 20.37°C. However, we should point out that the rapid warming during the 20th century was not especially obvious in our reconstructed RLST.
[S]even cold periods and three warm periods were identified during the past 368 years (Fig. 4d). All the cold periods were during the Maunder (1708–1711) or Dalton (1818– 1821, 1824–1828, 1832–1836, and 1839–1842) solar minima periods, except for the cold periods of 1765–1769 and 1869–1877 (Eddy, 1976; Shindell et al., 1999), which indicated that RLST [mean maximum temperature] variations in the NWSP [northwestern Sichuan Plateau, China ] might be driven by solar activity (Fig. 7b). On the other hand, volcanic eruptions in the corresponding periods might also be a cooling factor (Fig. 7b). A longer cold period (e.g., 1820s–1840s) was interrupted by transient warming, thus forming a plurality of discontinuous short cold periods. Warm periods of 1719–1730 and 1858–1859 both had more sunspots (Eddy, 1976; Shindell et al., 1999) and lower volcanic forcing (Fig. 7b). The cold (1765–1769 or 1869–1877) and warm (1655–1668) periods were highly consistent with other studies (Fig. 7).
Possible Forcing Mechanism
Accompanied by significant peaks at 60.2 and 73 years, the continuously periodicities around 49–114 years in our regional temperature reconstruction might tentatively be related to PDO, Atlantic Multidecadal Oscillation (AMO; En- field et al., 2001) as well as solar activity (Eddy, 1976; Shindell et al., 1999; Peristykh and Damon, 2003; Raspopov et al., 2004; Braun et al., 2005). The AMO was an important driver of multidecadal variations in summer climate not only in North America and western Europe (Kerr, 2000; Sutton and Hodson, 2005) but also in the East Asia (Feng and Hu, 2008; Liang et al., 2008; Wang et al., 2011, 2015; Zhu et al., 2011). The 60.2-year peak associated with AMO demonstrated that multidecadal variations in late summer temperature in the NWSP NWSP [northwestern Sichuan Plateau, China] might be controlled by AMO.
[S]ignificant multidecadal- and centennial-scale cycles of our temperature reconstruction might include the signs of solar activity, such as the Gleissberg cycles (Peristykh and Damon, 2003), Suess cycles (Braun et al., 2005), Bruckner cycles (Raspopov et al., 2004), and Schwabe cycles (Braun et al., 2005). The Maunder (ca. AD 1645–1715) and Dalton (ca. AD 1790–1840) solar minima periods were generally associated with temperature depressions (Eddy, 1976), and the Damon (ca. AD 1890– 1920) solar maximum period occurred in a relatively warm period, which further confirmed that late summer temperature variation in the NWSP [northwestern Sichuan Plateau, China] might be driven by solar activity (Fig. 7b).
Conclusion: Overall, the RLST [mean maximum temperature] variability in the NWSP [northwestern Sichuan Plateau, China ] might be associated with global land–sea atmospheric circulation (e.g., ENSO, PDO, or AMO) as well as solar and volcanic forcing.


I find it particularly enlightening to look at the weather changes over the turbulent period 1700 to about 1760 in Europe.
A period when huge storms (1703, 1705) lashed the area, followed by periods of major cooling (1708-1709) followed by major floods, and in 1717 more storms (24th/25th December(NS): According to Hubert Lamb, this was ‘one of the greatest
historically recorded storm disasters on the coasts of the North Sea in terms of loss of life – possibly since the beginning of major dyke building.’ About 11 000 people are reported to have died, with the death toll especially high in Germany).
Up to 1739 periods of extreme drought and major floods and extended periods of very high heat with long droughts, this ended in 1739/40 with one of the worst winters experience in Europe.
However by the end of 1741 saw large areas of Europe gripped by a major heat and drought again. And on it goes with more droughts, floods, freezes… A four year drought is also recorded in Europe…
Imagine living then! In just one lifetime records made for flood, freezing, drought, storm deaths all through Europe.
And this was just natural variations albeit at the extreme. All this happened when CO2 levels where below the present levels so climate was supposed to be so much more predictable. Ha!
Yes one or two volcanoes may have erupted during that time but that only serves to show how miniscule mankind is when compared to the might of nature.
Better to look at the CET record for that.
http://zfacts.com/metaPage/lib/zFacts-Central-England-Temperatures.gif
http://www.newclimatemodel.com/the-real-link-between-solar-energy-ocean-cycles-and-global-temperature/
May 21st 2008
Better late than never, guys. 🙂
Warmunist academia demands HRC be president or the planet gets it.
http://www.breitbart.com/london/2016/09/22/climate-alarmist-professors-vote-hillary-or-the-planet-will-fry/
I would like to tell you of my latest book, “Human Caused Global Warming”.
The Biggest Deception in History.
Available on ‘Amazon.ca’ and ‘Indigo/Chapters’.
Trial date for Dr Michael Mann vs Dr Tim Ball, February 20th, 2017.
http://www.drtimball.com
Well, I went to the website, and just watched this first video in the series, and it’s wonderful!
https://www.youtube.com/watch?v=umhHUUWW6Gw
The interviewer is asking excellent questions, enabling Dr. Ball to give answers containing information I’ve not heard before. I can’t wait to watch the rest of them.
Sweet stuff!
[…] other papers link climatic changes to, get this, the sun and natural variability. The science just keeps coming out and showing that Warmists are […]
Not directly on topic but wanted to give the feedback: A big thank you for your continuous drive for science against “garbage consensus-science”.
I refer here in specific the nutrition posts, like the one I link below, helped a good friend of mine to lose 20 kilograms, very naturally, easy, since having read and understood the high-fat diet:
https://notrickszone.com/2016/01/31/how-the-high-fat-low-carb-diet-dropped-my-weight-and-triglyceride-level/
She is now much happier and healthier. Thank you again!
Great to hear – thanks! 🙂
“In fact, these papers each document that temperatures during some periods of the 1700s and/or 1800s were just as warm or warmer than present temperatures.”
Just the other day, someone mentioned that they’d never seen temps this hot (here in Los Angeles – well he was working on his roof to be sure, but). I’d just noticed the record high for the day, on the weather page for the paper. Pulled up a few more for the week.
17-Sep 108 (1913)
18-Sep 103 (1939)
19-Sep 104 (1939)
20-Sep 107 (1939)
21-Sep 108 (1885)
22-Sep 104 (1883)
[…] Papers Link Solar Activity, Natural Ocean Cycles To Climate, Warmer Temps During 1700s/1800s [link]… […]
[…] Fonte: notrickszone […]
This is what happens when politics trumps science.
There is a right answer. Likely somewhere between the two extremes.
True scientist (ie. apolitical and not searching out the latest research grant) would find it. True scientists, like true leaders, are becoming more and more difficult to find.
[…] Energy from the sun is cyclic. As energy inflow increases, massive amounts of energy are moved via atmospheric phenomena, and even more via ocean currents and ocean oscillations. As solar inflow declines, ocean oscillations reverse, currents alter, more clouds form, and natural global climate cycles become more susceptible to long term orbital cycles, including Milankovitch cycles (among others) — often leading to widespread glaciation. […]
An undiscussed topic in solar connections with climate is that neutrinos are NOT EXACTLY transparent to the somewhat radioactive material comprising the Earth. Until shown truly negligible, it is necessary to admit the possibility that solar neutrino emissions induce radioactive decay within the Earth itself.
The heat from radioactive decay within the earth can induce volcanic eruptions. It is already established that volcanic eruptions significantly influence the climate.
There is much we neither know nor have considered.