Dr. Thomas Karl recently retired as Director of the National Oceanic and Atmospheric Administration (NOAA).
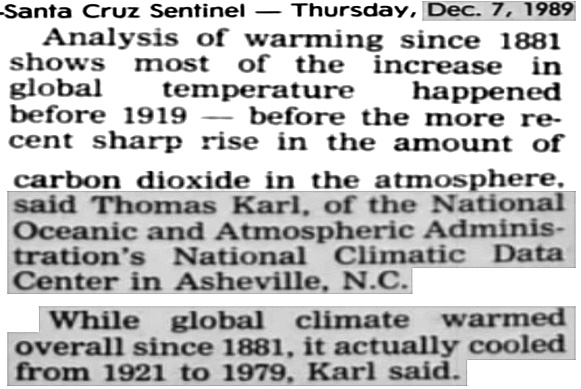
In 1989, Karl’s stated position was that global temperatures cooled between 1921 and 1979.
Source: RealClimateScience
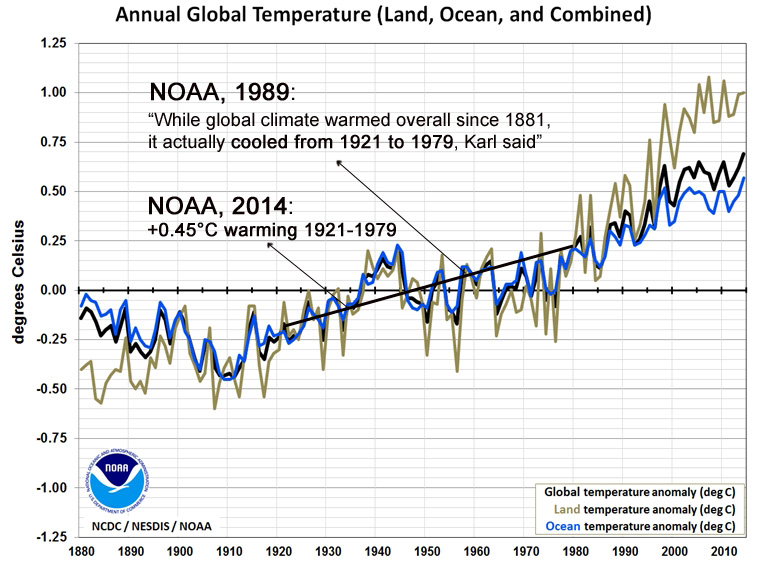
“Analysis of warming since 1881 shows most of the increase in global temperature happened before 1919 – before the more recent sharp rise in the amount of carbon dioxide in the atmosphere, said Thomas Karl of the National Oceanic and Atmospheric Administration’s National Climatic Data Center in Asheville, N.C. While global climate warmed overall since 1881, it actually cooled from 1921 to 1979, Karl said.”
Today, not only has the 1921-1979 cooling disappeared from NOAA’s official temperature record, it has been replaced by a +0.45°C warming trend during that nearly 60-year period.
1. Early NOAA Graphs Confirm Strong Cooling Through The 1970s – Before It Was Removed
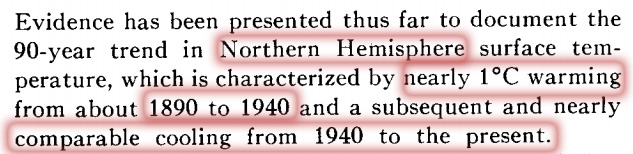
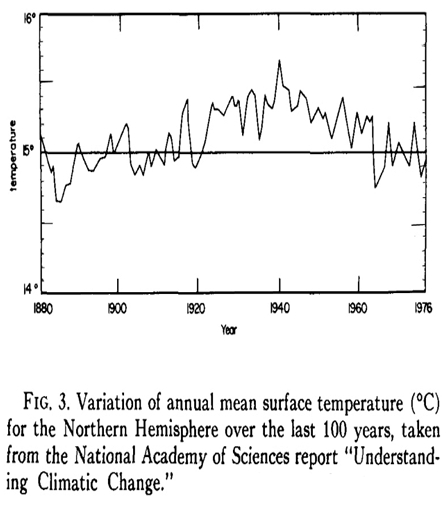
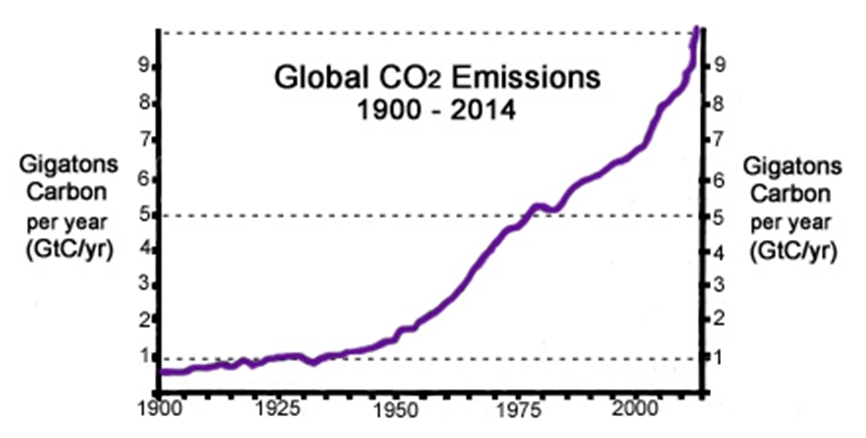
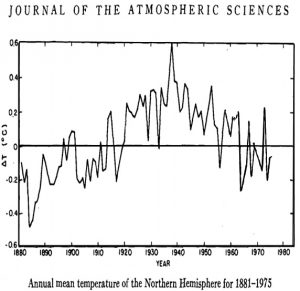
As recently as the early 1980s, it was still widely accepted in the scientific community (National Academy of Sciences, hundreds of scientific papers) that the Northern Hemisphere had undergone a dramatic warming of nearly 1°C from about 1900 to 1940, and then, after the 1940s, the trend reversed to severe cooling, fomenting the 1970s global cooling scare.
Agee, 1980
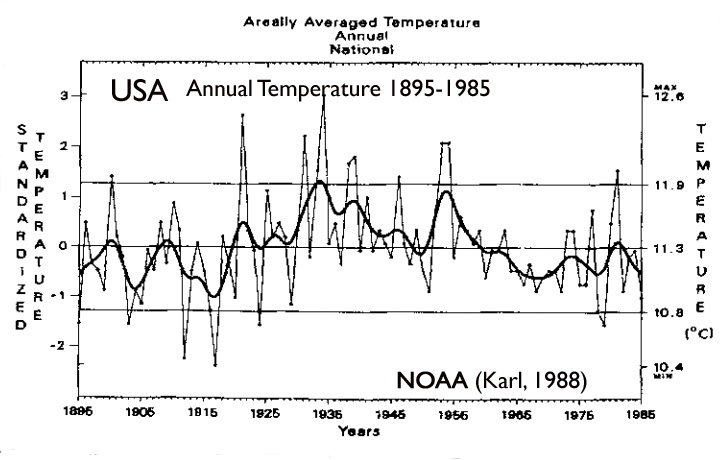
NOAA’s Karl had also supplied plenty of evidence to support the original (1989) position that a global cooling trend persisted through the late 1970s. Graphs appeared in his papers with strong warming trends through the 1920s and 1930s and then cooling trends from the 1940s to the 1970s. For example, the NOAA graph of U.S. annual temperatures showed the cooling trend from 1921-1979, and even indicated there had been no net warming in the U.S. in the 90 years between 1895 and 1985.
Karl, 1988
U.S.A. (Annual Average)
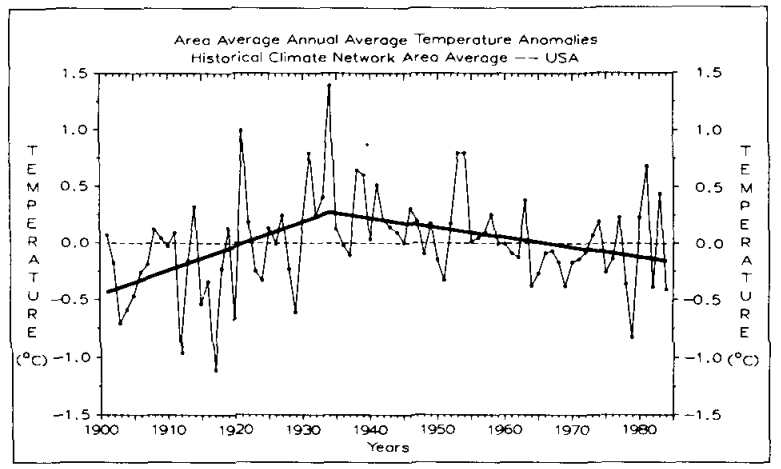
Compare the graph above to the one below. By starting their trend in 1901 rather than 1895 (as above from Karl, 1988), Karl and Jones (1989) could claim there was a net temperature increase of 0.16°C during the 20th century, or as of 1901-’84. All of the 84-year warming occurred prior to the 1940s, and it only warmed overall because the post-1940s cooling didn’t quite eclipse the pre-1940s warming when the trend line started six years later (1901 vs. 1895). The end point of the second trend (1984) is apparently 0.16°C warmer than where the first trend line began (1901).
Karl and Jones, 1989
“Temperature trends indicate an increasing temperature from the turn of the century to the 1930s but a decrease thereafter.”
“Over the twentieth century (1901-84) … the overall temperature trend in the United States during this time period, +0.16°C/84 yr.”
U.S.A. (Annual Average)
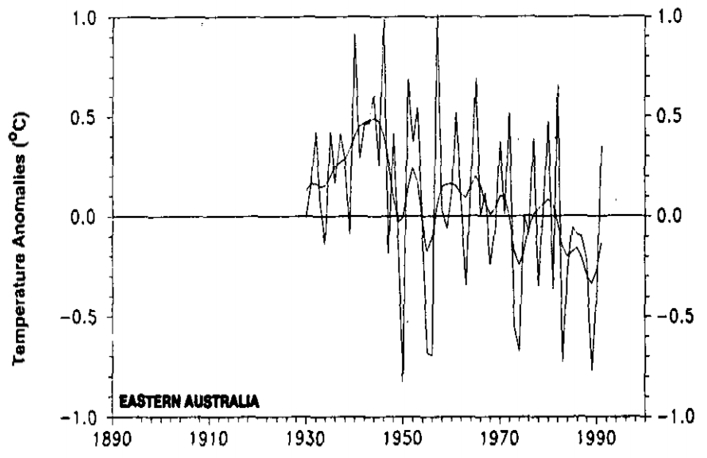
Eastern Australia
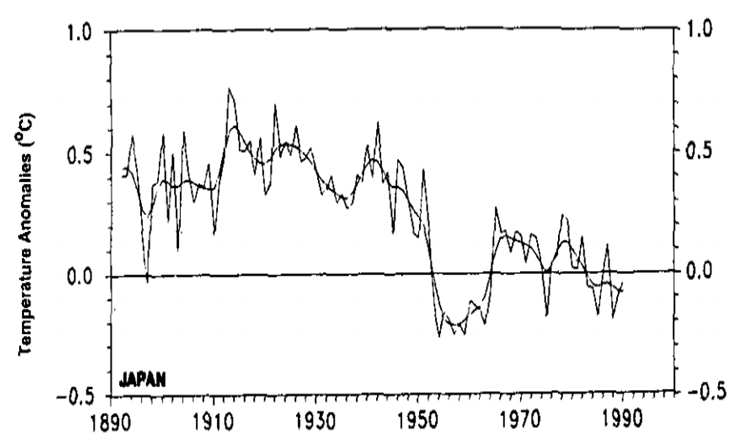
Japan
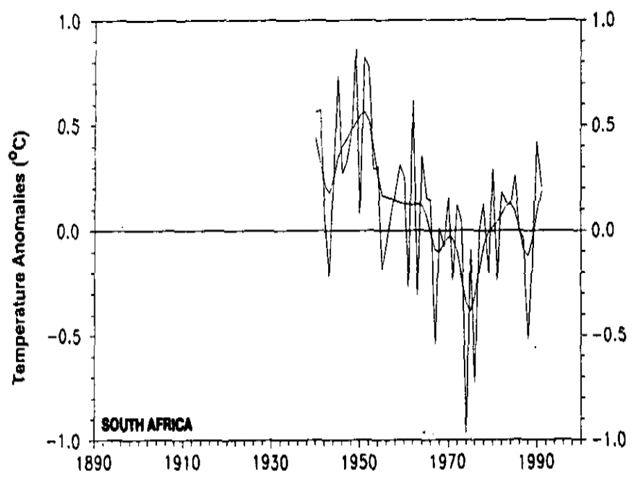
South Africa
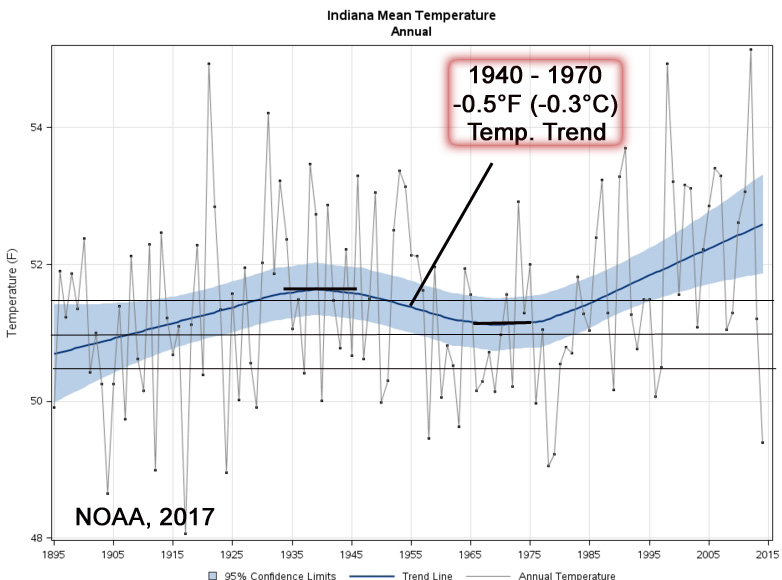
2. Case Example: NOAA Removes Strong Post-1940s Cooling Trend For Indiana (U.S.A.)
Like the hemispheric trend, this dramatic warming and cooling trajectory was found in the temperature record for much of the United States — before it was removed. For example, Karl (NOAA) produced a graph showing there was a cooling of multiple degrees (°C) from the 1930s-1950s to the 1960s-1970s in central Indiana. In fact, highest to lowest yearly anomalies reached more than 10°C, a warming-cooling separation of 18°F between the 1931 anomalous warmth and the mid-1970s cooling .
Karl and Riebsame, 1984

Today, NOAA has eliminated the multiple degrees of warming and cooling for Indiana, almost completely flattening out the earlier steep warming and cooling trends.
3. NOAA (1988, 1989): Artificial Heat From Urbanization Accounts For All 20th Century Warming
During the late 1980s and early 1990s, Karl was the lead author or co-author of several papers that affirmed urban temperature bias (locating temperature measuring stations near asphalt, buildings, airports, machinery, etc.) had compromised the U.S. temperature record and produced a substantial artificial warming. The artificial warming bias identified in the temperature record was found to be larger than the overall temperature trend itself. In other words, according to NOAA, all or nearly all the U.S. 20th century warming (through the mid-1980s) could be attributed to artificial (non-climatic) heating due to the effects of urbanization.
Karl and Quayle, 1988
“Karl et al., 1988) has shown that at some ‘sun belt’ cities in the West, the rise of temperature that can be attributed to the urban heat island is as much as 0.3 to 0.4°C per decade. In the East, the rise is over 0.1°C per decade. … The artificial warming in the primary station network, relative to the climate division data, is nearly 0.17°C over the past 34 years [since ~1950]. Such trends are at least as large as any of the observed trends over the United States (Karl, 1988) or the globe (Jones and Wigley, 1987).”
Karl and Jones, 1989
“Results indicate that in the United States the two global land-based temperature data sets have an urban bias between +0.1°C and +0.4°C over the twentieth century (1901-84). This bias is as large or larger than the overall temperature trend in the United States during this time period, +0.16°C/84 yr.”
At present, only rough estimates of the potential impacts of urbanization can be given. This includes an urban bias in the Hansen and Lebedeff (1987) [NASA] data over the United States between 0.3°C and 0.4°C over the 20th century, which is larger than the overall trend in the United States over this period. … To our knowledge, the United States is the only large area of the globe where the magnitude of this bias has been thoroughly studied.”
“The magnitude of this urban bias in two global, land-based data sets was found to be a substantial portion of the overall trend of global and regional temperatures.”
“Rapid increases in urbanization can lead to [warming] biases in the annual mean temperature at urban locations of over 1°C (Karl et al., 1988; Karl and Jones, 1989).”
Kukla, Gavin, and Karl, 1986
“Meteorological stations located in an urban environment in North America warmed between 1941 and 1980, compared to the countryside, at an average rate of about 0.12°C per decade. Secular trends of surface air temperature computed predominantly from [urban] station data are likely to have a serious warm bias. … [W]e compared trends of the 34 urban/rural station pairs…urban stations show a warming with respect to the countryside throughout most of the year. The average annual difference of the trends is about +0.11°C per decade [of non-climatic warming due to urban location]. … The average difference between trends [urban siting vs. rural] amounts to an annual warming rate of 0.34°C/decade. Values from May through August averaged 0.44°C/decade while December showed the smallest difference. The reason why the warming rate in subset D is considerably higher [may be] that the rate may have increased after the 1950s, commensurate with the large recent growth in and around airports. … Our results and those of others show that the urban growth inhomogeneity is serious and must be taken into account when assessing the reliability of temperature records.”
4. NOAA (1989): Early Instrumental Records Have Up To 1°C Biases, Non-Uniform Calibration Standards
Karl et al., 1989
“Calibration errors are serious problems with early temperature records, some dating back to the seventeenth and 18th century. Early thermometers consisted of a U tube with one open end and required pressure corrections. Varying temperature measurement scales and instrument shelters were used. Readings from these instruments are often difficult to interpret. Temperature measurements over the last 100-140 years have been refined so that the accuracy and the precision of the measurement is at least [within] 0.5°C.”
“Changes in observing schedules and practices have been shown to produce biases in the mean temperature of up to 1°C (Bigelow, 1909; Schaal and Dale, 1977; Karl et al., 1986). Even today, there is not an international standard for the calculation of mean daily temperature, and archived data often include averages based on different formulae for calculating monthly means.”
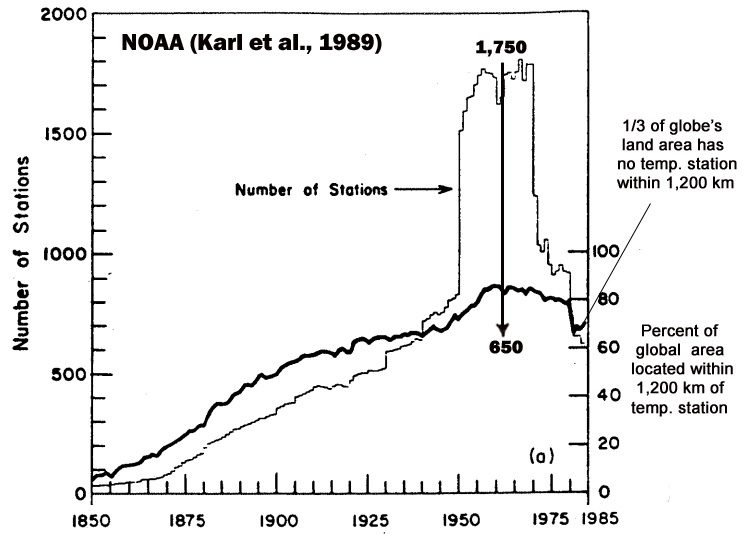
5. NOAA (1989): Poor Coverage In Our Land Data – 1/3rd Of Land Area Has No Thermometer Within 1,200 Kilometers
Karl et al., 1989
“[There was] a large increase in [temperature measuring] stations from the late nineteenth century to the 1960s and a subsequent decline after the 1960s.”
6. NOAA (1989): ‘Uncomfortable Level Of Uncertainty’ In Our Sea Temperature Data – Poor Coverage, Large Measurement Biases
Karl et al., 1989
“[T]here are large geographic areas of the oceans which have not been adequately sampled, and even today, only two thirds of the global oceans are sampled in NOAA’s Comprehensive Ocean-Atmosphere Data Set (COADS). The tropical areas of the Pacific Ocean have few observations until the 1950s, and oceanic regions poleward of 40°S (which account for 15% of the world surface area) have few observations available until recent decades. Even when observations are available for an individual grid box, there may be only one or two values for a given month, and adjustments may be required to convert the value to a midmonth or midarea equivalent. … [T]he poor spatial coverage in the tropical Pacific and southern oceans adds an uncomfortable level of uncertainty regarding long-term (50-100 years) changes of ocean temperatures.”
“For marine air temperatures, biases exist for a variety of reasons. Ships have become larger over the years, and the height of the deck above sea level has increased. As ships have become larger, their absorption of insolation has increased and caused a [warm] bias with respect to daytime observations of marine air temperature.”
“For sea surface temperature measurement, biases are known to be caused by changes in the vessel used to hold the seawater in which the temperature is measured. Wooden buckets, metal buckets, canvas buckets, and intake tubes for engine cooling have all been used to measure sea surface temperature since the midnineteenth century. … The magnitude of the warm bias [in measuring sea temperatures] obtained using the modeling approach is similar to that obtained by comparison with the nighttime marine air temperatures (several tenths of a degree Celsius). Differences among the types of buckets (for which the timing is uncertain) can translate into an uncorrected or uncorrectable bias of 0.1°C-0.2°C in the sea surface temperatures over the past century.”
“Oceanic measurements of sea temperature (i.e., data from research cruises) are … very poorly distributed for long-term global studies. … In summary, with so few long-term observations of temperature over the oceans, particularly in the southern hemisphere, and the differing measurement practices, global and hemispheric time series extending into the nineteenth century should be used circumspectly.”
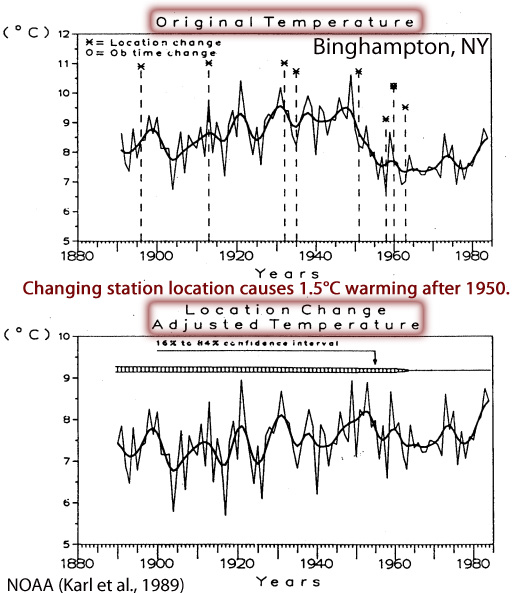
7. NOAA (1989): Surface Temperatures Can Be Raised Artificially By Moving/Eliminating Stations From Rural Locations
Karl et al., 1989
“Changes in station location, instruments, instrument shelters, and the height of instruments above the ground have led to biases of 1°C or more at many stations (Karl and Williams, 1987).”
8. NOAA (2012): To Be Reliable (‘Fact’), NOAA Temperature Records Should Be ‘Same’ As Satellite Records
Prior to the publication of his highly criticized 2015 paper that made the the nearly two-decade-long pause in global temperatures ‘disappear’ (by adjusting sea surface temperature data – cooling the past and warming the present), NOAA’s Karl was quoted saying (2012) that NOAA’s surface temperature trends should show the “same kind of a trend” as satellite temperatures do. The agreement between NOAA surface instrumental data and satellite data would indicate that the temperature trend is fact, and not an assertion (his word choices).
However, with the adjustments to the data, the satellite records do not show the “same kind of a trend” as the NASA (NOAA) records do:
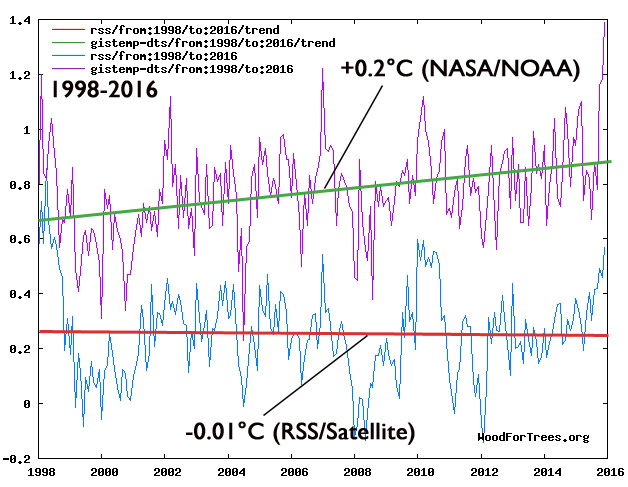
Source: WoodForTrees
9. NOAA (1989): Comprehensive Coverage From Satellites ‘Striking’ – Will Likely Be Our Main Temperature Data Source
Back in 1989, NOAA’s Karl asserted that satellite data would soon be the “primary source” for climate change monitoring due to the “striking” coverage (85% of the Earth’s surface, observations every 30 minutes) satellites provide relative to the thermometric record. In fact, he concluded that the eventual “marriage” of land data from temperature stations with satellite data would make the overall temperature record much more reliable.
Karl et al., 1989
“[S]pecial data sets from experiments and research projects are becoming available to climate researchers. Some special data sets are also available from research satellites (such as the NOAA satellites) are likely to be the primary source of long-term data for monitoring climate change. The operational satellite data record is now long enough to consider the statistical evaluation of changes of various climate variables.”
“Compared to ground-based data, the most striking characteristic of satellite data is its comprehensive geographic coverage. … Under normal circumstances, five geostationary satellites provide coverage for about 85% of the Earth’s surface. … The geostationary satellites make routine observations every 30 min and are capable of scanning limited latitude bands at shorter intervals.”
“The marriage of space-based satellite observations with traditional surface-based observations with traditional surface-based observations offers the potential to significantly reduce our uncertainties in the climate record.”
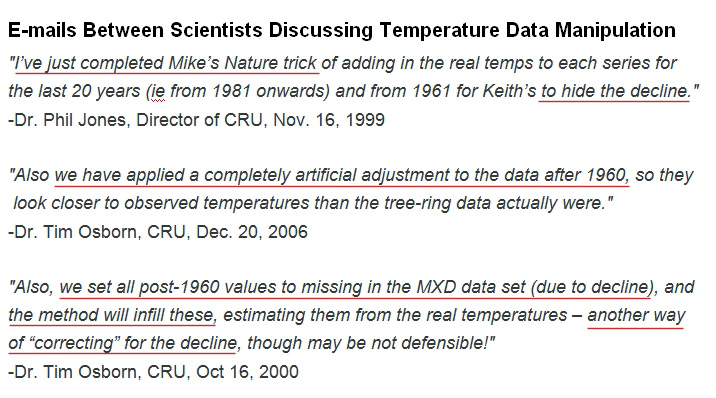
10. How They Do It: NOAA In-Fills Unmeasured Land (And Sea) Regions With Made-Up Temperatures
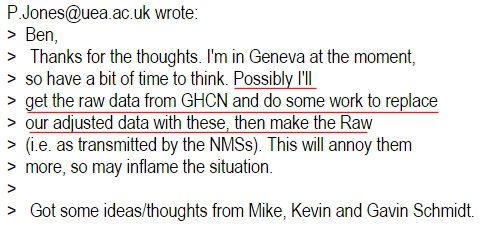
The exposed “Climategate” e-mails from overseers of surface temperature data (for example, Phil Jones of the Climate Research Unit) have authentically established that there is a history of scientists making up data and “correcting” cooling temperatures (the “decline”) to satisfy an agenda. The e-mails reveal that scientists are not above artificially removing “the 1940s blip” (that showed too much warming to be compatible with models) or the post-1960s trend (cooling, the “decline”) and making up their own “raw” temperatures when they can. Here are a few sample excerpts from the purloined exchanges.

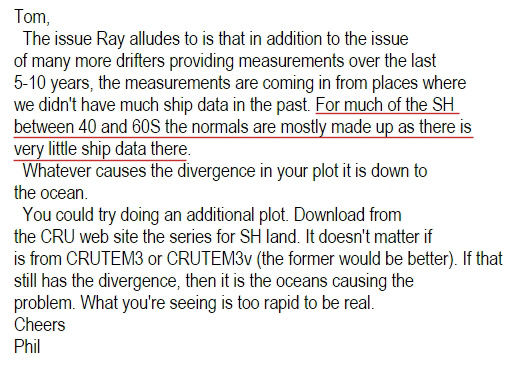
Because the temperature data coverage is so exiguous (i.e., Southern Hemisphere ocean temperatures are “mostly made up”), NOAA has to in-fill the vast non-measured land regions (that contain no thermometers) across the globe with their own numbers derived from modeling.
And because modeling presumes that anthropogenic CO2 emissions drive temperatures, and emissions have exploded since the mid-1940s, there is a modeling bias to cool down the 1920s to 1940s warmth, heat up the 1940s to 1970s cooling trend, and exaggerate the most recent warming. This way, the overall trend will look more and more like the linear emissions post-1940s “hockey stick” trend, and less like the undulating pattern that was scientifically acceptable until the 1980s.
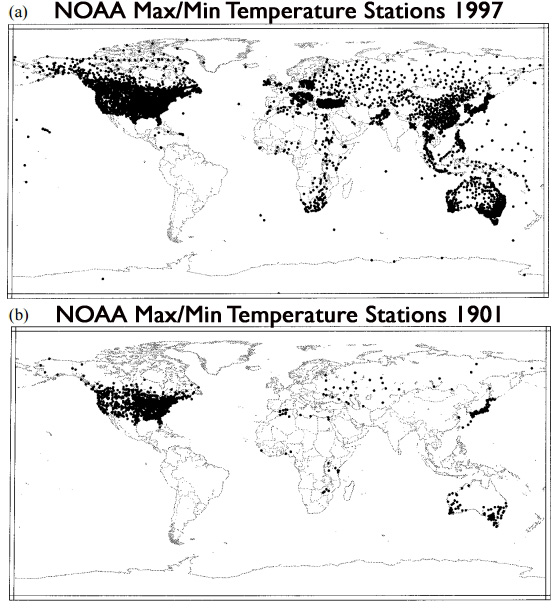
The land area with adequate temperature records available (containing both maximum and minimum uniform daily temperatures) is still woefully absent in regions such as Greenland, Antarctica, Africa, South America, Central America, and most of Asia, Canada, and Scandinavia. The only regions with good coverage are the U.S., Europe, Australia, and China. This doesn’t even include the dearth of coverage for the ocean surfaces, which is even worse.
In a NCDC/NOAA analysis by Peterson and Vose (1997), it was revealed that raw data with the uniform maximum/minimum daily temperatures available from the Global Historical Climatology Network have improved in the last century, but not enough to provide confidence in available global-scale records.
Peterson and Vose, 1997 (NCDC/NOAA)
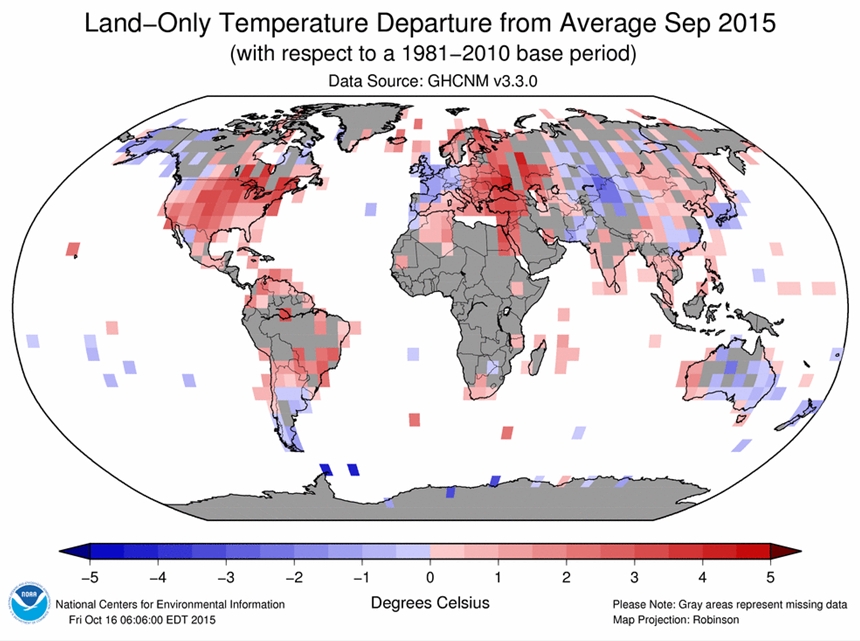
Indeed, NOAA’s lack of adequate observational land coverage – real temperature measurements – is illustrated below. The gray areas effectively contain no thermometric record, meaning the temperatures in those regions must be made up. Keep in mind that the red-blue colored squares used to represent real measurements tend to exaggerate the coverage, as the square sizes depict a larger range of coverage than actual.
Conclusion
The global temperature dataset available from NOAA suffers from massive and uncorrected warm biases (as preferred by its purveyors), woefully inadequate contemporary measurement coverage, and even worse historical coverage (with inherently non-uniform data collection methodologies). Consequently, a substantial portion of the temperature data available from NOAA should be regarded as artificial and untrustworthy. Those who faithfully uphold NOAA’s global temperature dataset as “truth” will need to address its demonstrable speciousness – and why they are inclined to believe in it anyway.


[…] Robust Evidence NOAA Temperature Data Hopelessly Corrupted By Warming Bias, Manipulation. Dr. Thomas Karl recently retired as Director of the National Oceanic and Atmospheric Administration (NOAA). In 1989, Karl’s stated position was that global temperatures cooled between 1921 and 1979. Source: RealClimateScience “Analysis of warming since 1881 shows most of the increase in global temperature happened before 1919 – before the more recent sharp rise in the amount of carbon dioxide in the atmosphere, said Thomas Karl of the National Oceanic and Atmospheric Administration’s National Climatic Data Center in Asheville, N.C. […]
The phrase is: “Fake temperature”.
Just trying to get my head around the fact that where land measurements were insufficient the ‘scientists’ used modeled data to infill based on output from computer models programmed to show MMGW. How elegantly bloody circular! Prove that Man-made CO2 is causing global warming by producing data that was generated from a system that was designed to deliver Global Warming!
#fakescience
The Karl et al 1989 link timed out (access denied).
Regarding point 7: According to NOAA the time of measurement also changed from recording the temperature in the afternoon to recording it in the morning. Older recordings are “too warm” to be directly comparable and thus get adjusted down like illustrated in the chart you included.
Regarding point 8: Just cover a greater timespan … http://www.woodfortrees.org/plot/rss/from:1980/to:2017/trend/plot/gistemp-dts/from:1980/to:2017/trend/plot/rss/from:1980/to:2017/plot/gistemp-dts/from:1980/to:2017 the RSS satellite is measuring the troposphere, isn’t it?
Regarding point 10: I assume you know what is meant by “decline” and what the actual “Mike’s trick” is? It’s not about fixing the instrumental temperature data, it’s about aligning the tree ring proxies with reality. A similar problem as with the Antarctica records (you posted a few days ago in a 17 papers overview) that didn’t match instrumental data, so they displayed the data together with detrended instrumental data. “Hiding the decline” in this case is the exact opposite procedure to match proxies with real temperatures.
NOAA is actually very open about their procedure to adjust different sets of data so they can be used as a continous temperature record. Are there some obvious flaws? If so, they’d gladly here from you I suppose. https://www.ncdc.noaa.gov/monitoring-references/faq/temperature-monitoring.php
The fact that you regard NOAA/NASA temperatures as “reality” or “real” just goes to confirm that you are unwilling to seriously consider evidence that may undermine your beliefs. There is quite a bit of evidence to suggest that no true skeptic would consider NOAA’s data “real” – especially since they in-fill most of land data with biased-warm modeling rather than actual observations, and 1/3rd of the ocean wasn’t even sampled prior to the 1990s. And their data before the 1970s is hopelessly adjusted and compromised by coverage and calibration deficiencies. Apparently none of this matters to you…as long as the result confirms your biases. Do you consider yourself a skeptic? Because you behave like a believer.
I’m still rather disappointed that you have been caught fabricating (see the 17 non-hockey sticks comment thread) about what the temperature graph for Antarctica showed and yet you still have not owned up to it. I thought you were better than that.
So what you are saying is that it is impossible to know the exact temperatures everywhere on the planet for the time before the 1990s? If that is the case how can you tell that the “real” temperatures were different?
The point I was making about the “fixing” was that they aligned their proxy data to instrumental data. In case of tree rings there should be an overlap with reliable (you claim the 1990s as starting point) temperature data, right?
About the Antarctica graph: I believe I replied to that thread, maybe it was lost in moderation. The paragraph before the figure in question explains what can be seen in those graphs. The ozone concentration wasn’t randomly included in the graph. I think I even quoted the paragraph …
I’d suggest the satellite data, due to their far more extensive coverage and precision (and lack of affiliation with artificial biases like urbanization) are far more likely to be closer to “reality” than the hopelessly corrupted instrumental record with woefully inadequate coverage, urban biases, and artificial in-filling. And the satellite record only extends back to 1979. So yes, it is impossible to know the “exact temperatures everywhere” due to uncertainties, errors, and biases intrinsic to all datasets. NOAA’s datasets are in-filled with made-up (modeled) data rather than observations. And they’ve changed the raw data from the past to comply with modeling, making sharp cooling disappear and replacing it with warming. I am not a believer in your version of accepted “reality”.
Yes, and the instrumental data has, to a substantial degree, been made up. The proxy record showed cooling (or no warming). So did many of the instruments. So they removed the instrumental stations from rural areas after the 1960s (see graph above), kept the urban sites (that had artificial warming trends of +0.1 to +0.3 C per decade and more), and they could therefore erase the sharp 1960s and 1970s cooling (which they had been getting away with because the satellites weren’t operating yet). That’s why their “hide the decline” replace-proxies-with-made-up-instrumentals trend begins around 1960. They also erased much of the “1940s blip”, which showed significant warming that matched or exceeded that of recent decades — since that didn’t conform to models. It’s a made-up record.
———————————————————————————————————————
Yes, you replied regarding the Antarctica graph…by making up a rather feeble explanation for why you falsely claimed the graph showed something it did not (greenhouse gases = O3). You may want to take another look at your embarrassing exposure in the comments here:
https://notrickszone.com/2017/01/26/17-new-2017-scientific-papers-affirm-todays-warming-is-not-global-unprecedented-or-remarkable/
“So you’re basing your fabrication on the placement of the paragraph in relation to the graph…rather than honestly representing what the authors themselves wrote that the graph depicts? SebastianH, just because a graph is located in close proximity to an appealing sentence that you find supports your beliefs about ‘greenhouse gases’ does not mean you get to fabricate a claim that that is what the graph is actually depicting…and then falsely accuse others of deception.”
If a paragraph specifically mentions a figure than the paragraph is about that figure. Ozone is a greenhouse gas.
Uh, no. Here is a quick summary of what the words “Dobson Units” refer to on the side of the graph (which I insidiously removed), and why the word “column” follows the word ozone. Notice there is no mention of the “greenhouse gas” characteristics of ozone in this description of what that graph’s blue line actually depicted. Obviously, in your myopic attempt to find something – anything – you could “prove” that this graph showed humans cause temperature (the ozone column is not caused by humans, Sebastian), and that I was trying to “sneak” this robust correlation between ozone column/Dobson Units and temperature past readers, you have exposed your ignorance (and your willfulness to fabricate so as to attack my integrity).
https://www.esrl.noaa.gov/gmd/ozwv/dobson/papers/wmobro/ozone.html
Total ozone is defined as being equal to the amount of ozone contained in a vertical column of base 1 cm2 at standard pressure and temperature. It can be expressed in units of pressure, typically about 0.3 atmosphere centimetres. The milli- atmosphere centimetre — m atm. cm (commonly called the Dobson Unit corresponding to an average atmospheric concentration of approximately one part per billion by volume (1 ppbv) of ozone, is most frequently used. Ozone is not distributed uniformly through the vertical column. The world average is about 300 units, it varies geographically from about 230 to 500 Dobson Units. Total column ozone has, on average, its lowest values over the equatorial belt and increases with latitude.
Instead of making up what you think the graph shows (because that’s what you tendentiously hope it does), why not just read the actual graph description? And why, in an article about temperature non-hockey sticks, do you think it was “deceptive” of me to remove an overlayed trend line showing ozone Dobson Units trend line (that doesn’t even look like it correlates well with the temperature trend anyway)? What was wrong with removing “Dobson Units” from a temperature graph? And why did you characterize the Rydval graphs of NH reconstructions as “unnecessarily” photoshopped – as if to accuse me, once again, of doing something deceptive? What was “unnecessary” there?
I don’t take these false accusations lightly.
“I don’t take these false accusations lightly.” – Kenneth Richard
Sadly, our new resident troll, SebH, does.
I do understand what you wanted to show with that chart (Fig. 14 in this paper: http://www.sciencedirect.com/science/article/pii/S0277379116305479). Looks like no warming is happening in Antarctica, it just has a high bandwidth of variation.
Please read at least chapter 5.2 of the linked paper and then come back and convince me that the author is implying that Antarctica displays no signs of climate change. They specifically mention the role of ozone.
There is nothing wrong with removing something from a graph that you deem unimportant. It’s just deceptive to post such a graph that clearly has a different context than you think it has. It is just a list of temperatures, but it is not a standalone picture without text surrounding it. The author describes five analogs which depend on the full graph (including wind speed which you also removed) …
You’ve been caught lying again, SebastianH. This is what the original graph looked like:
https://notrickszone.com/wp-content/uploads/2017/01/Antarctica-Cooling-1979-2015.jpg
This is what I removed:
https://notrickszone.com/wp-content/uploads/2017/01/Holocene-Cooling-Antarctica-Circle-Mayewski-17.jpg
Since ozone column/Dobson Units (blue line) are not germane to an article on non-hockey stick temperatures, but temperatures 2 m above the surface (red line) are, I removed the blue line and references to ozone column/Dobson Units so as not to complicate matters for the casual observer who would otherwise need to look up what the blue vs. red line represents.
Wind speed is not germane to an article on non-hockey stick temperatures. Contrary to your false accusations, the graph in question (first above link) does not contain wind speed. So I didn’t “remove” wind speed. This is another lie. How many more lies are you going to pile on top of the ones you’ve told already, SebastianH?
Where or how did I possibly write that Antarctica “displays no signs of climate change”? The climate has been changing for Antarctica for millions of years, including since 1979. The undulating anomalies are clearly shown on the graph. Stop making up false statements and then claiming I’ve written them.
Yes, ozone clearly affects Antarctic temperatures. But not involving the anthropogenic “greenhouse gas” characteristics that you are imagining. Changes in ozone are predominantly due to “natural variability”, not humans. For example:
—
http://www.nasa.gov/content/goddard/new-results-from-inside-the-ozone-hole
“NASA scientists have revealed the inner workings of the ozone hole that forms annually over Antarctica and found that declining chlorine in the stratosphere has not yet caused a recovery of the ozone hole. …. [T]wo new studies show that signs of recovery are not yet present, and that temperature and winds are still driving any annual changes in ozone hole size.”
—
Hess et al., 2015
http://www.atmos-chem-phys.net/15/2341/2015/acp-15-2341-2015.html
“[A] large portion of the measured change [ozone] is not due to changes in [anthropogenic] emissions, but can be traced to changes in large-scale modes of ozone variability. This emphasizes the difficulty in the attribution of ozone changes, and the importance of natural variability in understanding the trends and variability of ozone.”
—
http://www.atmos-chem-phys.net/11/9563/2011/acp-11-9563-2011.pdf
“The changes in meteorology (not including stratospheric variations) and natural emissions account for 75 % of the total variability of global average surface O3 concentrations. Regionally, annual mean surface O3 concentrations increased by 1.3 and 1.6 ppbv over Europe and North America, respectively, despite the large anthropogenic emission reductions between 1980 and 2005.”
—
Dameris and Pitari, 2005
http://citeseerx.ist.psu.edu/viewdoc/download?doi=10.1.1.588.2367&rep=rep1&type=pdf
“[T]he slightly increased Southern Hemisphere ozone values observed during Antarctic spring time in the late 1990s and the beginning 2000s, do not indicate the beginning recovery of the Antarctic ozone hole. E39/C results show that the small increase of total ozone during that time is mainly caused by the increase in solar activity.”
There is no lie in that statement. You removed parts of a charts to better illustrate your point. Nothing wrong with that and overall a true statement. But you used a chart from a paper that references this very chart while (in some of the analogs) describing future and current warming. No lie in that either.
Regarding ozone and humans. You must have missed who caused the ozone depletion by using CFCs.
If I did “nothing wrong” and issued a “true statement”, then why have you exerted the effort to portray what I did (removed the blue line that didn’t pertain to hockey stick temperatures) as deceptive?
Apparently you missed the part where I quoted from NASA and 3 or 4 other scientific papers that ozone growth and depletion are “natural variability” at work. But you go right on ahead and continue believin’ humans cause the ozone column, SebastianH.
http://www.nasa.gov/content/goddard/new-results-from-inside-the-ozone-hole
NASA scientists have revealed the inner workings of the ozone hole that forms annually over Antarctica and found that declining chlorine in the stratosphere has not yet caused a recovery of the ozone hole. …. [T]wo new studies show that signs of recovery are not yet present, and that temperature and winds are still driving any annual changes in ozone hole size.
The classic metrics create the impression that the ozone hole has improved as a result of the Montreal protocol. In reality, meteorology was responsible for the increased ozone and resulting smaller hole, as ozone-depleting substances that year were still elevated. The study has been submitted to the journal of Atmospheric Chemistry and Physics.
“Ozone holes with smaller areas and a larger total amount of ozone are not necessarily evidence of recovery attributable to the expected chlorine decline,” said Susan Strahan of NASA’s Goddard Space Flight Center in Greenbelt, Md.
“We are still in the period where small changes in chlorine do not affect the area of the ozone hole, which is why it’s too soon to say the ozone hole is recovering,” Strahan said. “We’re going into a period of large variability and there will be bumps in the road before we can identify a clear recovery.”
I ment my statement with the sentence “Nothing wrong with that”. Remember: you said I was lying.
What do you think this means? Did the substances appear by magic? Can the chlorine level decrease without humans stopping to put more CFCs into the air? Humans do not produce ozone, they produced ozone-depleting chemicals.
The ozone hole is problem where mankind understood what had to happen and executed on it. I am sure there were ozone deniers in the 80s and 90s who didn’t believe the science … being one now is just ridiculous.
http://blog.drwile.com/wp-content/uploads/2015/11/ozone1.jpg
As the graph above shows, humans did stop putting more CFCs into the air. And yet the ozone hole is larger now than it was in the 1980s, or when CFCs and other ozone depleting substances (ODS) were still in widespread use. What that tells me is that the ozone hole largely grows and shrinks in phase with natural variability, or for reasons that completely overwhelm an anthropogenic influence. Apparently it tells you that you need to believe humans are primarily responsible for the size of the ozone hole over Antarctica anyway…because you believe just about anything that’s said to you about humans determining atmospheric and climate and weather changes. You’re not the least bit skeptical when it comes to your beliefs about the dominance of human activity in shaping what happens in the oceans, atmosphere, troposphere.
So is NASA an “ozone denier”?
NASA: “We are still in the period where small changes in chlorine [from reductions in CFC use] do not affect the area of the ozone hole”
Since you find it deceptive that I “removed” a graph depicting wind speed in an article on temperatures, what meteorological or atmospheric constituent do you NOT find acceptable to exclude from an article on temperatures? What gaseous substance must I be sure to include in temperature graph compilations to avoid being the recipient of your name-calling (“nutjob”) in the future?
Perhaps you should stop digging, SebastianH.
Kenneth, you (or maybe it was someone else, but it gets mentioned frequently here) believe that CO2 levels lag temperature by up to 800 years in proxy data. And you can’t imagine how ozone levels can lag behind release of CFCs? Chlorine is very stable. It’s not just vanishing because we stopped putting it in the atmosphere. It is still up there and reacts with the ozone.
I didn’t call you a nutjob. You seem to be one of the reasonable skeptics despite your denial of CO2 having a significant greenhouse effect and human caused ozone depletion.
Posting that temperature graph was deceptive, because it wasn’t what the linked paper was about. That was in fact the whole point of my cherry picking in the comment-section of that article.
Your overview didn’t accurately describe the content of those papers. My overview didn’t do that either. Can we now get past this please?
I see. So your claim is that the paper “was about” the ozone column, as determined by human CFC emissions, functioning as a greenhouse gas within the greenhouse effect, and how ozone, the greenhouse gas caused by human CFCs, drives what goes on in Antarctica. Therefore, removing the blue ozone-greenhouse gas trend line from Fig. 14 was “deceptive” because the paper itself was not about Antarctica’s temperatures, climate, warming, cooling, etc.
That’s odd, SebastianH, that you insist Antarctica’s temperature is not what the paper is about because I just took the time to count, and thermal words like warm, cold, heat, climate, and temperature are used over 5 dozen times in the paper itself. So you claim that I am being “deceptive” by including a graph of Antarctica’s temperature in an article about temperatures because the paper itself was not about Antarctic temperatures, but about ozone, the CFC-modulated greenhouse gas. It would appear, SebastianH, that you are not telling the truth again, because the paper does indeed reference Antarctica’s temperature quite prominently.
How much longer will you continue to dig, SebastianH? I do not take the false accusation of deception lightly — especially coming from someone with your established track record.
“…you can’t imagine how ozone levels can lag behind release of CFCs?” – SebH
No, I can’t. Why don’t you explain? They are different processes with different mechanisms. One involves solubility differences of CO2 between cold and warm water, and the other involves free radical mediated chemical reactions. Why would anyone assume they could be compared in the childishly simplistic way you suggest>
‘it’s about aligning the tree ring proxies with reality’. No, it is about aligning the proxy data with the instrumental surface data. We never know reality beyond our measurements. The decline concerned the proxy data showing declining temperatures, whereas the surface record showed increasing temperatures. This was called the divergence problem. Two stories, contradicting each other, cannot both be true. It is possible therefore that the proxy data were correct and the surface data not. Hiding the decline was cutting the declining proxy part out and pasting the surface part in. This was the Nature trick. If you want to write a new academic history, be careful with the word ‘reality’.
Thank you for the explanation. Do we now know what data was/is correct? Are we measuring temperature incorrectly? Is there a problem with determining temperature from tree rings?
Tree rings respond far more to water fluctuations, and especially CO2. The original data Mann used was actually done for CO2 levels, not temperature, which trees are actually very bad for.
But that didn’t stop him, because he was on commission to get rid of the MWP.
Why is the “tree ring proxies are the better indicator of temperature variations/trends” argument then even used here?
It seems that seb skipped biology in junior high, as well as maths, science and anything else requiring actual learning.
@SebH
Many factors affect tree growth. CO2 is one.
http://icecap.us/images/uploads/Greenhouse_Gases.jpg
The elevation at which the tree grows is also important. Trees get shorter and shorter with height up a mountain, until the “tree line” is reached, above which they cannot grow at all.
Ground moisture and fertility are two more. And then there’s day length, cloud cover, pH of the soil, along with diseases and insect infestations.
And then there are cosmic rays?!
http://news.bbc.co.uk/earth/hi/earth_news/newsid_8311000/8311373.stm
Careful. When someone tells you their proxy gives information about temperature, always ask “what else?” and “how much?” Also, best if you check for yourself if their answers hold up to scrutiny, at least until you know you can trust them – but then, still check periodically, just in case.
When I wrote my comment on 10.28 PM, Richard’s may have been in moderation as we made the same point. ‘Not both of them true’ means one of them false or both false (the most probable). We never know whether something is true. Take twenty clocks, nineteen telling it is 10.28 PM, and one 10.50 PM. Is 10.28 PM the true time? Think about the possibility that nineteen witnesses testify that you arrived 10.28 PM at the place where a murder was committed at 10.30 PM and one that you arrived there at 10.50 PM. I bet that you would believe the latter.
So every temperature on record (measured or by proxy) is false? But do you also suspect that the trends are false? A thermometer in an urban area will show higher temperatures than in the country, but both will likely display the same trends, wont they?
Meaning: all the clocks likely show 10:29 after one minute and 10:32 after 5 minutes, except one which is showing 10:51 and 10:55 respectively. The trend would be: time is advancing about 1 minute per minute.
“A thermometer in an urban area will show higher temperatures than in the country, but both will likely display the same trends, wont they?”
OMG, you seriously are IGNORANT
Urban areas have expanded, that creates extra heat over time.
So NO, you moron, the trends will NOT be the same !!
…
I forgot, they are lying, right? Sorry.
“We never know reality beyond our measurements. ” – Mindert E.
RIGHT! I was never taught to “adjust” raw data. In fact, I was always cautioned not to, unless of course I wanted to commit fraud. Not an option for an honest scientist.
“Two stories, contradicting each other, cannot both be true.” – Mindert E.
And so the raw data had to be modified to fit the model output. They call it a “theory,” but it isn’t. It can’t be. If it were, then the model output and the raw data would agree. But they don’t. If the raw data have to be “adjusted” to agree with the model output, that is called “fraud,” not “theory,” unless of course you are a “climate scientist.”
Talk of “adjusted data” is Orwellian newspeak intended to fool the uninformed of the fact that what is being presented is interpretations of measurements/data. Obviously all measurements need to be interpreted for specific purposes but such interpretation can only be done with help of a theory of interpretation (which naturally needs to be explained in detail, and tested against the data). Theory of interpretation in its turn needs to understand the theory behind the measurement methodology.
Talk of “adjusted datasets” is just another layer of Orwellian newspeak intended to conceal the fact that what is being presented is a collection of interpretations of measurements/data from a certain time period.
“Readjusted datasets” is the ultimate Orwellian newspeak in climate science intended to conceal the fact that what is being presented is a new interpretation of data or interpretations of data, depending on whatever the interpretation is using as a source. All of this is possible only in post-normal science, where theory or hypothesis or ideology trumps data/measurements.
Yup!
The data gets adjusted for a lot of reasons: https://www.ncdc.noaa.gov/monitoring-references/faq/temperature-monitoring.php
Poor troll, still lingers around here after openly admitting being here to deceive people. The sad things is, his reading comprehension is even more lacking than his honesty.
Yep, but isn’t it odd that the adjustments always do two main things
1. Get rid of any evidence of the 1940’s peak.
2. Make sure that there always is a warming trend even if it doesn’t exist in the actual data.
The main reason for all adjustments, is the AGW-scam/agenda…. and trying in vain to match the farcical climate models.
Have you found that paper yet.. the one that proves CO₂ causes warming in a convective atmosphere…
… or are you still flapping around like half-stunned mullet.
This is odd, but their explanations are sound. I find it far more interesting that “normal” skeptics just deny the human role in the climate change, but “nutjob” skeptics go all the way and don’t believe any measured data while claiming they know the true values of the temperature changes.
This sounds a lot like a certain press secretary claiming there is no way to know the exact count of a crowd because no one counted them and then going on to claim that it was the biggest crowd ever 😉
About your CO2 prove: measure the spectrum from the ground looking up, compare it with the spectrum from space looking down and a black body spectrum. It’s likely someone has already done this experiment for you. Regarding convection: what mechanism drives convection in our atmosphere? Why is the temperature in the air column not uniform like you would expect in a system without a greenhouse effect?
Why do you make up false statements, SebastianH? Why are you calling people “nutjobs” who question the accuracy of the instrumental record (vs. satellites) as claimed by NASA and NOAA (that is now wholly different than it was in the 1980s) due to adjustments that always head in one direction?
Do you think of yourself as a skeptic, SebastianH? If so, what kind of a skeptic are you?
So the term “nutjob” is making you angry but your fellow commentators language (“sub-human”, “flapping around like a half stunned mullet”, etc) gets a pass?
I am skeptic of individuals who think everyone else but them is lying and who claim to know the truth despite their amateur status in the matter and can not adequately explain or prove what that truth would be. I read and comment here to learn more about this delusion.
Before you mirror the statement back to me: yes, I am aware that someone who fits this description would see everyone else fitting the description 😉
“So the term “nutjob” is making you angry…” – SebH
You are reading more into his comment than was there, kind of like climate “scientists” seeing warming where there is cooling. You see anger because that’s what you want to see, as opposed to what he’s saying, that you are a dishonest hypocrite.
Poor INCOMPETENT seb.
You can’t even support the very basis of you worthless AGW religion.
Surely it should not be such a hard task to find just ONE paper that proves CO₂ causes warming in a convective atmosphere. ??!!!
There is no CO₂ warming signal in the satellite temperature data.
No CO₂ warming signal in sea level rise.
There is no CO₂ warming signal anywhere.
You are totally UNABLE to produce a single paper that proves CO₂ causes warming in a pressure regulated convective atmosphere with a natural temperature pressure gradient.
BASELESS BELIEF is all you have. So sad.
“Why is the temperature in the air column not uniform like you would expect in a system without a greenhouse effect?”
ROFLMAO. you truly are one of the thickest, most gullible, braindead, trolls I have ever seen !
Who says it would be uniform, what a stupid idea. No planet with a significant atmosphere has a uniform temperature atmosphere, they all have natural temperature/pressure gradients.
We are talking REALITY here, not some vague non-existent, anti-science mock-up from some rabid AGW anti-scientist.
Thank goodness for radiative gases allowing the atmosphere to cool from the top, hey, otherwise we would really be warm. 😉
Poor seb.
Have you found that paper yet.. the one that proves CO₂ causes warming in a convective, pressure/temperature gradient controlled atmosphere……
do try harder..
as you go flippity-flop in the bait bucket.
1) I am not the least bit angry that you called me a “nutjob”. (If I am angry, it would be because you dishonestly claimed I was being deceptive by removing the Dobson Units and ozone column from a graph on temperatures.) 2) I don’t use any of the language or word choices you just falsely accused me of using. 3) I also don’t endorse or support name-calling no matter who uses it. In fact, I expressed that very sentiment in the 17 non-hockey stick papers comment thread. I do find it interesting, though, that you complain about others calling you names, but then you turn around and name-call yourself.
Can you cite a quotation from someone who has actually written that “everyone else” is lying? Or are you just making up statements again?
“‘flapping around like a half stunned mullet’”
No name-calling there… so don’t wet your nappy again.
Just a description of your total inability to produce one tiny bit of evidence to support the very basis of your baseless religion.
You are still flapping and flopping around, avoiding producing a paper that shows CO₂ causes warming in a pressure/temperature gradient controlled atmosphere.
I could point a radiation detector at a warm brick wall, and get a reading as well. Or at a lit candle. Or at a frying mullet, after its been gutted and clean, for that matter.
Its all dealt with by the natural convection, as controlled by the gravity based pressure/temperature gradient, and CO₂ has absolutely ZERO influence on that.
SebastianH 31. January 2017 at 7:14 PM | Permalink
“I am skeptic of individuals who think everyone else but them is lying and who claim to know the truth despite their amateur status in the matter and can not adequately explain or prove what that truth would be.”
We don’t necessarily think you’re lying. We think that most small warmunist water-carriers are the brainwashed victims of an expertly managed giant propaganda enterprise, which is what most of government science has become. Forcefully brainwashed in mandatory state schools and mandatory state TV.
@Kenneth:
I didn’t call you a nutjob and I did accuse “your fellow commenters” (namely AndyG55 to who’s comment I originally replied). “Everyone else lies” is implied by many users here. Whether someone mentions the greenhouse effect, temperature data from whatever source, spectrometers, anything that indicates AGW or just GW is real … it’s all talked down as a lie with the implication the accuser knows the truth.
Those are the “nutjob” skeptics. Normal skeptics say/write that climate sensitivity might not be as high as we are told it is and we should not be alarmed as much rather investing in adaptation instead of trying to reverse the warming. And that is totally reasonable and I’d agree on some of the point they are making. The “nutjobs” however are just anti-science conspiracy people who can’t be taken serious.
@AndyG55:
Please just stop making a fool out of yourself.
And yes, you could point a spectrometer at a warm brick wall and get a reading (https://www.tuhh.de/mt/ftir/project02-chap2.htm). What is your point? A spectrometer doesn’t just measure the temperature.
You seem to know that things radiate. The surface radiates and the atmosphere radiates. What are the magnitudes of both upward emissions? The surface is warmer than the upper atmosphere, where does the surplus radiation from the surface go? The answer is: back to the surface. I saw you commenting on wattsupwiththat, maybe this recent article is something for you: https://wattsupwiththat.com/2017/01/28/this-is-how-climate-works-part-1/ and https://wattsupwiththat.com/2011/03/10/visualizing-the-greenhouse-effect-emission-spectra/
@DirkH:
Again, insults and conspiracy talk. From a blogger who thinks 1000 years of history were somehow added to the record (January 15th on your blog).
ROFLMAO.. you are so empty. !!
And STILL the TOTAL INABILITY to produce one single paper that proves CO causes warming in a convective atmosphere.
The only person making a fool of themselves is YOU, just as you have the whole time you have wasted here, dodging and weaving as you try to avoid the very basic issue that CO₂ warming of the atmosphere has NEVER BEEN PROVEN.
You are basically a brain-washed twerp who cannot even get past the very first step in defending your BASELESS religion.
You have NOTHING.
First link.
Absolutely NO PROOF that CO₂ causes warming in a convective atmosphere.. NONE, NADA , ZIP !!!
Second link, also no proof that CO₂ causes warming. Just different bands of radiation. Nothing that says anything causes warming.
You really need to read these after doing some basic science and engineering courses in thermodynamics before you make stupid comments.
There is NO CO₂ warming signal in the satellite data sets.
There is NO CO₂ warming signal in the sea level data.
There is NO CO₂ WARMING SIGNAL ANYWHERE. NONE.
It is a hypothesis that is batting ZERO out of many thousand…… a ZOMBIE hypothesis.
I strong suggest you read the very first comment of the second link
Before you continue to make a fool of yourself by continuing to be unable to provide even the most basic support for your FAILED religion.
The “Laws of Thermodynamics” make a total MESS of the failed anti-CO₂ AGW hypothesis.
“A very complicated and flawed article.
What are we actually measuring when we measure temperature? It is the measure of Kinetic energy of the atom. In the laboratory CO2 will adsorb IR radiation and increase in temperature. In other words the atoms increase their vibrations. In the atmosphere, where there are other gasses, this CO2 will transfer these vibrations to the other gasses by collision. This is heat conduction.
When gas gets warmer it expands, density falls and it rises, convection. In the troposphere heat is lost through convection not radiation. Radiation is not possible because as this air rises its temperature falls due to adiabatic expansion. Its temperature will fall below that of the surface, and the 2nd law of thermodynamics forbids heat flow from cold to hot ( this is heat flow by any means available) so this rising warm air, relative to the surrounding air though colder than the surface, cannot warm the surface.
We can measure what we might think is the LW IR as back radiation but we probably forget that as energy flows through the atmosphere it has an effect on that atmosphere which will reduce that incoming energy which is revealed as a frequency change ( its speed remains constant) so that measured LW IR is altered solar energy not re-radiated IR from CO2.
At least this is how I see it bearing in mind those old Laws of Thermodynamics.
It is also flawed to use the black body formula for the earth since it is not in equilibrium at any time due to changes to cloud cover.”
“Our analysis revealed that GMATs of rocky planets can accurately be predicted over a broad range of atmospheric conditions and radiative regimes only using two forcing variables: top-of-the-atmosphere solar irradiance and TOTAL SURFACE ATMOSPHERIC PRESSURE”
https://tallbloke.files.wordpress.com/2015/09/planetary_temperature_model_volokin_rellez_2015.pdf
I’ll calmly repeat my question to you:
What are the magnitudes of both (surface and atmosphere) upward emissions? The surface is warmer than the upper atmosphere, where does the surplus radiation from the surface go?
It’s basic physics, the effects of CO2 are known, you can measure it’s presence and effect in the atmosphere. Same goes for water vapor and other greenhouse gases (every molecule that has 3 or more atoms).
Please try to explain how you think the energy budget of this planet (or every other planet) works and why the surface is as warm as it is. Or link to a website that fully represents your viewpoint.
I have asked you MANY times to provide just ONE paper that proves that CO₂ causes warming in a convective atmosphere. Where is it?
This is the very basis of your AGW religion, but you are TOTALLY UNABLE to do it.
Why is that ??
Why are you constantly avoiding this most basic request, and thus making a MONUMENTAL FOOL of yourself ???
Here is a link to a paper for you to read.
Now where is your link ???
Waiting, waiting…
… put up or DON’T, up to you. 😉 !!!
http://hockeyschtick.blogspot.com.au/2015/08/new-paper-confirms-gravito-thermal.html
or
https://tallbloke.files.wordpress.com/2015/09/planetary_temperature_model_volokin_rellez_2015.pdf
and another
http://hockeyschtick.blogspot.com.au/2016/06/new-paper-demonstrates-gravito-thermal.html
Thank you for those links. I’ll reply when I read them all. First thought: dependence on just two variables seems like an oversimplification. The comment you quote has a problem with colder than surface air not being able to heat the surface and that is fundamentally true. The surface wont get warmer because was heated by colder air, the temperature is increasing because the energy it receives from the sun can’t be radiated as fast. This is simple thermodynamics.
SebastianH: “It’s basic physics, the effects of CO2 are known, you can measure it’s presence and effect in the atmosphere.”
According to the IPCC, the atmosphere contains just 1% of the total net heat changes associated with imbalances in the radiative energy budget. The oceans account for 93%.
Since you believe the explanation is “basic physics”, the effects of CO2 on water temperature change are “known”, and CO2 dominates as the climate’s control knob (the regulator of ocean heat), please provide the “basic physics” experiment and physical measurements that confirm raising or lowering CO2 in volumes of 0.000001 (ppm) is the primary means by which the oceans’ temperature is regulated.
How much heat does a body of water lose if the CO2 concentration in the air above it is lowered by -0.00001 (-10 ppm)? Cite the controlled scientific experiment determining this and provide links. In other words, support your “basic physics” contention with actual “basic physics.”
I’ve invited you to do this several times previously. Each time, you fail to support your beliefs with evidence. Instead, you provide a human body analogy or some other such tangential diversion — or you don’t reply at all. Since this is happening again and again and again, perhaps you may need to actually reconsider why it is that you believe what you believe about CO2’s climate-controlling capabilities.
I read the paper, older versions of the theory and watched a youtube video of one of those scientists explaining their findings (btw: they wrote their names backwards in the paper?). I still don’t get it.
What they are saying is that it doesn’t matter that an atmosphere has GHG in it despite the fact that all the planets/moons they looked at have them in their atmosphere. If it doesn’t matter, how does the atmosphere radiate heat into space at it’s top?
An IR transparent atmosphere that heats the surface through this proposed gravito-thermal effect above the temperature that it would have without an atmosphere would cause a paradox since then the whole system would radiate more heat into space as is received from the sun.
On a number of occasions you claimed that CO2 (and other GHGs) actually cool the Earth. That is a true statement for the description of the top of our atmosphere. But the same effect works in every layer of the atmosphere and because it is denser at the bottom heat is trapped. Gravity is necessary, but it is not causing a heat build up. Gravity is a force, it does not perform any work. In order for gravity to pull something down, something else has to put it up first.
Their approach – however – looks like a good aproximation/prediction of surface temperatures for rocky planets with GHGs that behave in a similar way. Reality is more complicated, see http://onlinelibrary.wiley.com/doi/10.1002/qj.2704/pdf
@Kenneth: if you increase the amount of GHGs the backradiation increases and the surface must become warmer (*) to radiate the same amount of heat. 70% of the surface is water, so its temperature increases too.
There is no magic involved.
(*): this is a simplification, there are positive and negative feedbacks involved. Evaporation would increase so the surface would not have to be as warm, increased water vapor due to evaporation would increase the backradiation in turn, etc
So how does the temperature of the water get heated by greenhouse gases at the surface, SebastianH? Even SkepticalScience and RealClimate (blogs) acknowledge that the heat trapped by CO2 does not penetrate into the ocean itself.
SkS: “Greenhouse gases, such as carbon dioxide, trap heat in the atmosphere and direct part of this back toward the surface. This heat cannot penetrate into the ocean itself”
So if 93% of the Earth system’s heat energy subject to change by perturbations in the radiation budget is contained in the oceans, and the heat “trapped” by GHGs cannot even penetrate past the 0.1 to 1 mm “thick” skin layer into the ocean, how does CO2 nonetheless get credit for being the oceans’ primary control knob?
See, I realize that this “explanation” you wrote is what hypothetical models say should or might or could or may possibly happen. I have been asking you, again and again, to provide an example of a scientific experiment with physical measurements that confirms that varying CO2 over a body of water in volumes of parts per million actually does do what the hypothetical models say should, might, maybe, possibly happen. In other words, I am asking you to support your beliefs scientifically. Once again, you have failed to do so. You just repeated the hypothetical talking points…because that’s what you’ve been told is truth.
And STILL the evasion.. squirming like a worm.
STILL the TOTALL INABILITY to provide a single paper to support the very basis of your irrational religion.
It really is beginning to look like you KNOW that CO2 doesn’t cause any warming in a convective atmosphere, but are just rabbiting on with all this other rubbish, because you have avoid the point somehow.
It really is getting RATHER PATHETIC.
Perhaps your only excuse is that it is magic, and thus empirical evidence isn’t required.
“…increased water vapor due to evaporation would increase the backradiation…” – SebH
Which is why surface temperatures in humid areas are COOLER than those in dry, at equivalent latitudes and elevations.
Sorry, but since the AGW “theory” doesn’t give the correct answer, it has to be wrong. And, yet again, so are you.
The warmist “backradiation” heats nothing. In the absence of new solar radiation (at night), the surface emits more heat than is scattered/reflected back, so the net effect is cooling. That’s why, when the sun goes down, the temperature begins to fall. Same reason your thermos never re-warms cold coffee.
SebastianH 1. February 2017 at 11:43 AM | Permalink
“@DirkH:
Again, insults and conspiracy talk. From a blogger who thinks 1000 years of history were somehow added to the record (January 15th on your blog).”
You suffer from muddled thinking. Again a symptom of brainwashing. I never said I believe that to be true. But it is a possibility.
Maybe you are just incapable of parsing english sentences?
Chronologies are man-made (and actually, its own scientific field) like warmunist computer models so they can be as big a propaganda lie as a warmunist computer model. For those who want to know more (funny you didn’t link to the debate on my blog, which was pretty good)…
https://dirkhblog.wordpress.com/2017/01/15/1000-years-added-to-history/
I see most of recorded history as war propaganda. Good old example: The justification for the Canaanite genocide.
“I still don’t get it.”
Nor would I expect you to.
1. It requires some basic scientific knowledge.
2. Your mind is totally brain-washed with the anti-knowledge of the AGW scam.
You have a LOT to unlearn before you can ever expect to make any progress.
@AndyG55: i took all this time read through your gravito-thermal greenhouse effect theory, commented on it and this is the reply I get? Yeah, that really is pathetic.
You keep emphasizing “in a convective atmosphere” like this would change anything. Why? Do you think the GHGs don’t work like they are supposed to work when convection happens? Do you really think once a CO2 or H2O molecule absorbed energy it never emits it until the molecule reaches the top of the atmosphere and only then emits to space?
@yonason:
There is no contradiction with the greenhouse effect (that’s not the AGW theory). The evaporation of water on your skin on a hot day cools your body, the same is true for Earth’s surface. If you want to know where that water vapor ends up than have a look at a satellite movie of Earth.
Thank you for explaining why the night is cooler than the day. Hopefully you have witnessed the effects of a full cloud cover vs. a clear sky at night in your life. I wonder how many times more this has to be written: the greenhouse effect doesn’t heat the surface, it causes a warmer surface because the surface can’t get rid of the energy received from the sun as fast as without this effect. It’s works like your thermos at night (no energy source). With the sun shining it’s more like a pressure cooker.
So apparently you would you say that CO2 doesn’t heat the water’s surface, it causes the water’s surface to be warmer (because the heat can’t escape with all that heat-trapping going on). Apparently there is a clear distinction between heating and causing warmth. If so, how does that warmer surface caused by CO2 penetrate that warmth (not heat) 20, 30, 200 meters down into ocean depths and thus override the actual heating capacity of the Sun, allowing CO2 variations of + or – 0.000001 to dominate over the Sun’s radiation as the climate’s control knob? Please support your answer with scientific evidence (a controlled experiment, empirical observation, physical measurements, etc.).
And STILL the evasion.. squirming like a worm.
STILL the TOTALL INABILITY to provide a single paper to support the very basis of your irrational religion.
ABSOLUTELY NOTHING.
Just provide one or STFU, you mindless twerp
“it causes a warmer surface because the surface can’t get rid of the energy received from the sun as fast as without this effect”
UTTER BULLCRAP.
There is no proof of this happening.. It is baseless conjecture.
Just make stuff up, hey. MAGIC !
But much easier than actually providing an empirical paper.
““it causes a warmer surface because the surface can’t get rid of the energy received from the sun as fast as without this effect””
The only GHG that actually does anything is H2O, and it COOLS the surface.
The only time it ever slows down cooling is when it has overdone it cooling because of latent heat capacity.
CO2 is nothing but another conduit for cooling, it absorbs surface radiation and thermalises to the other 99.96% of the atmosphere and is dealt with by convection.
Thermalisation happens magnitudes quicker in the lower atmosphere than re-mittance.
CO2 does not re-emit below about 11km.
It CANNOT and DOES NOT, “trap” any heat, nor, AS YOU KEEP PROVING, does it cause any warming in a convective atmosphere.
That is why you CANNOT find any paper providing proving that CO2 causes warming in a convective atmosphere, because no such paper exists.
There is NO CO2 warming signature in the satellite temperature data.
There is NO CO2 warming signature in the sea level data,
There is NO CO2 WARMING SIGNATURE ANYWHERE….
Because CO2 DOES NOT cause warming in a convective atmosphere.
End of story,
End of baseless religion.
“Do you really think once a CO2 or H2O molecule absorbed energy it never emits it until the molecule reaches the top of the atmosphere and only then emits to space?
”
H2O, lower atmosphere, CO2 not until above about 11km
Do try to learn something, at least once, bozo.
https://s19.postimg.org/q2s1euh6b/stratospheric_cooling.jpg
“In order for gravity to pull something down, something else has to put it up first.”
What a truly MORONIC statement.. do you have a 5 year old typing for you today ???
Do you mean all the air in the atmosphere, it is being acted on by gravity, what stops it from falling?
Think really hard, you may eventually figure it out !
(I hope moderation has no further comments popping up between your answers)
AndyG55, it is really difficult to stay calm with your continued insults. I’ll stop replying to your comments from now on.
You linked to a weird gravity based warming theory that can’t work without greenhouse gases and demand evidence from me that the greenhouse effect exists? The effect has been measured multiple times…
https://ams.confex.com/ams/pdfpapers/100737.pdf
http://www-ramanathan.ucsd.edu/files/pr50.pdf
https://www.nasa.gov/centers/langley/news/factsheets/ERBE.html
http://www.nature.com/nature/journal/v519/n7543/full/nature14240.html
https://www.giss.nasa.gov/research/briefs/schmidt_05/
https://ceres.larc.nasa.gov/cmip5_data.php
http://journals.ametsoc.org/doi/pdf/10.1175/2008BAMS2634.1
http://lasp.colorado.edu/home/sorce/data/
Before you complain that the backradiation isn’t measured directly you might have a look at how force is measured.
Regarding your image about stratospheric cooling, please read the full article you lifted that image from: http://www.xplora.org/downloads/Knoppix/ESPERE/ESPEREdez05/ESPEREde/www.atmosphere.mpg.de/enid/0,55a304092d09/2__Ozone/-_Cooling_nd.html
@Kenneth:
Why would the backradiation need to penetrate the ocean? It doesn’t penetrate the land either. The warms the ocean and land surface, but the backradiation increases the surface temperature. There is still the same amount of energy in the system.
This has also been measured: http://journals.ametsoc.org/doi/pdf/10.1175/1520-0426(2001)018%3C0994%3ATMAERI%3E2.0.CO%3B2
You weren’t aware that the proponents (IPCC, NASA, NOAA…) claim that the 0-2000 m (apparently not below that depth) is warming…because of the TOA radiative imbalance forced by anthropogenic CO2 emissions?
So is it your position that 93% of the Earth’s heat (i.e., that which is in the oceans beneath the skin layer) is unaffected by CO2, only the 1% that is in the air? If so, this once again goes to address the magnitude issue. How is it that you believe anthropogenic CO2 emissions regulate the climate?
Regarding Minnett et al. (2000), which I have read multiple times, were you aware of this:
“[T]he temperature of the ocean, measured in the bulk of the fluid close to the surface, is greater than the bulk air temperature above, resulting in a heat flow from the ocean to atmosphere.”
If, as your own link posits, the heat transfer is from ocean (93% of Earth’s heat subjected to variation) to atmosphere (1% of Earth’s heat subjected to variation), and you acknowledge that the oceans’ internal heat is not affected by CO2, how, then, do you believe CO2 nonetheless dominates as the climate’s control knob?
Did you also know that CO2 is not even mentioned as a factor affecting the surface flux in this paper? If CO2 variation is the dominant cause of climate changes, wouldn’t you think that it would at least be mentioned as a factor affecting the surface flux in a paper like this?
By the way, are you still maintaining that it was “deceptive” to remove the Dobson Units/ozone column trend line from a temperature graph, or is your failure to respond to the last volley an indication that you have exhausted your attempts to justify your false accusations? I will likely continue to ask this until you acknowledge that it was not “deceptive” to have done what I did, or until you retract your false accusation. And you still have not addressed why it is you characterized the Rydval graphs as “unnecessarily” photoshopped, implying, again, that something deceptive was being practiced here. What was that, SebastianH?
(the comment is in moderation)
I can’t resist bringing up an analogy … imaging an open pot of boiling water on your stove. No turn the heat of the stove down so the water is just not boiling anymore. What is going to happen when you put a lid on the pot? The water will get hotter and start boiling again without you increasing the input energy.
And what if “putting a lid on the pot” (longwave) is completely dominated by clouds within the greenhouse effect, and CO2 plays a very modest to insignificant role (when compared to clouds)? In other words, what if only a tiny fraction of the pot lid was CO2 variation, and the rest was cloud cover variances? Would you nonetheless claim that CO2 was the climate’s control knob anyway? Of course you would. But why, SebastianH?
Peter Minnett (the lead author of the AMS paper you just referenced): “[T]he range of net infrared forcing caused by changing cloud conditions (~100W/m2) is much greater than that caused by increasing levels of greenhouse gases (e.g. doubling pre-industrial CO2 levels will increase the net forcing by ~4W/m2)”
Ramanathan et al. (1989): “The size of the observed net cloud forcing is about four times as large as the expected value of radiative forcing from a doubling of CO2. The shortwave and longwave components of cloud forcing are about ten times as large as those for a CO2 doubling.”
@SebastianH 1. February 2017 at 10:15 PM
I think your fist part to me there is basically correct, though I’m not clear on what distinction you are making between AGW and greenhouse effect. It’s not one the warmists make, as I understand.
Yes, water evaporation cools the earth, taking heat up into the atmosphere. When that heat is released some probably returns, but never more than what was removed, so the net effect is, as you say a slowing of the cooling, but never a net warming. But humid atmospheres also slow the warming (and cooling), as well. That’s negative feedback described in the video I linked to several days ago.
“Hopefully you have witnessed the effects of a full cloud cover vs. a clear sky at night in your life.”
Yes. And when the atmosphere is dry, the effect is much greater than a humid atmosphere without clouds, going rapidly from shirtsleeve comfortable to ‘where’s my jacket?’ chilly.
“With the sun shining it’s more like a pressure cooker.”
That’s more than a bit of a stretch, since there is no lid on the planet, and the atmosphere can expand relatively freely when heated.
” I wonder how many times more this has to be written: the greenhouse effect doesn’t heat the surface, …etc… ”
If you mean what I think you mean, I’m OK with it. The problem is that warmists aren’t, at least not the ones I’ve had any dealings with.
Years ago I took a heat and mass transfer course, and one of the things they showed us was that on a clear night water can freeze when air temps are above 0 Deg C., because of radiation to space. With clouds in the way, the heat loss is slowed, because clouds are quite a bit warmer than space, and radiative exchange with them is slower.
The following driver safety advice has a good minimally technical discussion that may be helpful, in more was than one.
http://www.atmos.washington.edu/cliff/Roadway2.htm
The following is in the section entitled
“Surface Temperature and Air Temperature Observations: How Are They Related?”
ASIDE: For me, the possibilities of such large local temp variations make a complete mockery of the concept of an average global temperature.
And if atmospheric CO2 slows heat loss, then it also slows heat gain, which would mean it, like water vapor, exhibits negative feedback. If you didn’t see the video yet, it’s an excellent presentation.
And STILL NOT ONE PAPER showing that CO₂ causes warming in a convective atmosphere.
NOT ONE..
You should read some of the stratosphere cooling paper yourself. They say that CO₂ causes tropospere warming, but NOWHERE to they prove were or how, since CO2 ONLY emits above 11km. Its a baseless assumption like most AGW nonsense.
But they do say and prove…
“Nearly no radiation from the surface can, therefore, reach the carbon dioxide residing in the upper troposphere or lower stratosphere. On the other hand, carbon dioxide emits heat radiation to space. In the stratosphere this emission becomes larger than the energy received from below by absorption.”
I’ll repeat that last bit so you can actually think about it, if capable. (as if)
“In the stratosphere this emission becomes larger than the energy received from below by absorption”
Now how would that happen unless the energy got there by another channel?
——-
Most of the others links are to assumption driven AGW junk, Trenberth, Schmidt.. roflmao…. zero proof.
The Marty Feldman paper is a joke because it starts at a point at the trough just after an El Nino and stops at the peak of one.. It shows El Nino, NON-CO₂ warming, nothing else.
They never did a test for 2000-2008.. very weak, basically non-science. .. DOH !
And 5 years to publish? did it take that long to tease out a measly 0.2w/m².. or did their data actually go to 2012.
https://s19.postimg.org/6nqtliulv/Feldman_oops.png
——
“AndyG55, it is really difficult to stay calm with your continued insults. I’ll stop replying to your comments from now on.”
So What. I can’t help it if you are inadequate.
Leaving an empty gap in your baseless religion, because you have been TOTALLY UNABLE to prove that CO2 causes warming in a convective atmosphere. Nada, NOTHING, ZERO, EMPTY….
So far your attempts have been puerile at best.
So RUN and HIDE, squirmy little worm.
“without greenhouse gases and demand evidence ”
Yes CO₂ is used in greenhouses.
But it is a radiative gas, that absorbs and emits radiation after as relaxation period.
These are absolutely necessary to radiate energy into space.
The term greenhouse gas is meaningless in real science. But you wouldn’t know that, would you.
For CO₂ in the lower atmosphere that relaxation time is a few magnitudes longer than any collisional time, so as clearly shown the start-cooling chart above, CO₂ does not re-emit in the lower atmosphere, it absorbs then thermalises to the remain 99.96% of the atmosphere.
Convection takes over. There is no mechanism that allows the energy to be trapped in the lower atmosphere.
And as you continue to show from your total absence to produce any papers…. a very pathetic attempt its been too. !
CO₂ DOES NOT and CAN NOT cause any warming in the lower atmosphere.
http://lasersparkpluginc.com/uploads/CO2_Absorption_Data.pdf
“You linked to a weird gravity based warming theory that can’t work without greenhouse gases”
Sorry your brain-washed miasma won’t let you comprehend the most basic principles..
As I said earlier.. you have a LOT of anti-knowledge to un-learn before you are likely to gain any basic competence or understanding.
All planets have some RADIATIVE gases.
So long as there is enough to COOL the planet, the temperature/pressure gravity based atmospheric gradient will control the surface temperature.
The actual percentage of radiative gasses is immaterial, as shown by the FACT that the proven gravito-thermal THEORY works exactly as well for Venus with 96% CO₂ and Earth with 0.04% CO₂
Kenneth, having these kind of conversations in the (unthreaded) comments of a blog is really difficult. This discussion feels very circular …
How does that contradict what I am trying to explain to you? Sun heats water, water has higher temperature because of increased backradiation. Increase isolation of anything that has a heat source and its temperature increases without adding more energy to the system. I don’t know how to explain this any clearer …
No, that is not what I wrote. I doesn’t matter where the heat is located … if you increase the backradiation and no other effects counteract this with equal magnitude, the surface temperature increases. This is on top of all the natural variations that happen and of course the heat flow is from the ocean to the atmosphere (same as on land, except for locations where the surface is cooler than the atmosphere, e.g. Antarctica). The greenhouse effect (and cloud cover) limit the heat transfer thus resulting in higher temperatures. There is no magic involved …
The paper is about an interferometer and it’s applications.
Regardings “deceptive”-gate: fine, it wasn’t deceptive of you to pull a temperature graph from a paper that mentions general and continued warming. The “unnecessary” photoshop is about Fig. 8 that you split and rearranged despite the original image (https://static-content.springer.com/image/art%3A10.1007%2Fs00382-016-3478-8/MediaObjects/382_2016_3478_Fig8_HTML.gif) being just fine.
@yonason:
Thank you for your reply. Regarding your aside: of course the temperature variations between day and night and different seasons are far greater and more noticable. Small changes are subtle. A region will get less rain or more sun than usual or some other small changes of the average that affect our economy. Eating 10 calories too much each day (on average) will increase your weight despite daily variations in caloric intake vary by a far greater amount 😉
If the stratosphere is warmer than the surface (which apparently happens in Antarctica) CO2 and other GHGs have the reverse effect. At least that is what a paper recently posted here said. In the normal atmosphere CO2 does not really slow heat gain since it only absorbs long wave IR which is mainly emitted from the surface not the sunlight passing through the atmosphere.
Water has higher temperature because of increased backradiation? So in your opinion, the longwave heat trapping has more to do with temperature variations in the first 20-30 m of the ocean surface layers than variances in the direct shortwave radiance does, as modulated by clouds or aerosols (albedo)? SebastianH, the shortwave effects of clouds and aerosols completely overwhelm the longwave effects of clouds and aerosols in their capacity to heat the oceans (or trap heat at the surface). So already your comment above is wrong based on that finding alone. And as far as backradiation goes (LW), clouds completely dominate over CO2 variations too within the GHE. Again, we’re talking about magnitudes. And you’re continuing to assume that CO2 dominates over all other factors within the greenhouse effect in terms of regulating ocean heat when in fact the science itself says the opposite.
Again (and again and again), you are assuming that the “increase in backradiation” is CO2, and completely ignoring the fact that it is widely accepted that CO2 encapsulates just a tiny fraction of backradiation forcing relative to clouds within the GHE — according to scientists who are proponents of your position. I keep on pointing this out, and you keep on pretending that you don’t notice that CO2 isn’t more than a modest constituent within the GHE (backradiation). You’re unwilling to consider that CO2 is not the dominant climate forcing factor because, well, it just is. Every time I point out CO2’s modest role relative to clouds within the GHE, you ignore it. You don’t even acknowledge it. And then you turn around and characterize the position that CO2 is not the climate’s dominant regulator as “delusional” (your word). This is why the others here engaging in a “debate” with you are so frustrated…you are operating as someone who is married to a religious belief that you just cannot find within yourself to even question or critically examine. You’re not the least bit skeptical of what you believe to be true.
And the reason why I had to break up the graph from Rydval et al. (2017) is because the graph itself was far too large (vertically) for a printscreen (the graphs’ details would be unreadable with a screenshot from that distance), and I have to be able to take screenshots in order to load the graphs onto this website for publication in articles. So yes, it was necessary to break up each graph individually. The hubris you have in assuming you know what my motives are is exhaustingly off-putting. And then, even when corrected/informed of the reasons for “photoshopping” graphs (to make them user-friendly/readable for viewers), you continue to insist that your accusation was right all along, that indeed I was trying to deceive people by removing Dobson Units from a temperature graph for an article on temperatures. Sick.
““I can’t resist bringing up an analogy … imaging an open pot of boiling water on your stove. No turn the heat of the stove down so the water is just not boiling anymore. What is going to happen when you put a lid on the pot?”
What a child-minded analogy.
A far better analogy would be “what happens if you put a piece of 2″ grid, thin chicken wire over the top.”
ie Sweet F*** All.
AndyG55, please read the link I provided explaining your stratospheric cooling graphic: http://www.xplora.org/downloads/Knoppix/ESPERE/ESPEREdez05/ESPEREde/www.atmosphere.mpg.de/enid/0,55a304092d09/2__Ozone/-_Cooling_nd.html
What do you not understand about this effect?
Energy isn’t trapped, heat is. The Earth-Atmosphere system still radiates the same amount of energy to space as was received from the sun. Only the temperatures in different layers change.
And I repeat: it does. There is a difference between warming and causing warming however.
And what should that be? Voodoo science?
So much for not responding.. You are a LIAR as well as a scientific illiterate.
I ask again, because you don’t seem to have the vaguest idea.. as usual…
“In the stratosphere this emission becomes larger than the energy received from below by absorption.”
Where does this energy come from ?
——–
No, neither energy or heat is trapped by CO2.. That is another baseless unproven assumption/lie..
CO2 does not cause or lead to any warming in the a convective atmosphere. You have been TOTALLY UNABLE to provide one single paper that prove it does.. You are still sidestepping the most basic FARCE of your baseless religion.
——–
Do you call all real science you are UNABLE TO COMPREHEND, “voodoo science” ?
Must be the hallucinogenics… Do you work with voodoo dolls, crystal balls, tarot cards etc, like the rest of the climate glitterati?
—-
“Only the temperatures in different layers change.”
Except the troposphere has absolutely NO CO2 warming signature, go figure. Just solar forced El Nino releases
No hot spot.. NOTHING.. a fallacy. a fairy-tail at best.;-)
Just an expansion of the troposphere due to grand solar maxima of the latter half of last century, delayed by the massive sink that is the oceans. Or didn’t you know why measuring the stratosphere at set heights gives cooling trends… Are you really that mathematically inept?
——
I repeat, because you have been totally unable to prove otherwise.
“CO₂DOES NOT and CAN NOT cause any warming in the lower atmosphere.”
I do understand why you be getting totally exasperated at your ineptness of supporting even the most basic part of your religious belief in AGW.
Must be very stressful for you., Poor petal.!
Read the whole article or at least the whole quote. It is indeed exasperating to witness how you constantly ignore explanations and how you come back with weird statements constantly demanding that I have to prove something to exist which can be measured. It’s like asking someone to proof his/her height. If someone is following a religion here then it is you. I give up …
And STILL not one paper showing CO₂ causes warming in a convective atmosphere.
How many more chances would you like to keep ducking and weaving, Seb. ! 🙂
You are batting ZERO out of many, so far.
Are you blind as well as dumb?
“I give up …”
I got the impression you had given up trying to provide a paper to support your unsupportable religion several days ago.
You know, the one that proves CO₂ causes any warming in a convective atmosphere.
You know the satellite data contains zero trace of any CO₂ signature, so you knew you were always up against the FACTS…
… but that didn’t hold back your random hand-flapping.
Pretty hard to prove any CO₂ warming when there isn’t any actual warming from CO₂, isn’t it ;-).
Certainly your attempts have been rather petty
and meaningless.
Maybe you can do better next time… or NOT.
If someone knows how, send a link to Carolyn Kormann: See Paul Homewood’s post today for comments on her latest article in the New Yorker. I briefly looked at some of her other articles and they suggest to me she is more about literature than science. This might be above her pay scale.
“Unlike President-elect Donald Trump, Iranian President Hassan Rouhani has said that he believes that fossil-fuel consumption is the main driver of climate change.” – Carolyn Kormann
So, what does Iran propose to do?
Kill homosexuals, and other “undesirables,” of course!
https://www.jihadwatch.org/wp-content/uploads/2014/02/gay-hanging.jpg
If that doesn’t stop climate change, what will, eh?
Oh,if only president Trump were more like the Iranian Mullahs, eh?
Obviously, Carolyn Kormann has crap for brains.
“Unlike President-elect Donald Trump, Iranian President Hassan Rouhani has said that he believes that fossil-fuel consumption is the main driver of climate change.” – Carolyn Kormann
So, what does Iran propose to do?
Kill homosexuals, and other “undesirables,” of course!
https://www.jihadwatch.org/wp-content/uploads/2014/02/gay-hanging.jpg
If that doesn’t stop climate change, what will, eh?
Oh, if only president Trump were more like the Iranian Mullahs, eh?
Obviously, Carolyn Kormann has crap for brains.
You are too kind to her. She isn’t worth you empathy. She is dreck, as my previous post will assert, when it appears.
Thanks Kenneth for yet another meticulously written post, documenting the post-modern science within NOAA. This is far more detailed than any other presentation that I have seen before.
Karl’s OWN data and opinions from previous years flatly contradict his current, guestimate-riddled figures.
Further, independent media articles from yesteryear also conveniently act as a neutral barometer for the weather of that time, again revealing that today’s claimed temperatures for that era bear NO resemblance to accepted observations from back in the day.
If this isn’t checkmate then I don’t know what is. Karl et al better have their excuses carefully honed because explanations are due and they’d better be good. He must be aware he’s potentially in a great deal of trouble.
OT, but this wind subsidy scam is truly disgusting.
How do people like sob and seb justify this sort of crap ??
https://sunshinehours.net/2017/01/28/subsidized-swimming-pools-cash-for-ash-holes-in-uk/
Ingenious! Let the heater on at all times to prevent the planet from heating up! I’m sure a warmunist computer model can explain that!
I’m not going to fight with getting in the queue of that thread anymore, but I just read what SebH wrote to you, among which was this gem…
“Energy isn’t trapped, heat is.” – SebH
https://notrickszone.com/2017/01/30/robust-evidence-noaa-temperature-data-hopelessly-corrupted-by-warming-bias-manipulation/comment-page-1/#comment-1160710
All RIGHTY then! Time to cue Rod Serling.
OT. Trump getting high praise from small business owners.
The guy CARES, and knows how to get things kick started.
So get over being LOSERS, and get the **** out the way, leftist scum. !!
https://www.youtube.com/watch?v=-mg9vXEtlbs
Vikings said that greenland is green. This one data point obviously is enough to know, that the globe was warmer back then, than it is today.
Modern data is totally worthless, because there is no thermometer in parts of Africa.
“Sceptics” logic says so, so it must be true!
Bwahahahahahaha!!!
Sod, was that a deliberate invitation to be ridiculed?
What you wrote is pure stupidity,since it is well supported that a THOUSAND years ago it was indeed warm enough to live in areas,growing barley and other crops that today are impossible.
Vikings grew barley in Greenland
“A sensational find at the bottom of an ancient rubbish heap in Greenland suggests that Vikings grew barley on the island 1,000 years ago.”
http://sciencenordic.com/vikings-grew-barley-greenland
Plus there is that pesky boatload of published history and science papers showing that indeed worldwide it was warmer than today.
Your typically dishonest “one data point” statement was an obvious howler.
again, sob’s total ignorance of basically EVERYTHING is shown for all the world to see. 🙂
So funny.
Now I want definitely to know whether Sob is Eberhart Haverschmidt, born in 1982 in Frankfurt-am-Mein, and presently a staff member of the Salvation Army in Baden-Wurtemberg.
sod claims Vikings living in Greenland was a single data point, but….
“The colonies flourished for three hundred years.”
http://naturalhistory.si.edu/vikings/voyage/htmlonly/greenland.html
Just a 3 century long “data point.” Right!
Never intentionally amusing, and always tendentious, sod the tedious strikes again.
@SebastianH 2. February 2017 at 1:57 AM
Too much trouble trying to keep up with that thread. Besides, I only have a couple of comments and I’ll be done with it.
SebH’s first reference has this in the 2nd paragraph…
“The potential impact that global warming has
on society is extensive, particularly through
the associated change in climate that has
been predicted by many sophisticated climate
models.”
Written like a true believer. The models have ALL been shown to be totally bogus, so anyone for whom they are their gold standard isn’t someone I trust.
And that’s a wrap!
It’s a wonder that, despite all that “greenhouse forcing” rural areas still cool rapidly overnight.
Ok, one more, I guess. Second paper, beginning of last paragraph, left column first page.
“We obtain G by subtracting longwave radiation escaping to space from ESTIMATES of the radiation emitted by the ocean surface.”
“…ESTIMATES…”? They certainly know how to win my confidence, as when they write… “…the sesitibity dG/dT, of the NCAR Community Climate Model (CCM) [fn17] agrees closely with the observed sensitivity (Fig. 4).” {bottom left p.761}
Also, paper not searchable & no selectable copy option, as are many papers that old (1989).
If you want to draw attention to a SPECIFIC point in those papers, as well as an explanation of why you think it’s relevant, as Kenneth does, fine. Otherwise I’ll defer to what he writes about them.
Modeling, guestimattion, almost agrees with, etc., etc.
“The SST values are derived by blending in situ (ship and buoy) data with satellite temperature retrievals.” – bon appetite!
Honestly, how would you describe reality if not with models?
With models that have been validated. ie not the current crop of climate models.
Do you even know what that means?
Barn — side — MISSED !!!
Hahahahaha,
come on Sebastian,you can’t be that daft. Climate Models to year 2100,has no reality in it,as it is only year 2017. You will be long dead,before that magic year arrives,which means YOU can never meet THAT reality,you idiotically depend on.
Climate Models that reach year 2050,2100 are examples of junk science since they are not testable,thus fails the Scientific Method.
“come on Sebastian, you can’t be that daft”
Seb has shown over and over and over again….
..that he/she really IS that daft !!!
seb, the gift of laughter and ridicule that just keeps giving, and giving, and giving!
They say that laughter is the best medicine…
maybe seb thinks he is a witch doctor ? !!!!
@SebastianH 2. February 2017 at 5:44 AM
“Honestly, how would you describe reality if not with models?”
That rational is only valid if the model can match observations. By carefully comparing, verifying, and validating all models and all modeled projection against the observations will we know if the models are valid. Where the models consistently diverge from observation they should be abandoned as erroneous and unrealistic.
Currently the models, by incorporating mad values for the CO2 effects on climate, are unrealistic and therefore should be rejected as unreasonable to be used as a method of projecting future scenarios.
Remember SebastianH, just because the climate models are the only tools we have does not make them useful for anything but a private research project. All the models are very poor at portraying clouds, frost, precipitation, oceanic temperature changes, etc., as there are no adequate mathematical models for these variables and are therefore approximated and estimated. Unless and until these shortcoming are corrected the modeled climate remains irrelevant to real future climate scenarios.
It is hilarious that some warmists,this late into the 21st century, continue to promote a delusion,that a trace increase of a trace IR absorbing gas,with a single narrow band of any note(about 6%)in the IR window,can overwhelm many known components of the climate system,that have much higher impacts on the distribution of energy in the system.
No “hot spot” found in the Tropical Troposphere region. That alone invalidates the AGW conjecture as it is a keystone part of that conjecture.
No evidence of a Positive Feedback Loop in operation,that is supposed to cause a run away warming trend.
Gosh CO2 is a magic gas,that can speed up the melt rate of ice cream in the freezer!
SebastianH, can I marry that lovely molecule?
“can I marry that lovely molecule?”
Those yummy little hot CO₂ moles wearing hot little mini-skirts, bouncing about all over the place….
Of course all the other molecules and atoms get exited and flustered. 😉
Unfortunately, they only make up 0.04% of the population 🙁
More are definitely needed.
You might want to use that molecule for your blast furnace: It has another band at a Planck temperature of +230 deg C. (600K)
(the lower band peaks at -80deg C (200K); so it is very suited to keep the Earth from dropping below that temperature)
[…] Notrickzone exhume une déclaration à la presse de 1989 de Thomas Karl, ancien directeur de la NOAA (retraité depuis août 2016) : […]
The law of Andy G55 and friends
As the laws of thermodynamics do not allow that a colder body warms a warmer one, from now on its prohibited that H20, CO2 and Methane molecules are radiating towards Earth’s surface. Any molecule not following this rule will be deported into an education camp to learn proper behavior.
Poor ignorant Johands.
Ceres back radiation while CO₂ has climbed
https://s19.postimg.org/s0zmfl7jn/CERES_back.png
CO₂ does not radiate below 11km.
https://s19.postimg.org/s6jyed10z/stratospheric_cooling.jpg
If you lack basic knowledge, you should probably stay out of conversations that are WAY beyond you.
Else you continue to make a FOOL of yourself.
Sorry If I’m a bit narky this morning. Too many dumb trolls to deal with. 😉
I notice you are using my graphs of total Greenland and Antarctic ice mass, cool ! 🙂
What you need to look at is “residence time” before re-emitting of radiation absorbed by the CO₂ molecule.
this “resident time” is some 3 magnitudes SLOWER than its collision time with other molecules, This means that the exited CO₂ molecule will “thermalise” to the other 99.96% of the other atmosphere and be dealt with by natural convection. In the upper atmosphere, the process is reversed, and CO₂ emits to space. see this chart.
https://s19.postimg.org/s6jyed10z/stratospheric_cooling.jpg#sthash.XKWxt04y.dpuf
Its all just different conduits for the cooling of the atmosphere to balance the pressure/density/temperature gradient applied by the gravito/thermal effect.
There is NO mechanism that allows CO₂ to cause warming in the lower atmosphere.
That is why seb is having so, so much trouble finding a paper that shows that it does. He has an impossible task, and I think he actually KNOWS that.
You really believe gravity is performing work on the atmosphere, do you?
So it’s like hydro power? Gravity pulls the water downhill, the sun evaporates it, it rains uphill and the circle starts anew? Except it’s the sun which is doing all the work here and the sun is definetly not radiating enough energy on this planet to explain it’s surface temperature.
In reality there is the Stefan-Boltzmann law which describes the radiative heat transfer between everything. Your thermalised CO2 molecules warm the surrounding air … what is the emissivity of air?
One paper, Seb
or remain PATHETIC.
Johannes, below 11 km with rising pressure, thermalization becomes ever more probable compared to dethermalization. Meaning: It becomes more likely that a CO2 gives its energy to another air molecule before it can emit a IR photon.
The warming of the air molecules then accelerates the convective cycle. BUT, as CO2 is the bit player that it is, it is probably an unmeasurable effect (too small S/N ratio)
“as CO₂ is the bit player that it is, it is probably an unmeasurable effect”
Added CO₂ actually increases the lapse rate by a tiny tiny amount… everything probably just cancels out. 🙂
dry lapse rate = g/specific energy
Since the specific energy of CO₂ is less than air, added CO₂ decreases specific energy (by a tiny amount), hence increases lapse rate… theoretically. 😉