Professor: Climate Journalism Awash In
‘Emotional Propaganda’, ‘Mythological Constructs’
Too Much Reliance On Models, ‘Consensus’
A University of Wollongong (Australia) investigative journalism professor with a research interest in ecological science and exposing environmental fraud has just published a scathing indictment of the climate science journalism industry in the academic journal Asia Pacific Media Educator.
Pulling no punches, Dr. David Blackall lambastes the modern climate science journalism practice of relying more on theoretical models, “expert” predictions, and authoritative “consensus” than on empirical observation and real-world physical measurements in reporting stories on global warming.
Instead of evaluating alarming claims of impending climate catastrophe with reasonable skepticism and critical review, today’s journalists not only reflexively accept the planetary meltdown narratives they promulgate, they simultaneously conceal the growing body of scientific evidence that may ameliorate the scariness of the modern climate narrative.
Journalists Refuse To Report Non-Alarmist Scientific Evidence
(1) Multiple papers have been published within the last year (Turner et al., 2016, Oliva et al., 2017) indicating that the rapid warming trend observed during the late 20th century for the Antarctic Peninsula (AP) has now reversed, and the AP has been dramatically cooling (-0.47 °C per decade) and glaciers have stopped receding in the region since 1999. This cooling trend has not been reported by mainstream media outlets.
(2) Earlier this year, a paper (Fettweis et al ., 2017, with a review available here) was published in The Cryosphere indicating that the Greenland Ice Sheet melt had (a) contributed just 1.5 cm (0.6 of an inch) to sea levels between 1900 and 2010; (b) there was no net ice sheet loss during the 60 years between 1940 and 2000 despite explosive growth in anthropogenic CO2 emissions during that period; and (c) net ice sheet losses were similar to today during the 1930s, when CO2 concentrations were about 100 ppm lower. This long-term Greenland Ice Sheet mass balance in an era of “alarming” warmth has not been reported by mainstream media outlets.
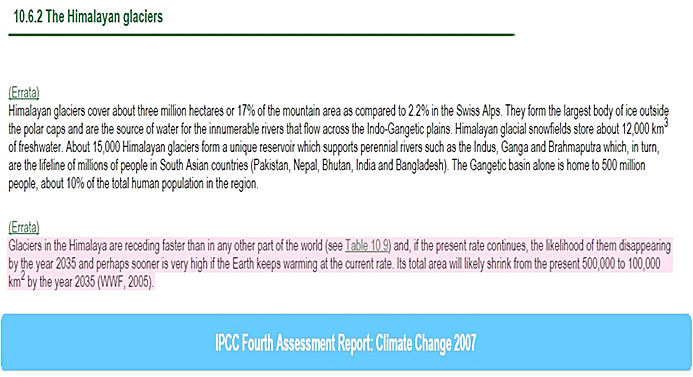
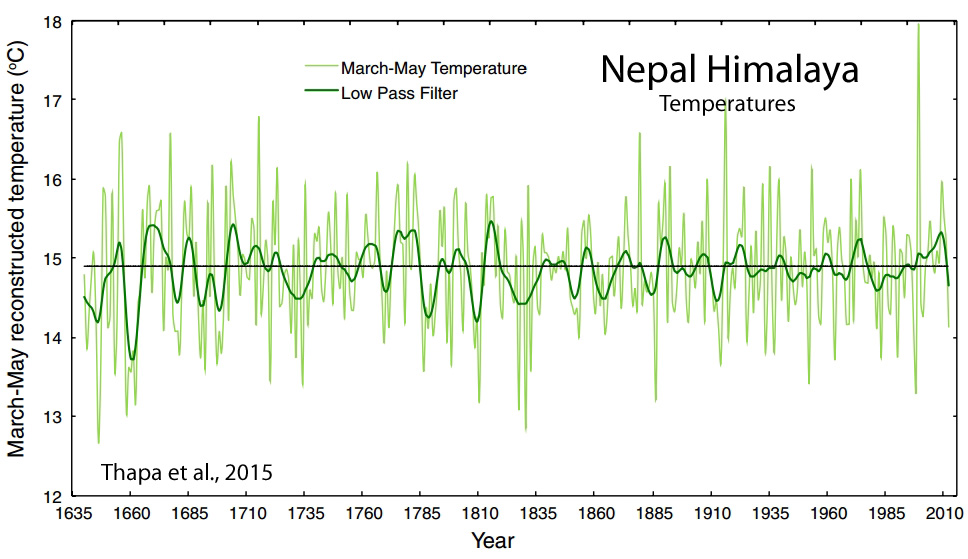
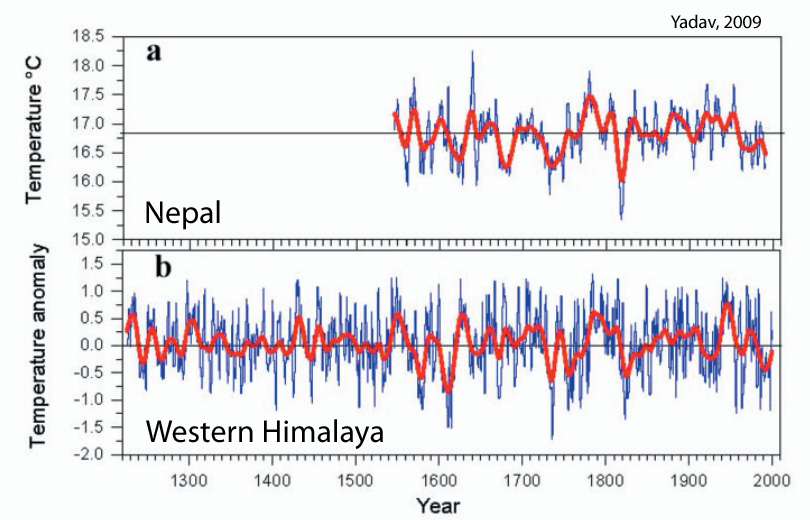
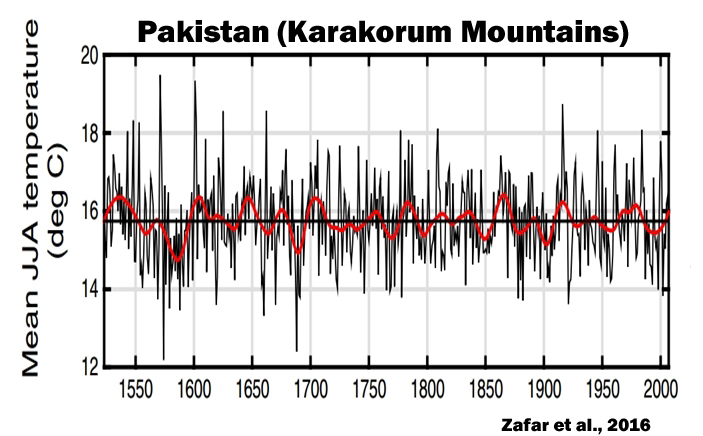
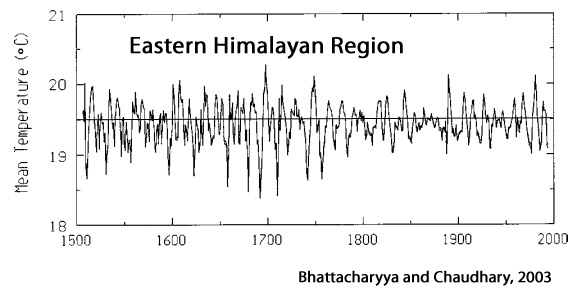
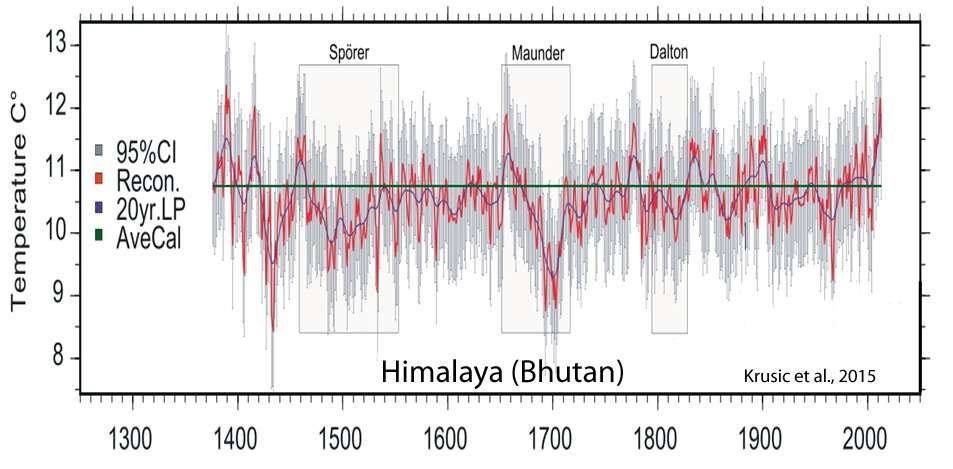
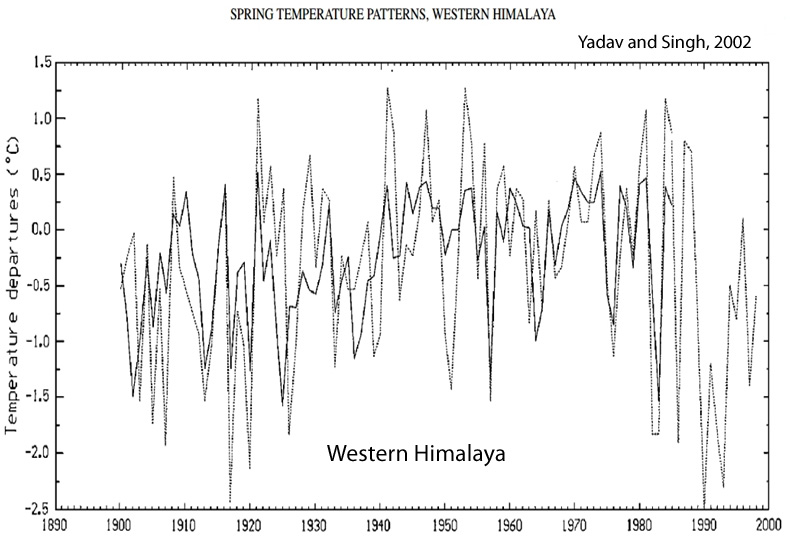
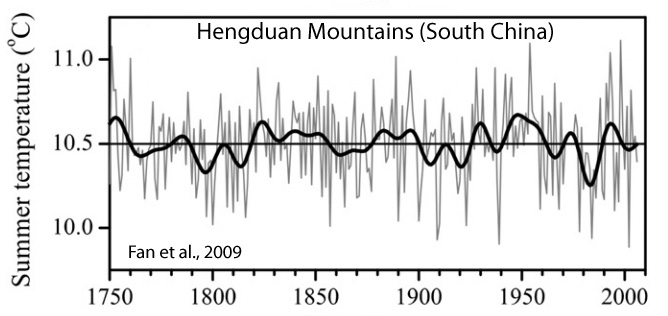
(3) In the 2007 IPCC report, it was claimed that glaciers in the Himalayas were melting so rapidly that the “likelihood is very high” that they would “disappear” by the year 2035. And yet many published scientific papers have shown (here, here, here, here, here, here, and here) that the Himalayan region has not only not been warming in recent decades, but 88% of the glaciers in the region are either stable or advancing, with a net change of just 0.2% since 2000 (Bahuguna et al., 2014, Bolch et al., 2016, Holzer et al., 2015, Zhang et al., 2016).
(4) About a year ago, a NoTricksZone review of 8 recently published scientific papers revealed (a) land area across the world is expanding more rapidly than sea levels are rising; (b) climate change (warming) is not the primary determinant of sea level changes (coastal erosion and accretion, tectonic uplift and subsidence are more influential); (c) globally, sea levels are only rising by about 1 mm per year according to tide gauges; and (d) an anthropogenic signal could not be detected in regional sea level rise trends. Of course, no mainstream media outlet publicized these scientific findings. They don’t support the alarmist narrative.
(5) There were 133 peer-reviewed scientific papers published in 2016 linking solar forcing to climate changes. There have already been 84 Sun-Climate papers published thus far in 2017. More and more solar scientists are predicting a Grand Solar Minimum and concomitant global cooling in the coming decades. Journalists have not been inclined to report on these developments in solar science. The Sun-Climate link does not fit with narrative that humans are the predominant cause of climate changes.
(6) Finally, a collection of over 300 graphs of reconstructed historical (Holocene) temperatures has been made available in recent months. These graphs, taken from hundreds of peer-reviewed scientific papers, reveal that modern warming trends are neither unusual or unprecedented, and they do not even fall outside the range of natural (pre-anthropogenic influence) variability. And yet what do mainstream journalists report in their headlines on a routine basis? That today’s temperature changes are “shocking”, “stunning” and “unprecedented”.
Would it be so difficult for journalists to actually seek scientific verification of their claims before publishing?
Or is the pursuit of real-world scientific confirmation too much to expect from journalists and media sources bent on advancing an agenda in this “Post Truth World”?
Blackall, 2017
‘Forlorn’ Polar Bears An Example of ‘Emotional Propaganda’, ‘Fake News’ Reporting
“One particularly emotive story line attached to this topic is the so-called pending extinction of the polar bear (Ursus maritimus) population. In recent times, there have been a number of claims that polar bears are threatened with extinction because global warming was melting their habitat. Yet the scientific evidence suggests to the contrary: population counts conducted between 2007 and 2017 suggest that bear numbers are on the increase. This has led Crockford (2017a) to label such claims as emotional propaganda. In the last decade, cherrypicked and unverified photographic material, ‘emotional’ videos, even animation, then used in news, of forlorn bears floating on ice was the practice (Crockford, 2016; Rode, 2014). This is a good example of ‘fake news’.”
Climate Models Not Confirmed, Harmonious Pre-Industrial Climate A ‘Mythical Construct’
“Scientific uncertainty arises from ‘simulations’ of climate because computer models are failing to match the actual climate. This means that computer models are unreliable in making predictions. Published in the eminent journal Nature (Ma, et. al., 2017), ‘Theory of chaotic orbital variations confirmed by Cretaceous geological evidence’, provides excellent stimulus material for student news writing. The paper discusses the severe wobbles in planetary orbits, and these affect climate. The wobbles are reflected in geological records and show that the theoretical climate models are not rigorously confirmed by these radioisotopically calibrated and anchored geological data sets. Yet popular discourse presents Earth as harmonious: temperatures, sea levels and orbital patterns all naturally balanced until global warming affects them, a mythical construct. Instead, the reality is natural variability, the interactions of which are yet to be measured or discovered (Berger, 2013).”
A Non-Warming Climate Doesn’t Fit The Narrative – So It’s Unreported, Manipulated
“Contrary to news media reports, some glaciers throughout the world (Norway [Chinn et al., 2005] and New Zealand [Purdie et al., 2008]) are growing, while others shrink (Paul et al., 2007). New Zealand’s National Institute of Water and Atmospheric Research and Victoria University found that ‘regional cooling’ over 25 years had correlated with growing glaciers (Mackintosh et al., 2017).”
“Sea levels too have not been obeying the ‘grand transnational narrative’ of catastrophic global warming. Sea levels around Australia 2011–2012 were measured with the most significant drops in sea levels since measurements began. This phenomenon was due to rainfall over Central Australia, which filled vast inland lakes. It was not predicted in the models, nor was it reported in the news. The 2015–2016 El-Niño, a natural phenomenon, drove sea levels around Indonesia to low levels such that coral reefs were bleaching. The echo chamber of news repeatedly fails to report such phenomena and yet many studies continue to contradict mainstream news discourse.”
Scientific Uncertainty Replaced By ‘Consensus’ (Post-Normal) Science, Model ‘Validation’
“Scientists test, measure, observe and retest, and they must be able to verify and repeat results (Errington et al., 2014). Uncertainty is always present (van Der Sluijs, 2005), but when uncertainty is replaced by ‘consensus’ (post-normal science), a culture of gatekeeping ensues (Lindzen, 2009). Post-normal science is said to be appropriate when ‘traditional methodologies are ineffective. In those circumstances, the quality assurance of scientific inputs to the policy process requires an ‘extended peer community’, consisting of all those with a stake in the dialogue on the issue’ (Funtowicz & Ravetz, 1993). Then, and dangerously, dissenters are silenced so that chosen and ‘necessary’ discourses arrive in journals, conferences and boardrooms. In such a climate, it is difficult for the assertion to be made that there might be other sources, than a nontoxic greenhouse gas called carbon dioxide (CO2), that could be responsible for ‘climate disruption’. A healthy scientific process would allow such a proposition.”
“Journalism conveys a ‘professional authority’—touting its discourse as ‘fact checked’, within ‘editorial consensus’—its validation process. However, ‘validation’ in climate science means something completely different—a model is validated, ‘acceptable for its intended use’, because it meets specified computer performance requirements (Rykiel, 1996).”
Correcting Climate Journalism’s ‘False Narratives’: Offer Public Alternative Perspectives
‘An online survey revealed similarity between climate change deniers and believers in terms of preference for climate change news sources and rating of reliability of authorities. It was also discovered that both groups do not believe in conspiracy theories. Thus the results show that participants on both sides in the discussion on climate change are similar, rational, and are basing their judgments by using similar types of sources.’ (Grabbe, 2015)
“As there is uncertainty with greenhouse gas theory, students should be given alternative perspectives to help find ways to publish stories that question, challenge and enlighten. With technological change in the traditional newsroom, which brings ‘heightened accountability’ (Bivens, 2008), and instantaneous research capability, there are plenty of opportunities to correct false narratives.”
An Alternative Perspective Example: Clouds As Climate Control Mechanism
“One avenue is to suggest the alternative narrative: clouds are crucial in climatic control, yet their role and production is not thoroughly understood. Clouds control terrestrial and ocean surface temperatures and this has been known for decades—in agronomy, geography and meteorology. Could the great environmental catastrophe instead involve clouds and the water cycle?”
20+ New Papers Affirm The Failures Of Climate Modeling
Hedemann et al., 2017 (full paper)


Nice fishing line, rod and sinker. 😉
I wonder what you will catch 🙂
https://s19.postimg.org/46rxylh4j/dopey_fish.jpg
Let’s see if I’m right:-)
Over at Real Climate, I have been beating up Jim “the lying misleading snake” Hunt over his vapid,dishonest comments over sea ice levels.
Example,which should interest Kenneth Richards personally, since he was accused of creating a chart out of thin air, for the Stein et al paper. Jim Hunt claims he read the paper,says no such chart exist that you posted Andy.
First the background:
Jim Hunt says:
August 2, 2017 at 9:26 pm
AndyG – Intriguingly your diagram is nowhere to be seen in Stein et al. 2017.
Where did you find it?”
“sunsettommy says:
August 2, 2017 at 11:45 pm
Jim, the chart is from Sein et all paper. It says so right there on the chart, Andy posted.
You are reading challenged…..
Jim Hunt says:
August 3, 2017 at 11:45 am
Tommy – I’ve read Stein et al.
Evidently you have not!”
https://realclimatescience.com/2017/08/updated-ice-free-arctic-forecast/#comment-58158
Scroll down after you read his comment for the replies to him.
Since I know from my own eyes that it is located at page NINE of the paper,heck you can see it yourself,why I can call Jim Hunt a LIAR!
I even posted it further down in the comment thread,but here it is for readers here:
https://images.readcube-cdn.com/prerendered/5e2c0c061617232eb19db9f2d33a31da48223949291b7c52e42642b64193912d/9.jpg
The main link of the paper when you can see for yourself,
http://onlinelibrary.wiley.com/wol1/doi/10.1002/jqs.2929/full
scroll down to preview the paper where on page nine is the chart Kenneth had lifted from.
Jimbo is even more of a brain-washed, brain-addled anti-science, lying prat than seb is.
You really like those “victory dances” about nothing …
Do you know who Jim Hunt is,Seb?
Jimbo lies and distorts science even more than you do.
And he is almost as wilfully ignorant as you.
But at least he only yaps meaninglessly for a line or two, rather than the monotonous, continuous, attention-seeking yapping we get from you.
You don’t even realize that you are the ignorant (and impolite) person here with the monotonous comments saying nothing at all …
You do realise that you are TOTALLY UNABLE to back up even the most basic farce of the AGW scam… Don’t You.
EMPTY comments… that’s your speciality.
You are the impolite and dishonest one, with your constant monotonous, and VERY EMPTY, Chihuahua-like yapping/trolling for attention.
You could just NOT post.. but your ADD would suffer.
Thanks for this. Many many alarmist followers (sheep) ask sceptics to produce PR’d references for their scepticism. This is a great page to throw at them. I also usually point them to the NIPCC report, as that has a significantly higher % of PR’d papers than the IPCC ones (I thank Donna Laframboise’s “…Delinquant Teenager…” book for that).
Terrific summary. Paper needs much wider exposure. Bookmarked for much future reference.
This has been clear to me for decades. Once the media lost it’s professionalism the die was cast.
Climate Science and Politics are both victims of this at a massive scale. I am sure other issues have also fallen victim as well. (Nuclear Energy, GMO foods, Capitalism etc)
So how long is David Blackall going to keep his job?
They got rid of Murry Salby pretty quickly.
Sadly, Dr. Blackall is retiring.
http://quadrant.org.au/opinion/qed/2017/08/amazing-worthwhile-journalism-academic/
“I’m packing up my office right now,” he tells Quadrant Online. “I haven’t had any backlash, even though the climate debate seems to be getting increasingly toxic and nasty. Younger academics can’t call out the fake news on climate like I can, because they’d risk their jobs and mortgages.”
“It is my responsibility to provide my students with the research skills they need to question – and test – the arguments put forward by key players in any debate. Given the complexity of the climate warming debate, and the contested nature of the science that underpins both sides, this will provide challenges well into the future. It is a challenge our students should relish, particularly in an era when they are constantly being bombarded with ‘fake news’ and so-called ‘alternative facts’.
He argue[s] that without acutely educated scepticism, journalism graduates fall prey to the seductive and political tune of the dog whistle, such as believing the myth of a ‘climate consensus’.
How many of these are IPCC acceptable reports for the nect AR?
How would the screening process keep them out of review?
The very role of a scientist is to be skeptical.
Excellent work Blackall.
PS Peter Hannam the environment reporter at SMH has qualifications as a
…. guess what?? Social Worker.!!!
Just a link to a site which may be of interest to those who react to Trolls on this and other blogs.
https://www.dailydot/via/phillips-dont-feed-trolls
Title ‘Don’t Feed the Trolls? It’s not that simple.’
“Even if a person avoids feeding the trolls(and/or the person accused of trolling) he or she is still playing into the aggressor’s hands. It is the aggressor’s game and the aggressor’s rules…. the target is little more than a plaything”
I hope it helps otherwise the blog gets almost boring for the real people reading it. I like this blog, by the way, when I understand it and if I don’t understand I try to keep quiet . Si tacuisses philosophus mansisses.