Source: press release for Myers et al., 2015
Sea Levels 2-4 m Higher Until ~5,000 Years Ago
Imply Surface Temps Were At Least 5°C Warmer
According to the accepted (IPCC) formula for calculating the contribution of ocean warming (thermal expansion) to sea level rise upon reaching equilibrium, every additional degrees Celsius of surface warmth yields about 0.4 meter (0.2 to 0.6) to global sea levels.
Moore et al., 2013 “The equilibrium sea level change from thermal expansion alone has been estimated to be ~0.2–0.6 m/°C” (Meehl et al., 2007b).
IPCC AR5: “The amount of ocean thermal expansion increases with global warming (0.2 to 0.6 m/°C–1)”
Considering that much of the globe had sea levels that reached or exceeded 2 to 4 meters above present during the Early to Mid Holocene (~10,000 to ~5,000 years ago), a conversion of 0.4 m/°C (from thermal expansion alone) would indicate that surface temperatures were at minimum 5°C warmer than now during the first half of the Holocene. There are many paleoclimate reconstructions of surface temperatures that substantiate such high levels of warming during this period (illustrated below).
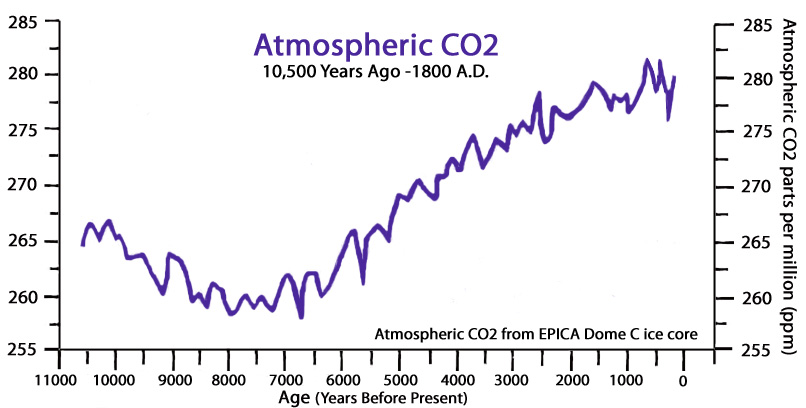
It should be noted that during the Early to Mid Holocene, Earth’s CO2 concentrations were only hovering around 260 ppm to 265 ppm – about 140 ppm lower than today’s values (over 400 ppm).
When we consider that 93% of the Earth’s heat is contained in the oceans, which is symbiotically connected to sea level rise and fall via thermal expansion, we can affirm that both surface temperatures and sea levels can and do rise and fall without any meaningful contribution from the atmospheric CO2 concentration. Therefore, it can be concluded that other internal mechanisms, and not CO2 concentrations, are the driving influence impacting both surface temperatures and sea levels.
![]()
Argentina, 3-5 meters higher than present, Bini et al., 2017
“The main conclusion is that the relative sea-level between c. 7000 and 5300 cal. yr BP was in the range of c. 2–4 m a.s.l. [above present mean sea level], with a mean value of c. 3.5 m a.s.l. … Initial glacio-hydro-isostatic models of the Patagonian coast [Argentina] suggested that the shoreline could be characterized by currently raised beaches, which started to form as soon as ice-sheet melting ceased (Clark et al., 1978). A more recent model (Milne and Mitrovica, 2008) predicted that RSLs might have exceeded present by c. 5 m at 6000 cal. yr BP. [T]he altimetric and chronological data of the valleymouth terraces show a highstand between c. 7000 and 6600 cal. yr BP at c. 4 m a.s.l. [4 meters above present mean sea level], followed by a progressive fall to c. 2–2.5 m between 6200 and 5300 cal. yr BP.”
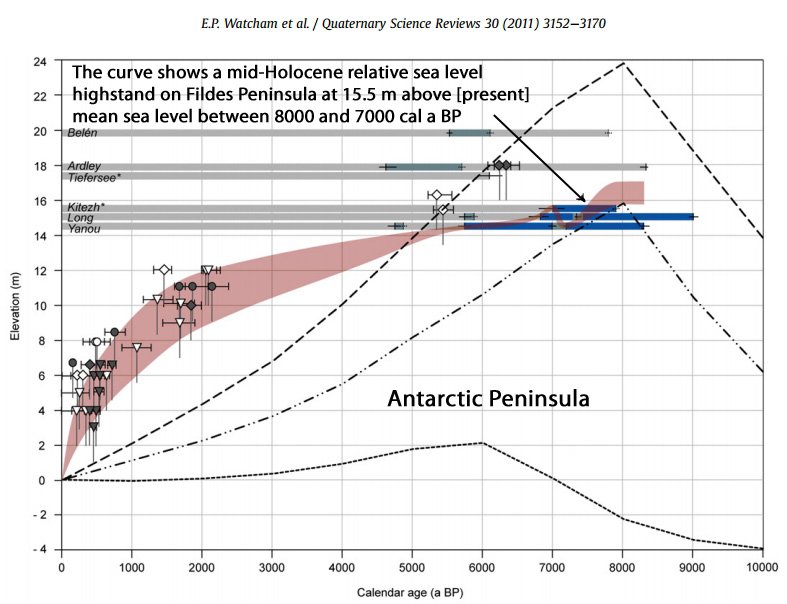
Antarctic Peninsula, 15.5 meters higher than present, Watcham et al., 2011
“The curve shows a mid-Holocene RSL highstand on Fildes Peninsula at 15.5 m above mean sea level between 8000 and 7000 cal a BP.”
South Africa, 3.5 meters higher than present, Lecea et al., 2017
“Ramsay (1995) produced a 9 kyr BP record of sea-level changes from the South African east coast, that showed sea levels reached a high stand of +3.5 m [above present] at 4.65 kyr BP [4,650 years ago]. … In Mozambique, Norström et al., (2012) identified a sea-level highstand ~3 m above present at ~ 6.6 kyr BP.”

Western India, 2 meters higher than present, Das et al., 2017
“In the absence of any evidence of land-level changes, the study suggests that at around 6 ka to 3 ka [6,000 to 3,000 years ago], the sea was approximately 2 m higher than present.”
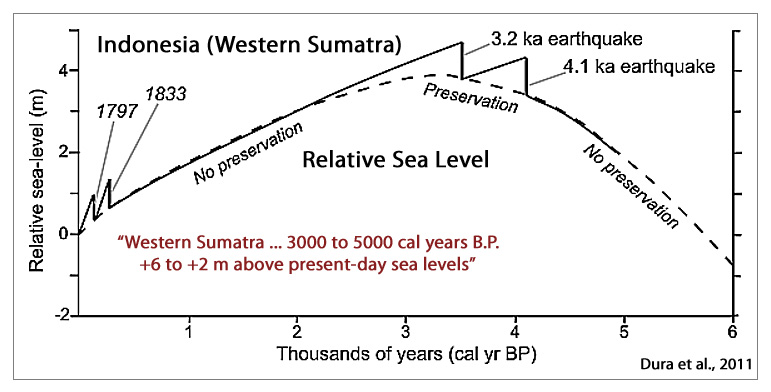
Western Sumatra, Indonesia, 2-6 meters higher than present, Dura et al., 2011
“A prominent feature of southeast Asia Holocene sea level records is the mid-Holocene highstand [Geyh et al., 1979; Tjia, 1996; Scoffin and Le Tissier, 1998; Hanebuth et al., 2000], which in Western Sumatra, varies in timing and magnitude from 3000 to 5000 cal years B.P., and +6 to +2 m above present-day sea levels [Horton et al., 2005].”
Denmark, 2.2 meters higher than present, Sander et al., 2016
“The data show a period of RSL [relative sea level] highstand at c. 2.2 m above present MSL [mean sea level] between c. 5.0 and 4.0 ka BP [5,000 to 4,000 years before present].”
Africa, 3.5 meters higher than present, Accordi and Carbone, 2016
“Then, the skeletal carbonate storage on the shelf reached its maximum 5 to 4 ka BP [5000 to 4000 years before present] (Ramsay, 1995) during a highstand about 3.5 m above the present sea level, when shallow marine accommodation space was greater than at present.”

Brazil, 4 meters higher than present, Spotorno-Oliveira et al., 2016
“The transgressing sea rapidly rose until reaching the ~ +4 m highstand [above present] level around 5000 years BP.”
Bangladesh, 4.5-5 meters higher than present, Rashid et al., 2012
“The abundant marine diatoms and mangrove pollens indicate the highest RSL [relative sea level] transgression in Bangladesh at approximately 6000 cal BP, being at least 4.5 to 5 m higher than the modern m.s.l. [mean sea level]. … [T]he present shoreline of Bangladesh was established at approximately 1500 cal BP and has not noticeably migrated inland since.”
China, 2-4 meters higher than present, Bradley et al., 2016
“In general, the data indicate a marked slowdown between 7 and 8 kyr BP, with sea level rising steadily to form a highstand of ~2-4 m [above present sea level] between 6 and 4 kyr BP [6000 and 4000 years before present]. This is followed by a steady fall, reaching present day levels by ~1 kyr BP.”

East Antarctica, 8 meters higher than present, Hodgson et al., 2016
“The geological data imply a regional RSL [relative sea level] high stand of c. 8 m [above present levels], which persisted between 9411 cal yr BP and 7564 cal yr BP [calendar years before present].”

![]()
Argentina, Uruguay, 4 – 6.5 meters higher than present, Prieto et al., 2016
“Analysis of the RSL [relative sea level] database revealed that the RSL [relative sea level] rose to reach the present level at or before c. 7000 cal yr BP, with the peak of the sea-level highstand c. +4 m [above present] between c. 6000 and 5500 cal yr BP [calendar years before present] … This RSL [relative sea level] curve was re-plotted by Gyllencreutz et al. (2010) using the same index points and qualitative approach but using the calibrated ages. It shows rising sea-levels following the Last Glacial Termination (LGT), reaching a RSL [relative sea level] maximum of +6.5 m above present at c. 6500 cal yr BP [calendar years before present], followed by a stepped regressive trend towards the present.”

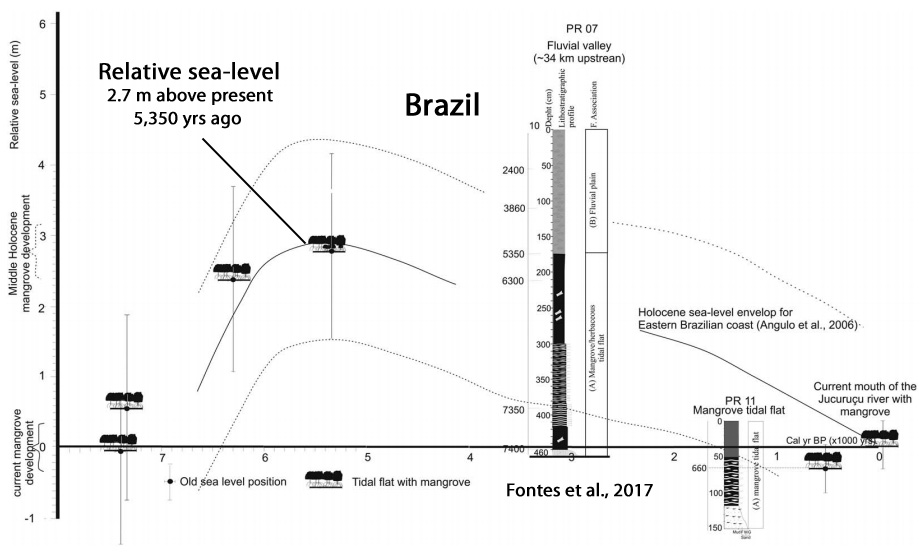
Brazil, 2.7 meters higher than present, Fontes et al., 2017
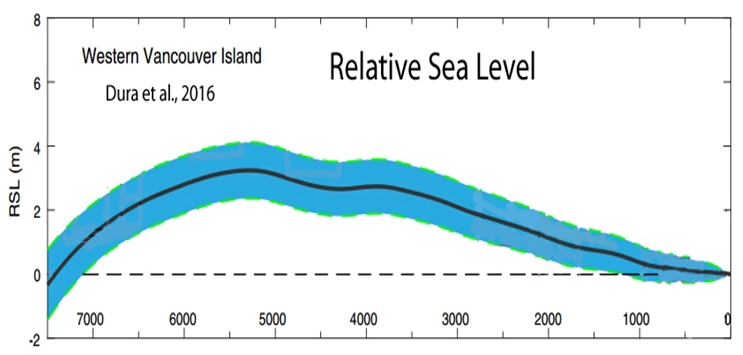
Vancouver, 1-3 meters higher than present, Dura et al., 2016
“RSL [relative sea level] highstand of <1 m (northern Sumatra) and ∼3 m (western Sumatra) between 6 and 3 ka [6,000-3,000 years ago].”
Thailand-Malaysia, 4-5 meters higher than present, Marwick et al., 2017
“Sinsakul (1992) has summarised 56 radiocarbon dates of shell and peat from beach and tidal locations to estimate a Holocene sea level curve for peninsula Thailand that starts with a steady rise in sea level until about 6 k BP, reaching a height of +4 m amsl (above [present] mean sea level). … Tjia (1996) collected over 130 radiocarbon ages from geological deposits of shell in abrasion platforms, sea-level notches and oyster beds and identified a +5 m [above present] highstand at ca. 5 k BP in the Thai-Malay Peninsula.”
Japan, 2.7 meters higher than present, Yokoyama et al., 2016
“The Holocene-high-stand (HHS) inferred from oyster fossils (Saccostrea echinata and Saccostrea malaboensis) is 2.7 m [above present sea level] at ca. 3500 years ago, after which sea level gradually fell to present level.”
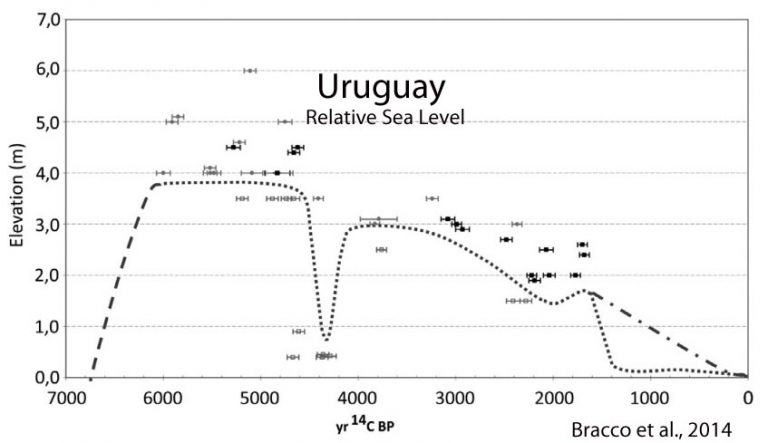
Uruguay, 3-4 meters higher than present, Bracco et al., 2014
“We present a sea level change curve for mid Holocene in Uruguay. Sea level reached 4 m amsl [above present mean sea level] between 6000 and 5500 yr BP [before present]. A rapid sea level fall to about 1 m amsl [above present mean sea level] was inferred for 4700-4300 yr BP. A further sea level increase to about 3 m amsl [above present mean sea level] was inferred after 4300 yr BP. After 4300 yr BP there was a constant sea level a decline.”
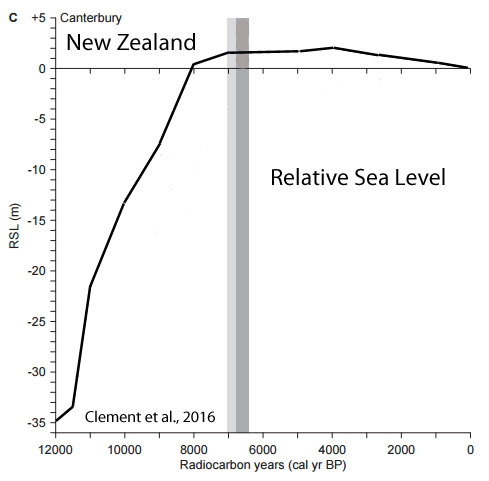
New Zealand, 2.75 – 3 meters higher than present, Clement et al., 2016
“In North Island locations the early-Holocene sea-level highstand was quite pronounced, with RSL [relative sea level] up to 2.75 m higher than present. In the South Island the onset of highstand conditions was later, with the first attainment of PMSL being between 7000–6400 cal yr BP. In the mid-Holocene the northern North Island experienced the largest sea-level highstand, with RSL up to 3.00 m higher than present.”
Eastern Australia, 2 meters higher than present, Macreadie et al., 2015
“[R]esults from other studies … suggest that high-stand, at perhaps 2 m above present msl[mean sea level] was achieved as early as 7000 radiocarbon years BP [before present](7800 cal. years BP) and that sea-level has exceeded the present value for much of the mid- to late-Holocene [~7000 to ~1000 years ago].”
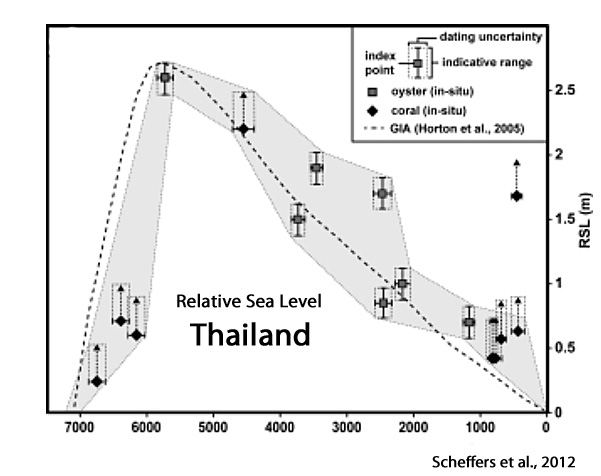
Thailand, 1.5-3.0 meters higher than present, Scheffers et al., 2012
“Nevertheless, those from the Laem Son coral profile, as well as those from oysters in the Phang-nga Bay show the same trend and maximum altitude lower than +3 m compared with modern RSL (Figure 6a); the maximum of +2.5–3.0 m was timed to c. 5700 cal. BP. … [W]e tentatively deduce a highstand around 5300 BP in the order of +1.5–2.5 m above [present] RSL [relative sea level]”
Kuwait, Qatar, Abu Dhabi, Arabian Gulf, 2-4 meters higher than present, Reinink-Smith, 2015
“[A]ssuming the tidal ranges were similar in the middle Holocene, a rough estimate of the MSL [mean sea level] during the middle Holocene highstand is 5.2 m − 1.7 m = +3.5 m above the present MSL [mean sea level]. … The +3.5 m highstand estimate in northeastern Kuwait derived in this study is also higher than the previously reported maximum estimates of +2 to +2.5 m responsible for other Holocene beach ridges in the Arabian Gulf (Gunatilaka, 1986; Lambeck, 1996; Kennett and Kennett, 2007; Jameson and Strohmenger, 2012). Some beach ridges in Qatar and Abu Dhabi are at elevations of 2–4 m above MSL [present mean sea level] as far as 5-15 km inland (Alsharhan and Kendall, 2003).”
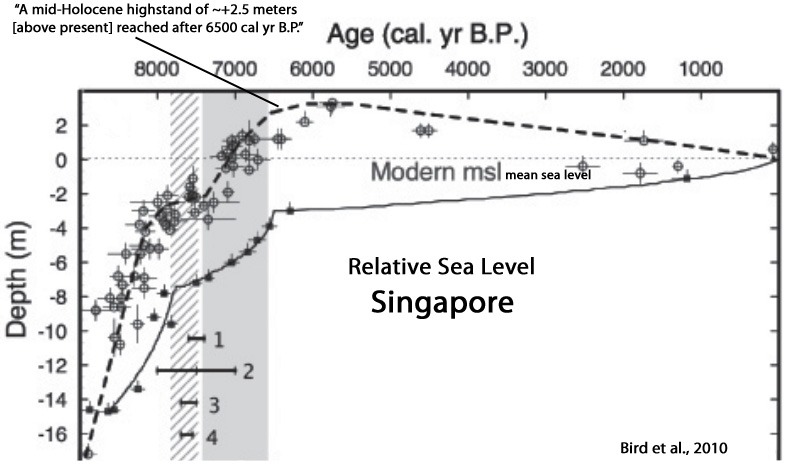
Singapore, 2.5 meters higher than present, Bird et al., 2010
“The sea-level curve, corroborated by the indpendent proxy records, suggests rapid rise at a rate of 1.8 m/100 yr until 8100 cal (calibrated) yr B.P., a near cessation in the rate of sea level rise between 7800 and 7400 cal yr B.P., followed by a renewed rise of 4–5 m that was complete by 6500 cal yr B.P [0.5 m/100 yr]. … A mid-Holocene highstand of ~+2.5 m [above present] was reached after 6500 cal yr B.P., followed by a lowering, with mangroves prograding over the core site by ca. 1000 cal yr B.P.”
South Africa, 3 meters higher than present, Strachan et al., 2014
“The mid-Holocene highstands culminated in a sea-level maximum of approximately 3 m above mean sea level (MSL) from 7300 to 6500 cal years BP [calendar years before present] and of 2 m above MSL at around 4000 cal years BP.”
Brazil, 1-4 meters higher than present, Hein et al., 2014
“Along the eastern and southern Brazilian coasts of South America, 6000 years of sea-level fall have preserved late-stage transgressive and sea-level highstand features 1–4 m above present mean sea level and several kilometers landward of modern shorelines.”

Reconstructions Of 4 – 6° C Warmer
Temps During The Last 10,000 Years
![]()
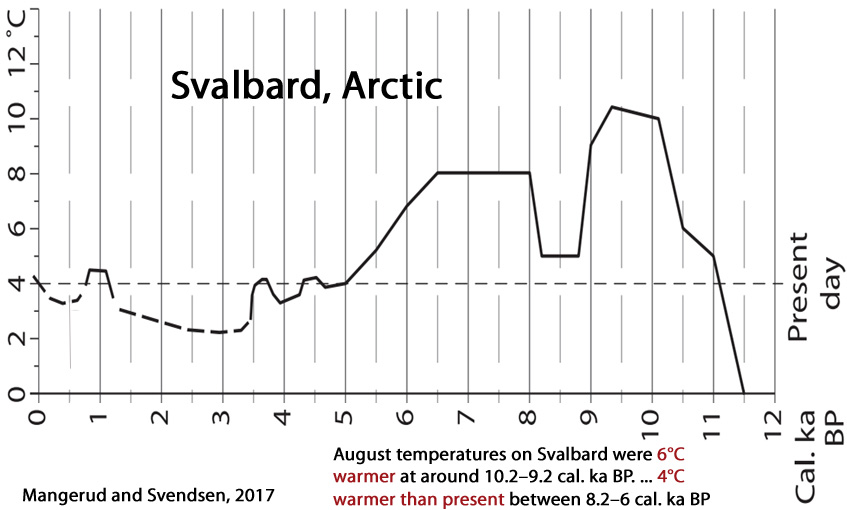
Svalbard, Arctic, 4-6°C Warmer Than Present, Mangerud and Svendsen, 2017
“August temperatures on Svalbard were 6°C warmer at around 10.2–9.2 cal. ka BP … 4°C warmer than present between 8.2 and 6 cal. ka BP”
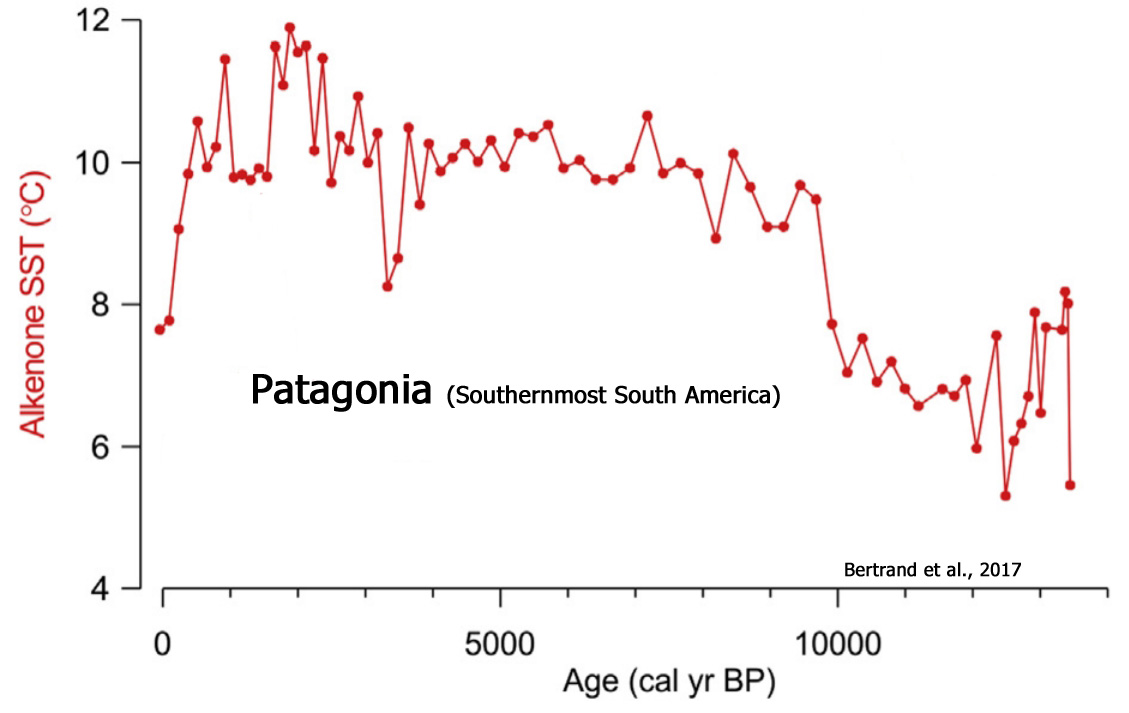
Patagonia, Southern South America, 3-4°C Warmer Than Present, Bertrand et al., 2017
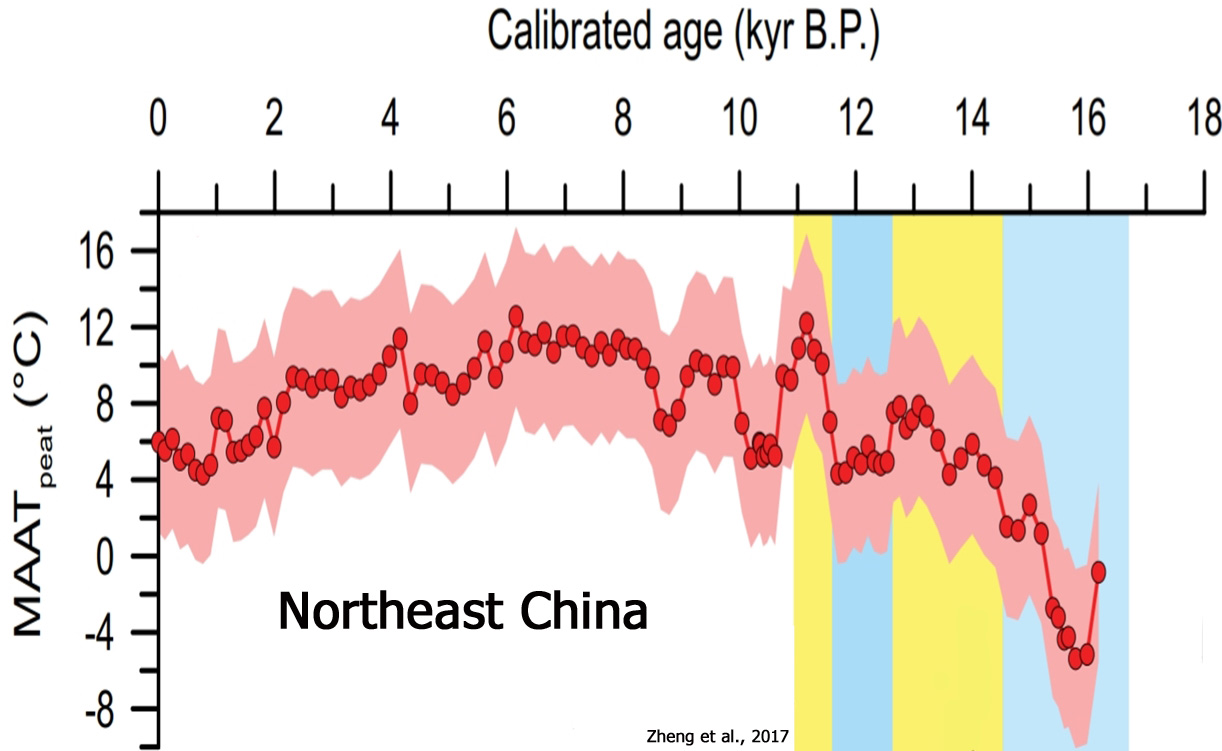
Northwest China, 5-6°C Warmer Than Present, Zheng et al., 2017
“From 11.5 to 10.7 ka [11,500 to 10,700 years ago], corresponding to the Preboreal event, MAATpeat indicates even higher [temperature] values, from 7.0 to 12 °C. MAATpeat continued to vary during the Holocene. From 10.7 to 6.0 ka, temperatures rose stepwise, with 2 cool events at 10.6–10.2 and 8.6 ka, before reaching maximum values of ~11 °C during the early Holocene from 8.0 to 6.0 ka. Following the early Holocene, temperatures at Hani gradually decreased to values of ~5 °C, close to the observed temperature at Hani across the past 60 yr (4–7.5 °C).”
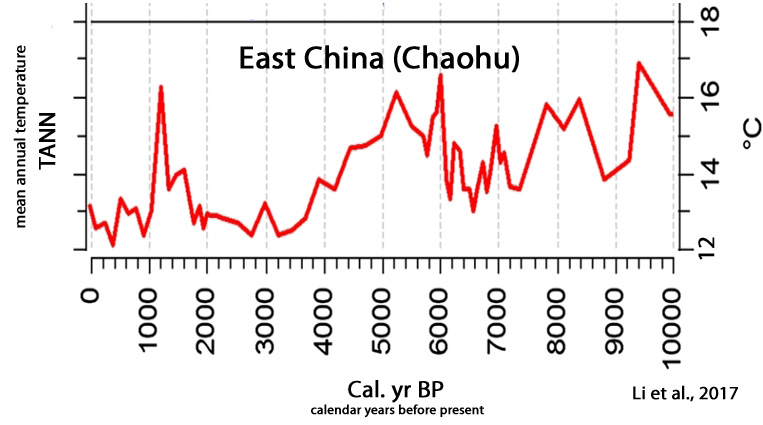
East China, 3-4°C warmer than present, Li et al., 2017
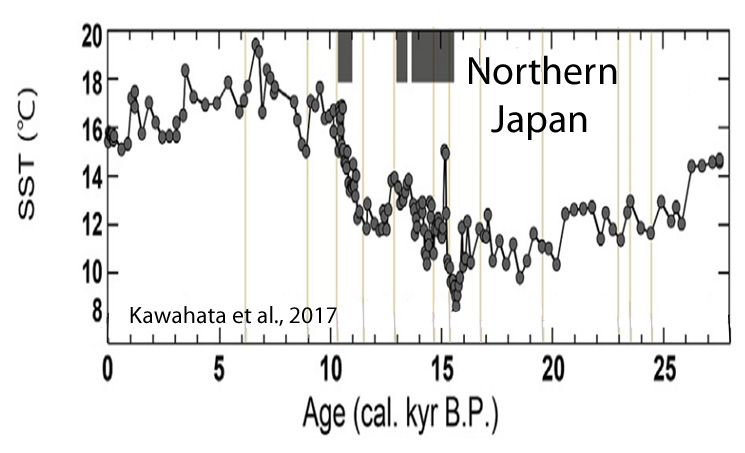
Northern Japan, 3-4°C warmer than present, Kawahat et al., 2017
“SST [sea surface temperatures] dropped by 3.5 °C [15.1 to 11.6 °C] within two centuries. Several peaks fluctuate by 2°C over a few centuries.”
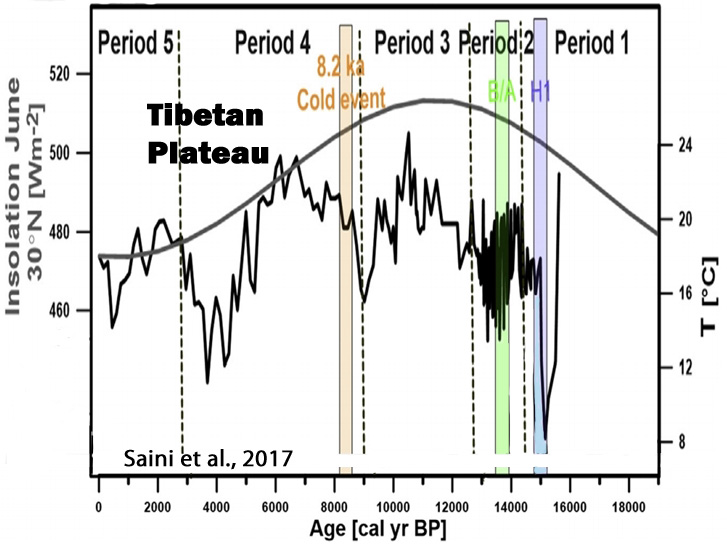
Tibetan Plateau, 4-5°C warmer than present, Saini et al., 2017
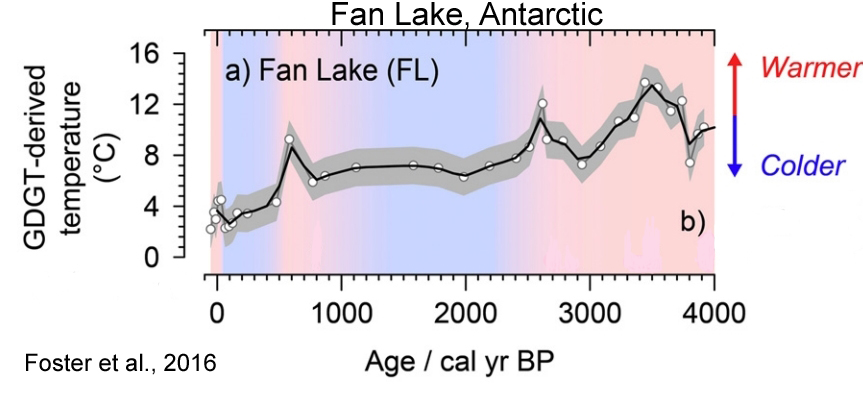
Fan Lake, Antarctica, 8°C warmer than present, Foster et al., 2016
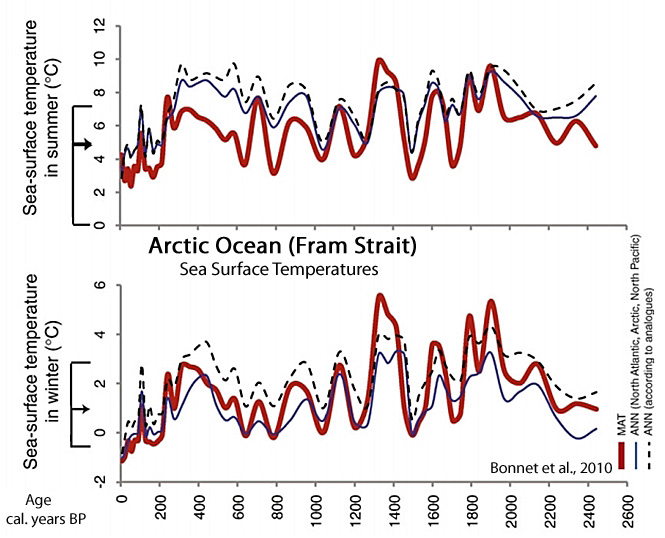
Arctic Ocean, 3-4 °C warmer than present, Bonnet et al., 2010
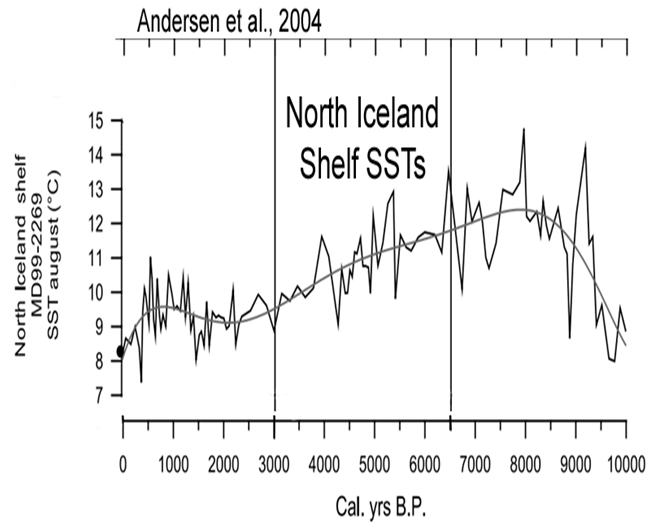
North Iceland, 5 °C warmer than present, Andersen et al., 2004
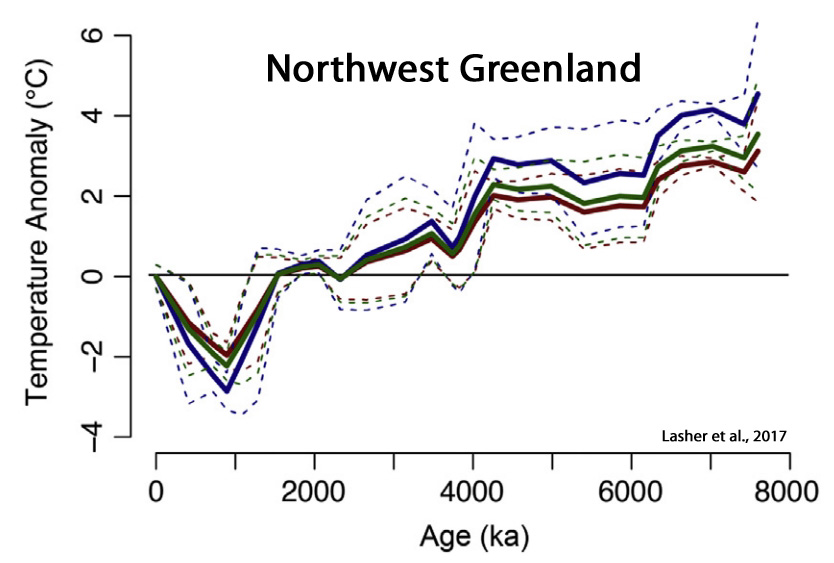
Northwest Greenland, 2.5-4 °C warmer than present, Lasher et al., 2017
“This paper presents a multi proxy lake record of NW Greenland Holocene climate. … Summer temperatures (2.5–4 °C warmer than present) persisted until ∼4 ka [4,000 years ago]
Antarctic Peninsula, 4-5°C warmer than present (1,000 years ago), Browne et al., 2017
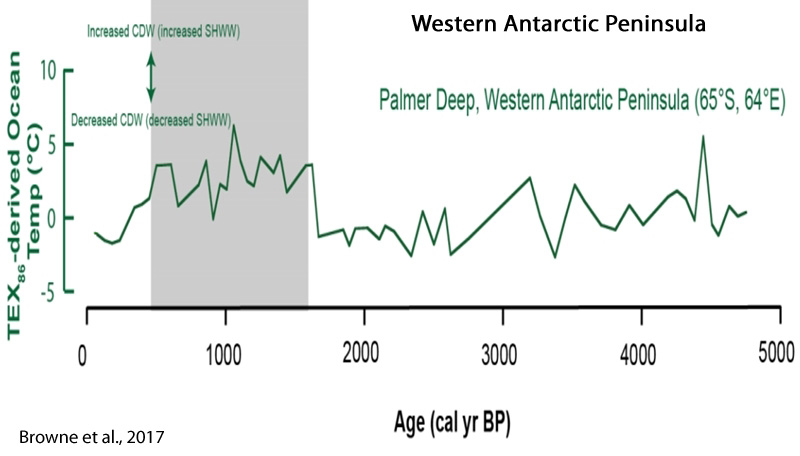
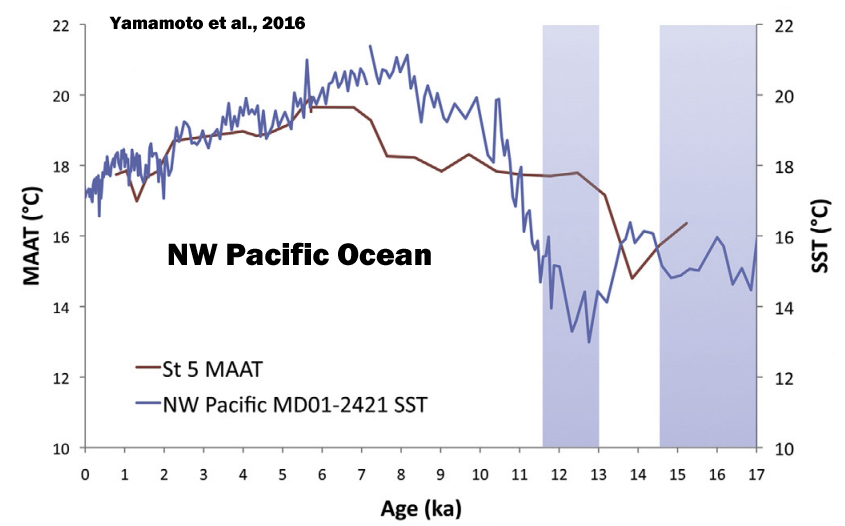
NW Pacific, 4 °C warmer than present, Yamamoto et al., 2016
![]()
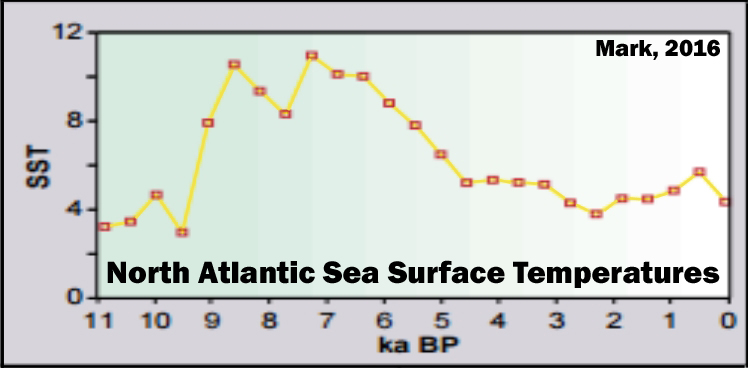
North Atlantic, 6°C warmer than present, Mark, 2016
Mediterranean Sea, 4°C warmer than present, Jalali et al., 2016

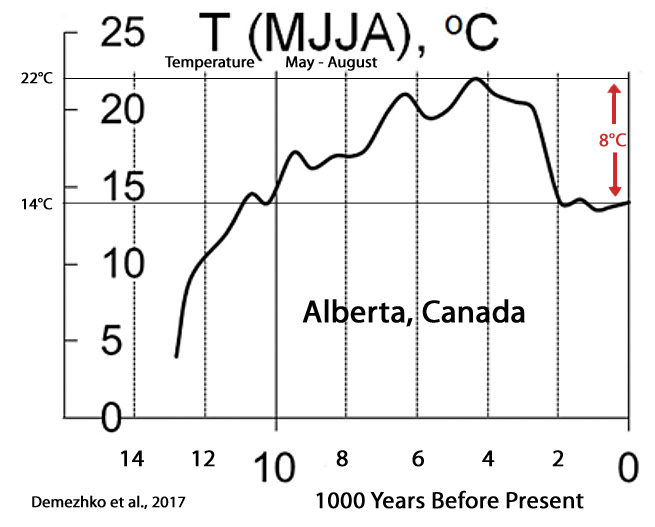
Alberta, Canada, 8°C warmer than present, Demezhko et al., 2017
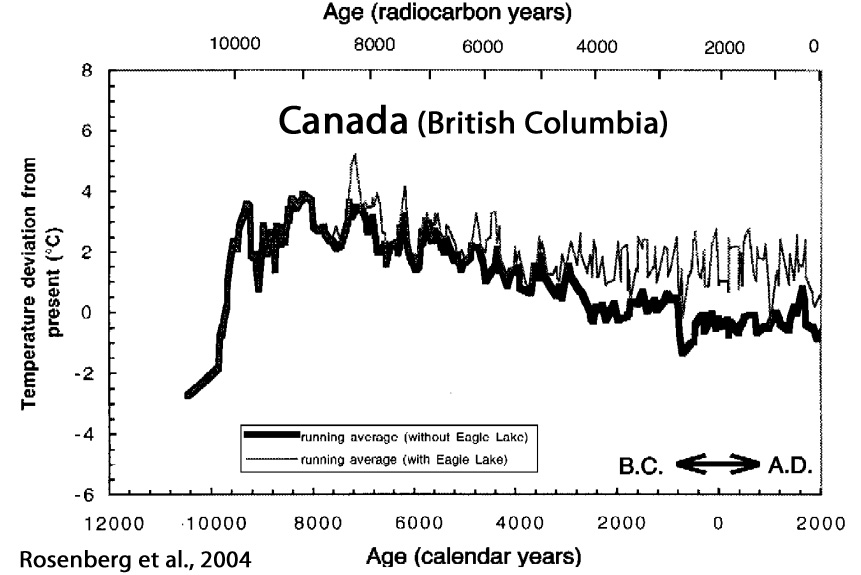
British Columbia (Canada), 3-4°C warmer than present, Rosenberg et al., 2004
East Greenland, 3-6 °C warmer than present, Lusas et al., 2017
“Air temperatures in Milne Land, west of our study area, based on preliminary estimates from chironomids, may have been 3–6°C warmer than at present (Axford et al. 2013)”
Russia, 2.5° to 7.0°C warmer than present, MacDonald et al., 2000
“Over most of Russia, forest advanced to or near the current arctic coastline between 9000 and 7000 yr B.P. and retreated to its present position by between 4000 and 3000 yr B.P. … During the period of maximum forest extension, the mean July temperatures along the northern coastline of Russia may have been 2.5° to 7.0°C warmer than modern.”
Antarctic Peninsula, 3.5 °C warmer than present, Mulvaney et al., 2012


OMG!!
It’s worse than we thought!!
We are all going to drown/fry/starve/freeze/get blown away/die of thirst if we don’t stop emitting CO2 NOW!!
SebastianH you were right all along.
Please accept my grovelling apologies
(sarc):-)
Thank-you Kenneth Richard,
A nice compilation.
I see that at any point in time across the globe the actual climate effects (SST, sea level variations) though coordinated are not synchronized.
Some much for homogenized data across large areas being meaningful.
Yes, just like today. The Arctic was cooling for 50 years (1940 to 1990) as Antarctica was warming (1950s to 1970s). In recent decades, those trends have reversed, with Antarctica and the Southern Ocean SSTs cooling as the Arctic warms. Arctic Canada hasn’t warmed in the last 150 years. There has been little to no warming in the Himalayas, New Zealand, Chile, Patagonia, the Arabian Sea for the last several hundred years. The global oceans have only warmed by 0.09 C (less than 1/10th of a degree) since 1955 in the 0-2000 m layer. During the Medieval Warm Period, the (0-700 m) oceans were 0.65 C warmer than today, and temperature fluctuations in the 0-1000 m layer would reach 2 degrees C in 200 years, which is 6 times the rate of modern times.
With regard to sea level changes, seas have risen at a rate of 0.17 of a meter per century since 1900. Compare that to 4-6 meters per century earlier in the Holocene, when CO2 concentrations were both low and stable.
During the last interglacial (~125 kya), sea levels have been assessed to be 20 meters higher than present.
During the Pliocene, when CO2 levels were lower than today, Arctic temperatures were 19 degrees C warmer than they are now. Somehow, polar bears survived.
In sum, nothing unusual is happening today relative to the past temperature trends or in the context of natural variability.
A very interesting and informative article. Thank you Kenneth. Your salient points are correct even if my contention of minor error is correct. I contend that the reliance on ice cores to estimate ancient CO2 concentrations is improper so your statements of CO2 levels are questionable. Maybe you could give us one your collections of works that show my contention. It would include Jaworowski and Segalstad on the ice core problems and Wallace on stomatta evidence of higher CO2 in the earlier Holocene and Beck on higher CO2 by chemical analysis more recently. I’m not a very good researcher and I bet you would find a lot more material along these lines.
Thanks again
Quite fair, DMA. I only use the “conventional” values for Holocene CO2 concentrations here because they, in this case, further establish that CO2 concentrations are not drivers of temperatures and sea levels even using “accepted” CO2 values.
For a summarizing write-up on the highly dubious CO2 values for the Holocene, see:
https://notrickszone.com/2017/06/29/evidence-review-suggests-humans-may-not-be-the-primary-drivers-of-co2-concentration-changes/
Evidence Review Suggests Humans May Not Be The Primary Drivers Of CO2 Concentration Changes
Jaworowski, 1997
http://www.21stcenturysciencetech.com/2006_articles/IceCoreSprg
The ice core data from various polar sites are not consistent with each another, and there is a discrepancy between these data and geological climatic evidence. One such example is the discrepancy between the classic Antarctic Byrd and Vostok ice cores, where an important decrease in the CO2 content in the air bubbles occurred at the same depth of about 500 meters, but at which the ice age differed by about 16,000 years. In an approximately 14,000-year-old part of the Byrd core, a drop in the CO2 concentration of 50 ppmv was observed, but in similarly old ice from the Vostok core, an increase of 60 ppmv was found. In about ~6,000-year-old ice from Camp Century, Greenland, the CO2 concentration in air bubbles was 420 ppmv, but it was 270 ppmv in similarly old ice from Byrd, Antarctica. … In the air from firn and ice at Summit, Greenland, deposited during the past ~200 years, the CO2 concentration ranged from 243.3 ppmv to 641.4 ppmv. Such a wide range reflects artifacts caused by sampling, or natural processes in the ice sheet, rather than the variations of CO2 concentration in the atmosphere. Similar or greater range was observed in other studies of greenhouse gases in polar ice.
Until 1985, the published CO2 readings from air bubbles in pre-industrial ice ranged from 160 to about 700 ppmv, and occasionally even up to 2,450 ppmv. After 1985, high readings disappeared from the publications.
Foscolos, 2010
https://ejournals.epublishing.ekt.gr/index.php/geosociety/article/view/11157/11208
http://blogs.sch.gr/sachinidi/files/2010/08/Climatic-Changes-Patra_2_v2.pdf
By the end of the 18th century eminent scientists explained the climatic changes on the basis of temperature and the ensuing glacial retreat. This disturbing observation led many prominent scientists to send air balloons equipped with special devices to trap air from the lower atmosphere in order to measure CO2 concentrations. Ninety thousand (90,000) measurements were carried out at 138 locations in 4 continents between 1810 and 1961. The data indicated that atmospheric CO2 concentrations, during the 19th century varied between 290 and 430 ppm (with an average of 322 ppm for the pre-industrial period). For the 20th century, the average concentration is 338 ppm when combined with comparable CO2 measurements carried out by Mauna Loa Observatory, Hawaii, USA (1958- 2000). Measurement precision is ±3%.
As far as CO2 concentration in the air’s atmosphere is concerned, it has been well documented that during the Holocene Epoch there is a substantial time lag between maximum temperatures recorded during the Interglacial periods and maximum CO2 concentrations in the atmosphere. Moreover, the same time lag is documented between 1850 and 1980, where CO2 concentrations in the atmosphere lag behind the increase of temperature for more than 100 years. A parallel increase of CO2 concentrations in the atmosphere and temperature increase is observed only between 1981 and 1995. No correlation is seen thereafter. The divergence is substantial from 2003 to the present where CO2 concentrations are increased while temperatures are decreased.
It is more than unsettling to have my (naive?) trust in Antarctic ice core studies challenged.
How bad is it? Do the studies need to be redone or is the problem “Adjustments” by the Climate Mafia?
Here are two papers that I have relied on:
Luethi, D., M. Le Floch, B. Bereiter, T. Blunier, J.-M. Barnola, U. Siegenthaler, D. Raynaud, J. Jouzel, H. Fischer, K. Kawamura, and T.F. Stocker (2008). High-resolution carbon dioxide concentration record 650,000-800,000 years before present. Nature, Vol. 453, pp. 379-382, 15 May 2008. doi:10.1038/nature06949
Jouzel, J., V. Masson-Delmotte, O. Cattani, G. Dreyfus, S. Falourd, G. Hoffmann, B. Minster, J. Nouet, J.M. Barnola, J. Chappellaz, H. Fischer, J.C. Gallet, S. Johnsen, M. Leuenberger, L. Loulergue, D. Luethi, H. Oerter, F. Parrenin, G. Raisbeck, D. Raynaud, A. Schilt, J. Schwander, E. Selmo, R. Souchez, R. Spahni, B. Stauffer, J.P. Steffensen, B. Stenni, T.F. Stocker, J.L. Tison, M. Werner, and E.W. Wolff (2007). Orbital and Millennial Antarctic Climate Variability over the Past 800,000 Years. Science, Vol. 317, No. 5839, pp.793-797, 10 August 2007.
How do you rate these papers?
The problem is “consensus” science. Only the ice core values of the past that are acceptable to the authorities, or the overseers of “truth”, will be allowed to stand. Beck (2007) found out what happens when presented his findings on CO2 concentrations (that reached well into the 400s ppm during the 19th century) based on 100s of chemical records. He was excoriated.
A “consensus” decision was made in the mid-1980s to reject CO2 values above 280 or 290 ppmv for the pre-industrial era, even though ice cores routinely revealed values that ranged into the 500s, 600s, and 700 ppmv. All the high values were rejected as “incorrect”. The low ones were kept, as those aligned with the assumption that humans are the cause of CO2 concentration rise, and not fluctuating ocean temperatures that release more or less of their vast stores of CO2.
I believe the link above was broken for the Jaworowski paper, which is very insightful. Here’s the unbroken one: http://www.21stcenturysciencetech.com/Articles%202007/20_1-2_CO2_Scandal.pdf
———————————————
Until 1985, the published CO2 readings from air bubbles in pre-industrial ice ranged from 160 to about 700 ppmv, and occasionally even up to 2,450 ppmv. After 1985, high readings disappeared from the publications.
Neftel, et al. reported in 1982 rather high median CO2 concentrations in the preindustrial ice core from Byrd, Antarctica, of about 330 and 415 ppmv, with maximum value reaching 500 ppmv. However, in 1988, in the second publication on the same core, Neftel et al. did not show these high readings; the highest concentration reported was 290 ppmv, in agreement with the global warming theory.
In about ~6,000-year-old ice from Camp Century, Greenland, the CO2 concentration in air bubbles was 420 ppmv, but it was 270 ppmv in similarly old ice from Byrd, Antarctica. … In the air from firn and ice at Summit, Greenland, deposited during the past ~200 years, the CO2 concentration ranged from 243.3 ppmv to 641.4 ppmv.
Pearman, et al. [1986] “on examination of the data,” rejected 43 percent of the CO2 readings from Law Dome, Antarctica core … because they were higher or lower than the assumed “correct” values. Thus, they concluded a value of 281 ppmv CO2 for the pre-industrial atmosphere.
————————————
Here’s Kaufmann, 2007
https://pdfs.semanticscholar.org/d9d9/eb6e213a1fa8fec2c877685baa81817b15a5.pdf
In few fields considered to be science-based has there been such a high degree of polarization and refusal to consider alternate explanations of natural phenomena as in climate change at present.
The scenario seems to be that between 1985 and 1988, a decision was made to present pre-1958 CO2 concentrations with no humps or dips and to proclaim a pre-industrial level of 280 ppm.
Compared with the so-called pre-industrial levels of 280 ppm, a level of 410 ppm was found in 1812, rising to 450 ppm in 1825. There were levels of 370 ppm in 1857, and 4 sets of measurements gave 350–415 ppm around 1940 (Figure 10). From 1870–1920 values remained within 295–310 ppm. From 1955–1965 the values were 325 ppm. Beck chose the most carefully done assays for this graph. One was from Poona, India. An effort not described by Beck was one of 350 determinations near Point Barrow, Alaska, from 1947–1949, with a mean result of 420 ppm (Hock et al., 1952).
The CO2 levels found at Mauna Loa range from 315 ppm in 1957 to 385 ppm in 2007, a period of 50 years. They are similar on Antarctica, showing good mixing of the atmosphere. Since there was a bigger rise from 312 to 415 ppm from 1927–1944 (27 years), shown by chemical assays as described above (Figure 10), there should be no reason for alarm at present. The start of the infrared data in 1958 showed a CO2 concentration that was 12 ppm lower by NDIR assay than the best chemical data of the period. The chemical data are very consistent with each other. This discrepancy has never been resolved.
From 0–60° north, the period from 1905–1940 showed about 1 °C of warming, then steady or dropping temperatures. The 60–70° north record showed about 1.8 °C of warming from 1922–1960, with sinking temperatures thereafter (Kushnir, 1994). This is the reason why the chemical assays registered a large increase in atmospheric CO2, from 295 ppm in 1885 to 440 ppm in 1944 (Figure 10). Ocean cooling of ~0.6 °C from 1940– 1970 (Kushnir, 1994) brought CO2 levels down for a while to 325 ppm from 1955–1965 (Figure 10).
https://notrickszone.com/wp-content/uploads/2017/06/CO2-Concentrations-1800-to-1960-Kauffman-2007.jpg
——————————————-
Foscolos, 2010
https://ejournals.epublishing.ekt.gr/index.php/geosociety/article/view/11157/11208
http://blogs.sch.gr/sachinidi/files/2010/08/Climatic-Changes-Patra_2_v2.pdf
By the end of the 18th century eminent scientists explained the climatic changes on the basis of temperature and the ensuing glacial retreat. This disturbing observation led many prominent scientists to send air balloons equipped with special devices to trap air from the lower atmosphere in order to measure CO2 concentrations. Ninety thousand (90,000) measurements were carried out at 138 locations in 4 continents between 1810 and 1961. The data indicated that atmospheric CO2 concentrations, during the 19th century varied between 290 and 430 ppm (with an average of 322 ppm for the pre-industrial period). For the 20th century, the average concentration is 338 ppm when combined with comparable CO2 measurements carried out by Mauna Loa Observatory, Hawaii, USA (1958- 2000). Measurement precision is ±3%.
——————————————-
Wagner et al., 1999
http://science.sciencemag.org/content/284/5422/1971.full
Century-Scale Shifts in Early Holocene Atmospheric CO, Concentration
“The initial decrease of the SI in the Friesland phase [~11,400 years ago] suggests that atmospheric CO2 concentrations rose by ∼65 ppmv in less than a century. … Our results falsify the concept of relatively stabilized Holocene CO2 concentrations of 270 to 280 ppmv until the industrial revolution. Si-based C02 reconstructions may even suggest that, during the early Holocene, atmospheric CO2 concentrations that were >300 ppmv could have been the rule rather than the exception.”
[…] – 10,000 To 5,000 Years Ago, Global Sea Levels Were 3 Meters Higher, Temperatures 4-6° C Warmer […]
Ask local Aborigines in North Queensland about sea level rise many years ago. Their folklore says the sea rushed in over the flats which are now the Great Barrier Reef. If you work it out it encroached at up to 20 kms per year. They thought it was a giant stingray flapping its fins that caused the water to rush in so fast.
There are three methods of heat transfer. They are conduction, convection, and radiant heat. Heat transfer to or from the earth can only be done by radiant. All material contains heat and is radiating it to cooler surfaces or absorbing it from warmer surfaces. The difference is the heat gain or loss of the material.
The earth gains heat radiated from the sun and loses heat it radiates to outer space, called black sky radiation. Outer space is considered absolute zero.
The amount of radiant heat hitting the earth from the sun daily is relatively constant. The radiant heat lost daily by the earth thru black sky radiation is constant since absolute zero is constant. The amount of heat gained by the earth’s surface depends on the surface area of the earth covered by water relative to that covered by land. Land area absorbs a larger percent of the radiant heat relative to the water area since the surface of the water reflects a percentage of the radiant heat back to outer space. The daily access heat, or loss of heat, is transferred to the oceans thru conduction and convection where it works its way to the poles and it freezes water adding to the polar ice caps or melts the polar ice caps thus keeping the temperature of the oceans, thus the earth, relatively constant. As the polar ice caps grow or melt, the surface area of the earth covered by land relative to that covered by water changes. This is the definition of global warming.
That radiant heat absorbed by oceans and land masses is transferred to the atmosphere thru conduction and convection. When it is winter in one hemisphere it is summer in the other and the same with spring and fall. I would think the average temperature of the lower 5,000 feet of the atmosphere changes about 10’F to20’F each day. This probably takes more heat than man has added to the earth in the last 50 years. That heat man adds to the atmosphere each day is radiated to the black sky and the infinitesimal amount left helps melt the ice during global warming, should be called Global Defrosting, . The scientists have taken core samples of the polar ice caps and know how close we are to the ice left at the beginning of the last ice age. That is how close we are to the end of global warming or we have already begun global cooling, should be called global ice making. According to the Antarctic ice core we began the new ice age about 11,000 years ago.
Absolute Zero is -459.68’F and the surface temperature of the sun is between 7,300’F and 10,000’F. If we could go back in time 12,000 years, the end of the last ice age, we would probable see that the average daily temperature of the earth was in the mid 60’F as it is today. You must understand the amount of heat gained every 24 hours is almost equal to that lost during the same 24 hours. Angle of the earth’s axis is 23.5’.
The above in simple English.
The average surface temperature of the earth is 63.5’f. The heat loss to black sky radiation every 24 hours is constant. The average radiant heat striking the surface of the earth is relatively constant. Because the sun is an active star the average temperature will change over centuries. As the surface area of the earth covered by water increases, the more radiant heat is reflected back to the black sky increases. When the daily radiant heat gained by the earth from the sun in 24 hours is less than that lost by black sky radiation we will begin ice making. Looking at the ice core from the Antarctic we can see that the earth began the new Ice Age about 12,000 years ago.
The Weather Channel just had a piece of a very large section of ice is about to break off a peninsula in the Antarctic. Could this be because of the fact that 12,000 years ago the earth switched from Global Ice Melting to Global Ice Making. Since then the Ocean levels may have dropped a foot and the ice has risen around 600’ in the Antarctic. It seems like that would be a tremendous amount of leverage attempting to break off that ice.
The Arctic ice core chart also shows the top 500’ is the beginning of the Industrial Revolution, thus the increase of CO2 rise in the atmosphere. The chart also shows that as the ocean level drops the CO2 level in the atmosphere drops. This is because the land surface area grows, thus the green foliage increases, thus the photosynthesis, which is how nature removes the CO2 from the atmosphere, lowers the CO2 level. Oceans were about 400’ lower than they are now at the peak of the ice age and global ice melting began. The last ice age lasted about 120 thousand years. That means it took about 60 thousand years to melt the ice, thus the oceans rose an average of 6.67 feet per thousand years.
@Robert Clark,
“There are three methods of heat transfer. They are conduction, convection, and radiant heat.”
Somehow you forgot latent heat that cannot be ignored on bodies that have oceans. In this solar system that means Earth and Titan. For a mathematical model that predicts the warming effect of dense atmospheres with amazing accuracy I recommend Robinson & Catling:
http://faculty.washington.edu/dcatling/Robinson2014_0.1bar_Tropopause.pdf
Unlike most papers on “Climate Science” the above paper provides sufficient information to allow replication of the results. See here:
https://diggingintheclay.wordpress.com/2014/04/27/robinson-and-catling-model-closely-matches-data-for-titans-atmosphere/