By now, after some 30 years of dire warnings, you’d think that the warming of the globe and ice mass reduction would be much further along than it actually is. Yet there are a number of major signs that show the opposite (cooling and freezing) are happening:
1. Arctic ice has stabilized over the past decade
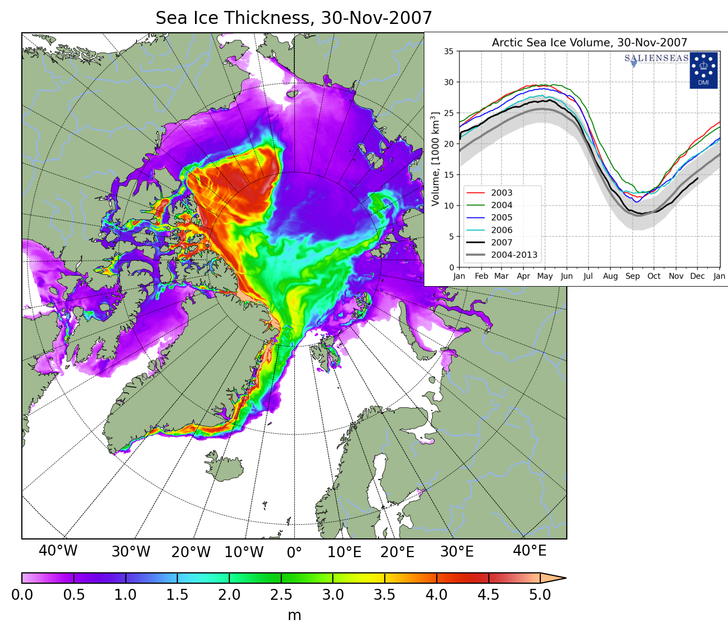
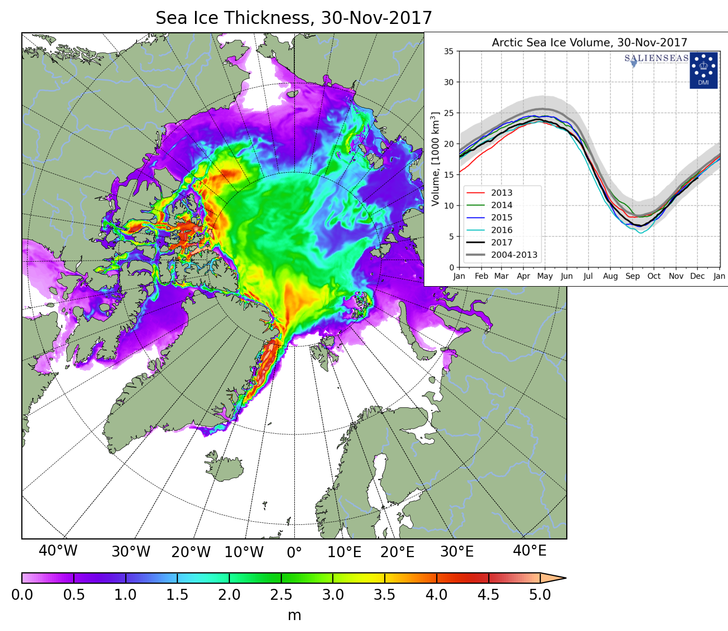
Tony Heller at realclimatescience.com here reports that Arctic sea ice volume is in fact up 15%, from 13,000 km³ to 15,000 km³ and that there has been a huge expansion of thick ice into the East Siberian Sea. The following is Heller’s comparator showing the difference between today and 10 years ago:
Obviously over the past 10 years Arctic sea ice was supposed to do the opposite, i.e. shrink 15%. Climate scientists, who warned the melting of the 2000s would accelerate, are now left baffled and speechless.
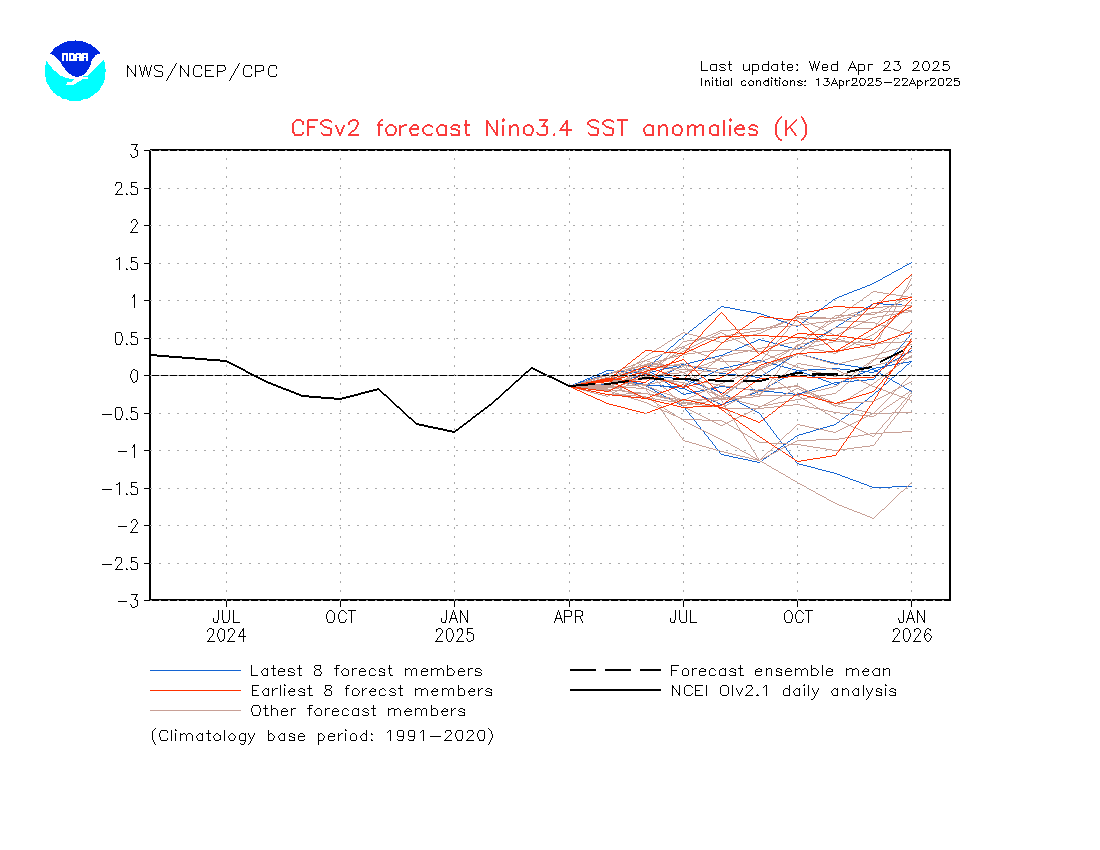
2. Equatorial Pacific La Nina will usher in cooling
The EL Nino Southern Oscillation (ENSO), a measure of equatorial Pacific sea surface temperatures, is at its coldest level in years, boding that more global cooling lies ahead for the planet in the months ahead. Just months ago, experts were predicting another warming El Nino. They were wrong. Moreover, the latest forecast sees La Nina conditions extending into next spring:
3. Rapid Pacific surface cool down:
Surface temperatures at the equatorial Pacific (where it really counts) have plummeted by 1-2°C since June of this year, hurricane expert Phillip Klotbach tweeted recently: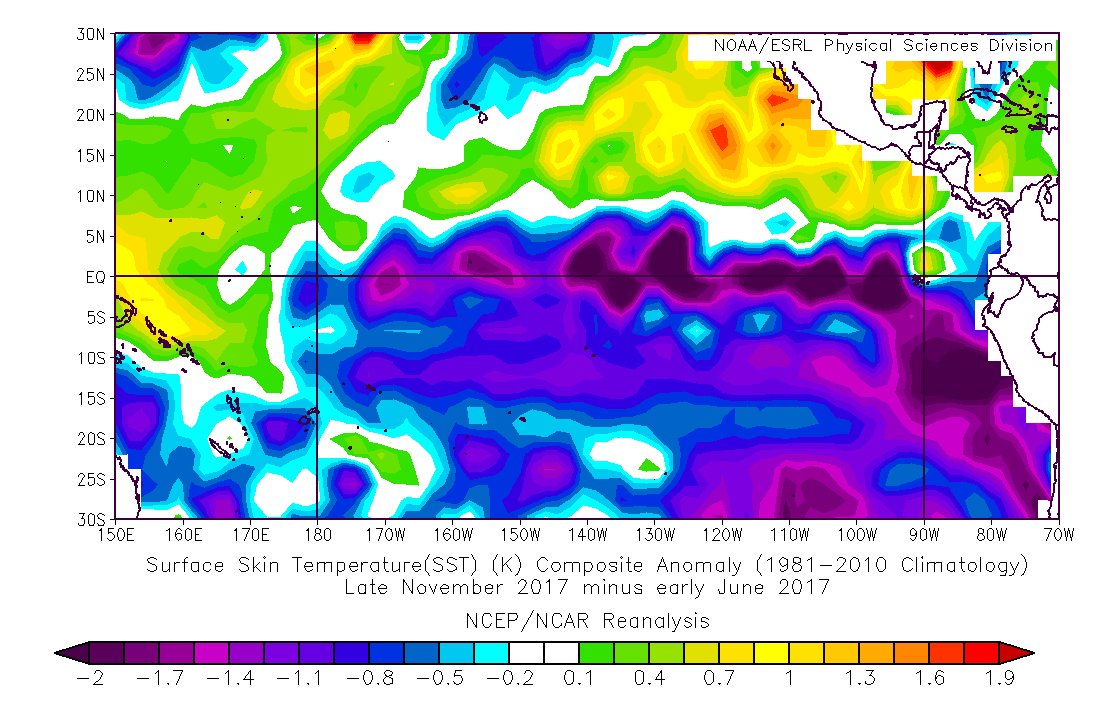
And because there is a lag of about 6 months between the ocean surface temperature and satellite global lower troposphere temperatures, the La Nina will ensure that 2018 will be a cooler year at the surface globally.
4. Siberia sees unusual November cold
Moving to Siberia, we see that an unexpected cold gripped the region, with temperatures in many parts of Siberia recently plummeting 20°F below normal. The Weather Channel reports here: “Parts of Siberia are Colder Than Minus 60 Degrees Fahrenheit, and It’s Only November“.
Forecasters are now warning that this cold could soon shift over to North America and Europe.
5. Greenland’s ice mass budget continues to surprise
Greenland, often claimed by climate alarmists to be the “canary in the coal mine”, has seen its ice sheet gain 250 billion metric tonnes since September 1, 2017. This is 40 billion tonnes above the 1981-2010 average.
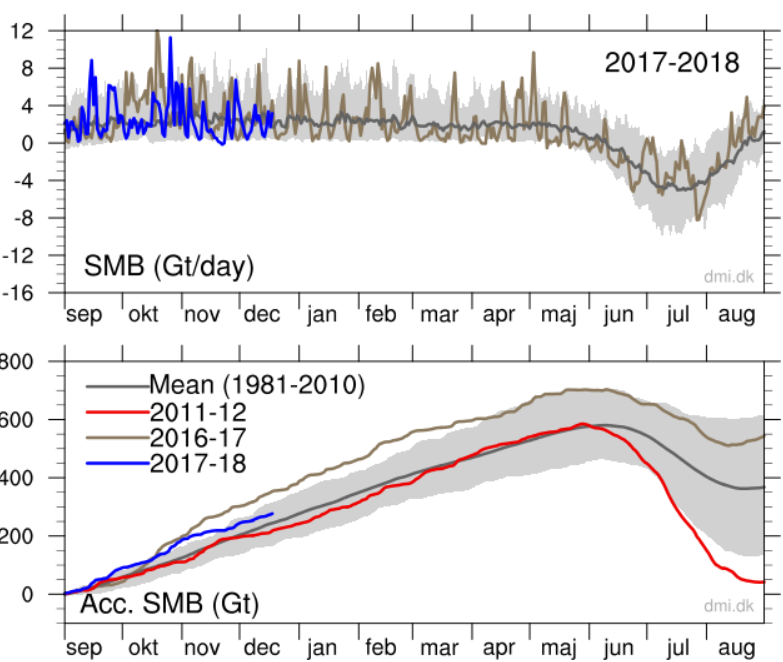
Top: The total daily contribution to the surface mass balance from the entire ice sheet (blue line, Gt/day). Bottom: The accumulated surface mass balance from September 1st to now (blue line, Gt) and the season 2011-12 (red) which had very high summer melt in Greenland. For comparison, the mean curve from the period 1981-2010 is shown (dark grey). More here: DMI. Source: Danish Meteorological Institute.
Warming is not supposed to create 40 billion tonnes of ice. That’s almost 6 tonnes for each person on the planet.
6. Northern Hemisphere fall snow and ice cover rising
Northern Hemisphere snow and ice cover for the month of October finished 20% above the mean. In fact the mean of the past 5 years for October has been the highest for any 5-year period since measurements began 50 years ago.
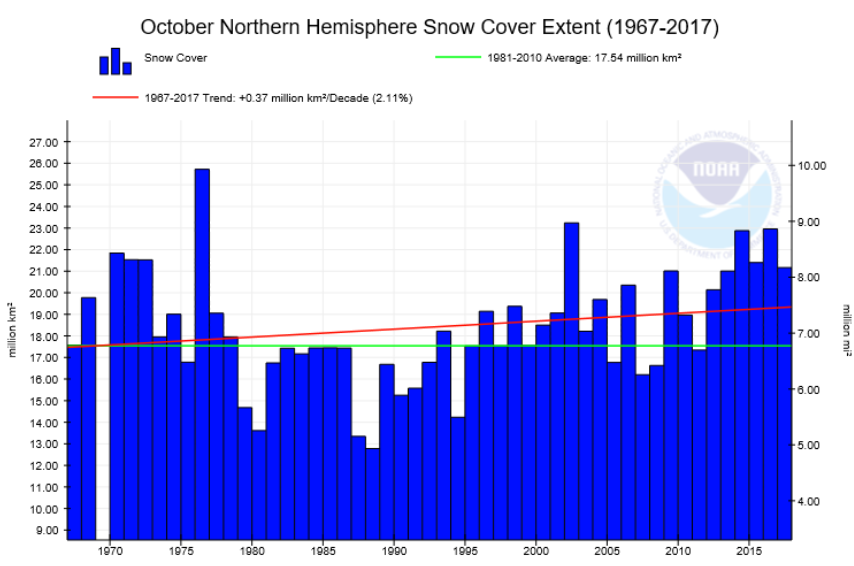
Source: Rutgers University Global Snow Laboratory (GSL)
The same is true for the month of November: it too has seen a robust upward trend in snow and ice cover over the past 30 years.
7. Solar activity near 200-year low
In the current solar cycle 24 sunspot activity is now at the lowest level in almost 200 years. In the early 1800s the Earth found itself in the grips of the Dalton Minimum, a cold period with similarly low solar activity:
The accumulated sunspot anomaly from the mean of the previous 23 cycles – 107 months into the cycle.
The current solar cycle 24 is the third weakest since the systematic observation of solar cycle activity began in 1755. Only solar cycles nos. 5 and 6 (1798…1823 during the Dalton Minimum) were weaker. A number of distinguished scientists and dozens of scientific publications warn that the planet may in fact be entering a period of global cooling. The upcoming solar cycle 25 also is expected to be a weak one.
Major eruption of Agung?
In summary, there are other signs showing cooling taking place or coming up; above is just a sampling. Let’s not forget the possible eruption of Agung in Indonesia. A major eruption would send global temps into the fridge for a couple of years.
The bottom line: Don’t let all the hype about runaway warming make you think the planet is roasting. There’s plenty of unexpected cold around – cold that was never supposed to be. And the only thing you’re going to hear from the alarmists to explain this are a lot of excuses.


The sea ice comparison between 2007 and 2017 should note that 2007 was a record low in the short period of record at the time (I think 2012 was a bit lower). Good cherry pick, though.
Gladyshev et al., 2017
https://link.springer.com/article/10.1134/S1028334X17100166
After 2010, a sharp and stable freshening and cooling of SPMWs [Subpolar Mode Water] started in the eastern part of the North Atlantic. In the years 2010–2016, the mean temperature of the SPMW [Subpolar Mode Water] core in the Rockall Trough dropped by -0.73°C (-0.12°C/yr); in the Iceland Basin it dropped by -2.12°C (-0.35°C/yr), and salinity decreased by 0.12 psu (0.02 psu/yr) and 0.23 psu (0.04 psu/yr), respectively.
–
Piecuch et al., 2017
http://onlinelibrary.wiley.com/doi/10.1002/2017JC012845/full
The subpolar North Atlantic (SPNA) is subject to strong decadal variability, with implications for surface climate and its predictability. In 2004–2005, SPNA decadal upper ocean and sea-surface temperature trends reversed from warming during 1994–2004 to cooling over 2005–2015.
–
Kusahara et al., 2017
http://www.sciencedirect.com/science/article/pii/S0921818116304659
In contrast to a strong decrease in Arctic sea ice extent, overall Antarctic sea ice extent has modestly increased since 1979. Several hypotheses have been proposed for the net Antarctic sea ice expansion, including atmosphere/ocean circulation and temperature changes, sea ice-atmospheric-ocean feedback, increased precipitation, and enhanced basal meltwater from ice shelves. Concomitant with this positive trend in Antarctic sea ice, sea surface temperatures (SSTs) over the Southern Ocean south of approximately 45°S have cooled over this period.
–
Turney et al., 2017
http://www.clim-past.net/13/231/2017/cp-13-231-2017.pdf
Occupying about 14% of the world’s surface, the Southern Ocean plays a fundamental role in ocean and atmosphere circulation, carbon cycling and Antarctic ice-sheet dynamics. … As a result of anomalies in the overlying wind, the surrounding waters are strongly influenced by variations in northward Ekman transport of cold fresh subantarctic surface water and anomalous fluxes of sensible and latent heat at the atmosphere–ocean interface. This has produced a cooling trend since 1979.
–
Oliva et al., 2017
http://www.sciencedirect.com/science/article/pii/S0048969716327152
However, a recent analysis (Turner et al., 2016) has shown that the regionally stacked temperature record for the last three decades has shifted from a warming trend of 0.32 °C/decade during 1979–1997 to a cooling trend of − 0.47 °C/decade during 1999–2014. … This recent cooling has already impacted the cryosphere in the northern AP [Antarctic Peninsula], including slow-down of glacier recession, a shift to surface mass gains of the peripheral glacier and layer of permafrost in northern AP islands.
–
Fernandoy et al., 2017
http://www.the-cryosphere-discuss.net/tc-2016-298/
The firn stable isotope composition reveals that the near–surface temperature at the Antarctic Peninsula shows a decreasing trend (−0.33 °C y−1) between 2008 and 2014.
–
Wang et al. 2017
https://www.nature.com/articles/s41598-017-15208-9
No evidence of widespread decline of snow cover on the Tibetan Plateau over 2000–2015 … Our results show no widespread decline in snow cover over the past fifteen years and the trends of snow cover phenology over the TP has high spatial heterogeneity.
–
Kind o9f like 1979 for the start point when there are satellite records to 1972
Since the arctic ice has only now returned the to the level it was 400 years ago (https://notrickszone.com/2017/11/30/2-more-new-papers-affirm-there-is-more-arctic-ice-coverage-today-than-during-the-1400s/#sthash.DaYWljWq.dpbs) prior to which it was even lower than the alleged record of 2007 & 2012 and since the alarmist claims are based only on observations since 1979 (how old is fhe earth again?) I would regard accusations of cherry-picking as ill-advised.
Face it, Ric! The global warming / climate change train is heading downhill with no brakes. If you’re quick you might manage to leap across onto the “global pollution” or the “plastics-destroying-the-oceans” trains though I haven’t worked out yet which one the eco-activists (aka lying hypocrites) are driving. Maybe both!
That’s why I like to say that Arctic sea ice has stabilized over past decade.
Haven’t you guys determined that El Nino’s are to be ignored when looking at climate trends? Along comes an El Nina and it’s still a top 3 year (2017), but you make it appear as if a new ice age is coming or things are stable now … fascinating.
Given that the “great” and the “good” in Climateworld claim that El Nino’s are the result of “climate change” and La Nina’s the result of “natural variability”, that’s a good one.
You obviously believe 1- and 2-year anomalies in El Nino years should count as climate change caused by humans:
Perhaps, then, you can finally answer the question I keep on asking you…and you dodge in perpetuity:
Since you believe humans caused the 2016 anomalously warm year, and that the natural 2015-’16 Super El Nino event had little to do with the temperature increase, what mechanism do you attribute the -0.6 C cooling during 2016 to?
http://www.woodfortrees.org/plot/uah6/from:2016/to:2017
Not a “cherry pick” considering that projections by the alarmists were/are that expansion of Arctic sea ice in any metric was not supposed to happen AT ALL! For some reason those that defend always forget or ignore that context of the argument.
To this day they lie about what is happening day in and day out.
https://realclimatescience.com/wp-content/uploads/2017/12/2017_12_03_07_47_11.png
Ric, sure it is a selective decision,however it is done in the light that there were many predictions of no summer ice starting in 2007 that would be gone by 2012,2013,2014,2015 and so on.
Instead there is a stabilization for the last 10 year period,indicating that the minimum may have been reached,now to regrow over time as the AMO goes deeper into the negative territory.
You clearly didn’t look hard enough, the graph was from 2004 to 2013.
Ric by “cherry pick” you mean “alarmist trick”?
Snopes has none of this information therefore this information is a conspiracy by the Russians and big oil. Only conspiracy nuts would believe any of this.
/s for the terminally literal
According to ice core records, the last millennium 1000AD – 2000AD has been the coldest millennium of our current Holocene interglacial. This point is more fully illustrated with ice core records on a millennial basis back to the Eemian period here:
https://edmhdotme.wordpress.com/2015/06/01/the-holocene-context-for-anthropogenic-global-warming-2/
Our current, warm, congenial Holocene interglacial, although cooler than the Eemian, has been the enabler of mankind’s civilisation for the last 10,000 years, spanning from mankind’s earliest farming to recent technology. Viewing the Holocene interglacial is fruitful, on a century by century and on a millennial perspective.
Each of the notable high points in the current Holocene temperature record, (Holocene Climate Optimum – Minoan – Roman – Medieval – Modern), have been progressively colder than the previous high point.
But it seems that, driven by the need to continually support the Catastrophic Anthropogenic Global Warming thesis / religion Climate scientists and Climate alarmists examine the temperature record at too fine a scale, weather event by weather event, month by month, year by year.
The ice core record from Greenland for its first 7-8000 years, the early Holocene, shows, virtually flat temperatures, an average drop of only ~0.007 °C per millennium, including its high point known as the “climate optimum”. But the more recent Holocene, since a “tipping point” at around 1000BC, 3000 years ago, has seen temperature fall at about 20 times that earlier rate at about 0.14 °C per millennium .
The Holocene interglacial is already 10 – 11,000 years old and judging from the length of previous interglacial periods, the Holocene epoch should be drawing to its close: in this century, the next century or this millennium.
Nonetheless, the slight beneficial warming at the end of the 20th century to a Modern high point has been transmuted by Climate alarmists into the “Great Man-made Global Warming Alarm”.
The recent warming since the end of the Little Ice Age has been wholly beneficial when compared to the devastating impacts arising from the relatively minor cooling of the Little Ice Age, which include:
• decolonisation of Greenland
• Black death
• French revolution promoted by crop failures and famine
• the failures of the Inca and Angkor Wat civilisations
• etc., etc.
As global temperatures, after a short spurt at the end of the last century, have already been showing stagnation or cooling over the last nineteen years or more, the world should now fear the real and detrimental effects of cooling, rather than being hysterical about limited, beneficial or probably now non-existent further warming.
Warmer times are times of success and prosperity for man-kind and for the biosphere. For example during the Roman warm period the climate was warmer and wetter so that the Northern Sahara was the breadbasket of the Roman empire.
But the coming end of the present Holocene interglacial will eventually again result in a mile high ice sheet over much of the Northern hemisphere.
As the Holocene epoch is already about 11,000 years old, the reversion to a true ice age is becoming overdue. That reversion to Ice Age conditions will be the real climate catastrophe.
With the present reducing Solar activity, significantly reduced temperatures, at least to the level of another Little Ice Age are predicted quite soon, later in this century. Whether the present impending cooling will really lead on to a new glacial ice age or not is still in question.
Kind of like using 1979 for the start point when there are satellite records to 1972
I had to go to French TV coupla days ago to see that three fifths of departments had heavy falls of snow from Normandy to Provence. Censored by the BBC.
Make it 8.
8. According to NASA Sea Level Rise has plateaued for 2 tears and fallen for the last year.
Sorry 2 years.
La Nina? La Nina is a sign we’re cooling and will continue to cool?
When there’s an El Nino, do say it’s a sign the world is warming and will continue to warm?
Plus, all the experts I know of have been predicting el nino for months, which is why everybody knows average global temperatures will be slightly lower this year than last.
*La Nina
Siberia is cherry picking. There have been plenty of unusually warm temperatures you could report, as well.
https://www.usatoday.com/story/weather/2016/12/21/north-pole-record-warmth-arctic/95700876/
I don’t suppose you have any idea what cause that…hint it was the sun!
Hint: It is always the Sun, as that is the source of the energy. The amount of heat content changes depends on other factors as well and can be many times of what the little variations in the Sun’s output can cause.
This contradicts NASA data for Greenland, can it be explained?
https://sealevel.nasa.gov/
Greenland has been cooling slightly since 2005 (Kobashi et al., 2017).
Between 1993 and 2010, Greenland contributed just 0.39 of a centimeter to global sea levels (Leeson et al., 2017).
In other words, nothing unusual is occurring for Greenland.
Current conditions at Summit Station on the Greenland Ice sheet
Conditions
-37 C -35 F
0.0 knots
313 degrees NW
As of 12/03 22:46
Summit Webcams
December 03, 2017 – 22:48 -03
http://www.summitcamp.org/status/webcam/
The Arctic in general for the last several years has had warmer than average temperatures during the winter and average or colder than average temperatures during the summer when compared to the 1958-200 mean.
http://ocean.dmi.dk/arctic/meant80n.uk.php
However the winter temperatures have still remained well below freezing.
Accumulation of snow/ice on the great terrestrial ice sheets at both poles is affected more by the amount of melt during their short summers than by the winter temperatures. Thus it takes higher temperatures during the short summers to cause loss of mass due to melting. Along the same lines it is believed that glacial periods when the ice sheets spread beyond their polar regions and mountain glaciers grow result more from mild summers with less melt than severe winters.
Why not show my comments?
Okay, so…now answer my questions.
If there were an el nino would you cite it as a sign the world has been warming and will continue to warm?
Are warm temperatures in greenland a sign that the world is warming and will continue to warm?
I think you may be misunderstanding the article.
An impending La Nina is in the forecast, which could contribute to a short-term cooling trend (i.e., within the next year or two). There is no reference to La Ninas inducing long-term cooling. In fact, the opposite is specified:
“more global cooling lies ahead for the planet in the months ahead.”
“the latest forecast sees La Nina conditions extending into next spring“
Similarly, wind-current-induced warming from large El Nino events (i.e., 1997-’98, 2015-’16) is also short-term. Beginning or ending a temperature trend with an ENSO event can therefore introduce a warming or cooling bias.
According to recently published science, Greenland has been cooling (slightly) since 2005, and there has been no net warming in Greenland for the last 90 years:
https://notrickszone.com/wp-content/uploads/2016/12/Holocene-Cooling-Greenland-Ice-Sheet-Zhao-16.jpg
–
https://notrickszone.com/wp-content/uploads/2017/06/Holocene-Cooling-Greenland-Ice-Sheet-Hanna-2011.jpg
–
There is nothing unusual currently occurring in Greenland.
Easterbrook, 2016
http://www.sciencedirect.com/science/article/pii/B9780128045886000082
“In the past 500 years, Greenland temperatures have fluctuated back and forth between warming and cooling about 40 times, with changes every 25–30 years. … Comparisons of the intensity and magnitude of past warming and cooling climate changes show that the global warming experienced during the past century pales into insignificance when compared to the magnitude of profound climate reversals over the past 25,000 years. At least three warming events were 20–24 times the magnitude of warming over the past century, and four were 6–9 times the magnitude of warming over the past century.”
The article promises 7 major signs the earth is cooling and will continue to cool.
Also, at the end, it intimates that climate scientists were unaware of or surprised by these things, and won’t be able to explain them.
Won’t be able to explain La Nina?
Okay…
Won’t be able to explain that it’s very cold in Siberia?
Did anybody say it would never be cold in Siberia again? I don’t think they have.
And if the writer ignores all the record warm temps going on at the same time, that is cherry picking.
Correct. And the “continue to cool” part is short-term when it comes to La Nina.
Whether or not there’d be a La Nina in the short-term has been subject to debate.
Now it appears you’re just making up faux arguments.
No. It’s colder there now than it’s been for most of the last 10,000 years, though.
https://notrickszone.com/wp-content/uploads/2017/02/Holocene-Cooling-Siberia-Tarasov-09.jpg
https://notrickszone.com/wp-content/uploads/2017/02/Holocene-Cooling-Siberia-Northwestern-Hantemirov-Shiyatov-02.jpg
Tell me how recent cold temperatures in Siberia are indicative of the world cooling and continuing to cool.
Sorry, it was supposed to be ice-free in the summer in the Arctic before now. And there was supposed to be accelerated warming. Non of this has happened.
Warmists are doomed.
sushi,
Your question about the warmth at the pole at end of 2016 and through to the beginning of 2017 was cause by a solar effect, a massive coronal hole. You might not have seen but it was the sun, NOT human caused.
Yep, and don’t expect most of the MSM (e.g. usatoday) to tell you the truth as that does not sell copy. For the MSM it makes sense to keep selling the alarmist message, regardless of the lack of truth in it. Publishers like the one you quote just recycle the same old alarmist messages without properly checking the veracity of the claims.
From https://www.sciencedirect.com/science/article/pii/S1364682616300426
Also see http://www.bbc.co.uk/blogs/paulhudson/2012/10/a-step-forward-in-forecasting.shtml
by Paul Hudson, ex-Met Office(UK) forecaster and now weather presenter and climate correspondent for BBC.
I didn’t say anything about anything being human caused…
Checkmate, alarmists!
In all seriousness, the 7 points here are laughably poor. Cherry picked data and cheery picked time periods throughout. I enjoy a good anti-AGW argument but this doesn’t do the trick.
Chris, your OPINION is noted,but the article used actual data to make the claim.
Where is your counter argument?
The counter argument is well presented in his short comment. Where is your “counter argument” in your poor example of an angry denialist reply?
You have NOTHING seb,
Don’t just yap mindlessly…
Which one of the facts is incorrect.?
It seems somebody doesn’t know what the “G” in AGW stands for.
Perhaps Sushi should spend a few days reading about the Cold Records, cold springs and Early winters all over the world as listed from the real world ie not adjusted data, over at IceAGeNow.
I think he will be absolutley shocked how almost none of them are reported by Climate Scientists or the mass media.
And Chris Peckit could learn a thing or 2 as well, but he obvioulsy prefers the severely adjusted data coming out of NASA?GISS and the Australian BOM.
He and Sushi probably think they have lots of Thermometers in the Arctic.
Ice Age Now.
Hahaha.
The places where I read about weather discuss record warm temps and record cold temps equally.
sushi = uncooked dead fish
Comments like one , too.
Sushi, have you ever visited Ice age now?
https://www.iceagenow.info/
I just did … do you really need to be told what is wrong with websites like this one?
Are you admitting to being sushi?
But of course you can’t provide evidence of it,thus your statement is nothing.
What he does well is post a lot of weather events (Fall-spring) that exposes the weaknesses of the AGW conjecture.
There have been all time record lows,snowfall and earliest snowfall on record in the last three months.
The IPCC says it was supposed to rain more and snow less,while the data shows the opposite.
“what is wrong with websites like this one?”
Nothing you can name, seb..
…. you are basically IGNORANT of anything to do with climate anything.
All you can manage is attention-seeking yapping
[…] av klimatalarmism kan vi konstatera att larm efter larm inte materialiserat och att allt fler observationer tyder på att jorden går mot ett kallare och inte varmare klimat som är det man försökt skrämma med. Dessa observationer hjälper inte, oligarkernas medier […]
Dear Pierre,
the Greenland-Graph is missing here and could not be found anywhere else. Do you have it ready separately? The caption sounds very interesting.
Best regards Chris Frey
[…] Link: https://notrickszone.com/2017/12/03/7-major-signs-the-globes-surface-has-been-cooling-and-will-contin… […]