Already 14 New (2018)
Non-Hockey Stick Papers

During 2017, there were 150 graphs from 122 scientific papers published in peer-reviewed journals that indicated modern temperatures are not unprecedented, unusual, or hockey-stick-shaped — nor do they fall outside the range of natural variability.
Less than 3 weeks into the new publication year, the explosion of non-alarming depictions of modern climate change continues.
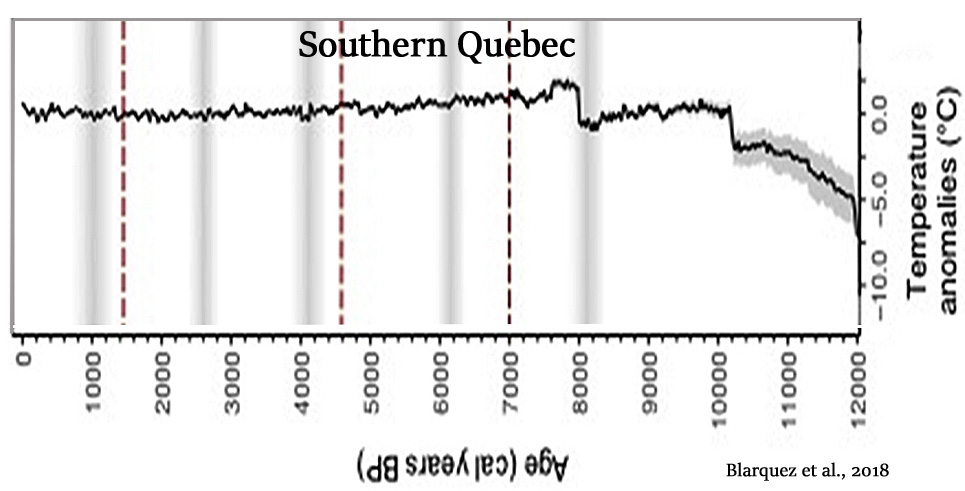
Blarquez et al., 2018
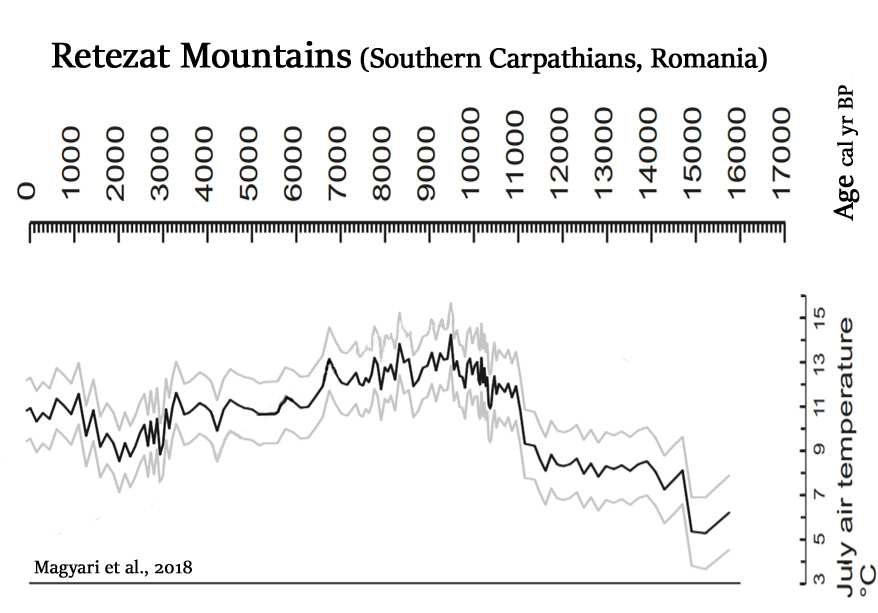
Magyari et al., 2018
…its climatic tolerance limits were used to infer July mean temperatures exceeding modern values by 2.8°C at this time [8200-6700 cal yr BP] (Magyari et al., 2012).
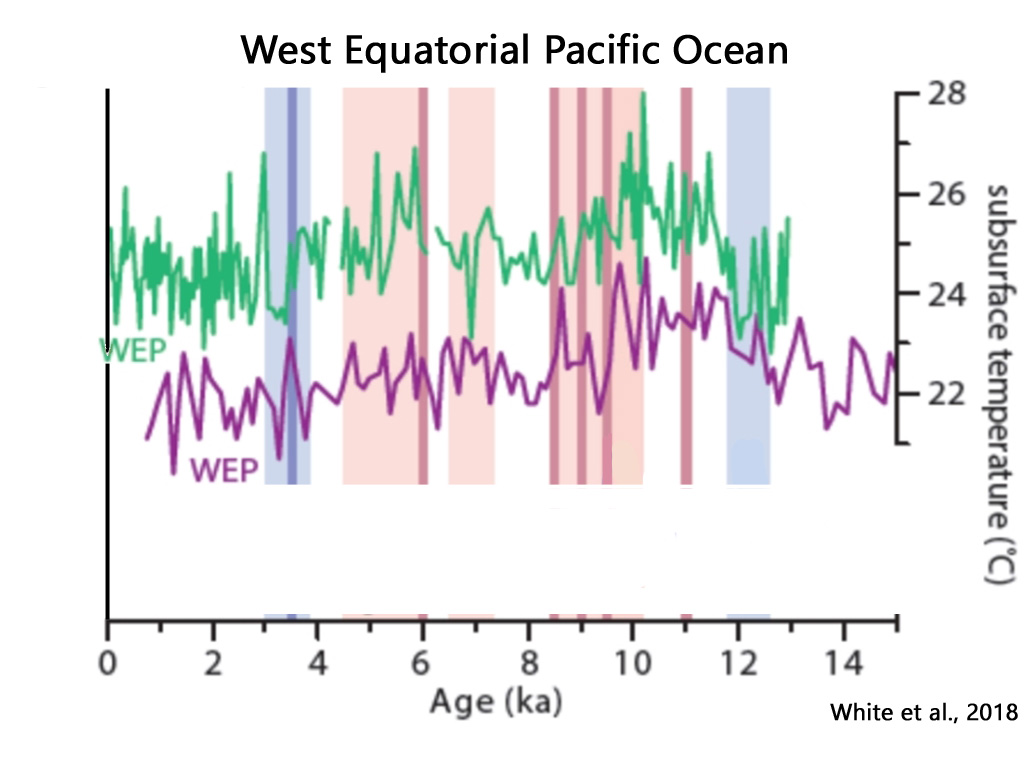
White et al., 2018
Our data, together with published work, indicate both a long-term trend in ENSO strength due to June insolation [solar] forcing and high-amplitude decadalcentennial fluctuations; both behaviors are shown in models. The best-supported mechanism for insolation-driven dampening of ENSO is weakening of the upwelling feedback by insolation-forced warming/deepening of thermocline source waters. … Another potential source of decadal-centennial forcing is total solar irradiance, which varied more in the early Holocene than the mid- to late Holocene [Marchitto et al., 2010]. Changing solar irradiance is theoretically capable of affecting ENSO via ocean dynamical cooling [Emile-Geay et al., 2007], and is correlated with centennial-scale variations in early Holocene ENSO [Marchitto et al., 2010].
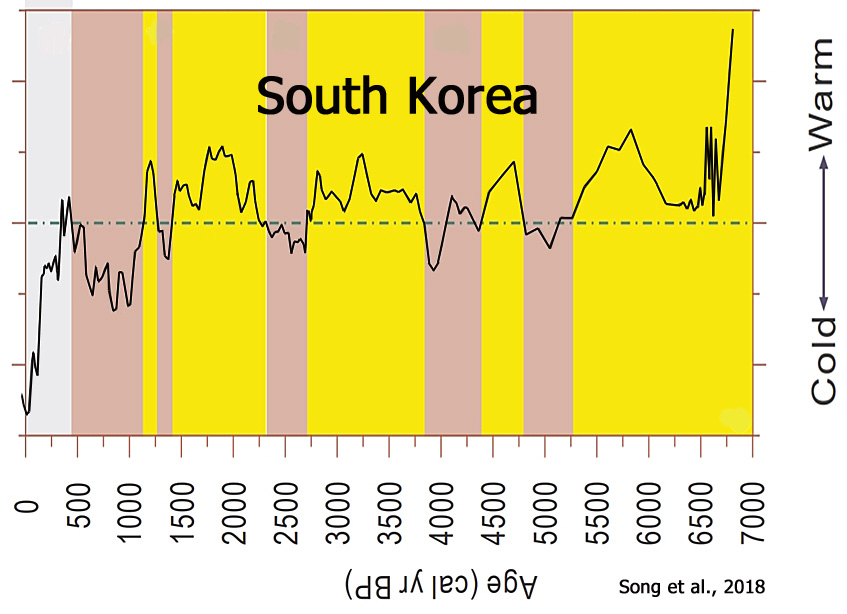
Song et al., 2018
[A] general warm to cold climate trend from the mid-Holocene to the present, which can be divided into two different stages: a warmer stage between 6842 and 1297 cal yr BP and a colder stage from 1297 cal yr BP to the present. … The general cooling trend may represent a response to decreasing solar insolation; however, the relative dryness or wetness of the climate may have been co-determined by westerlies and the East Asian summer monsoon (EASM). The climate had a teleconnection with the North Atlantic region, resulting from changes in solar activity.
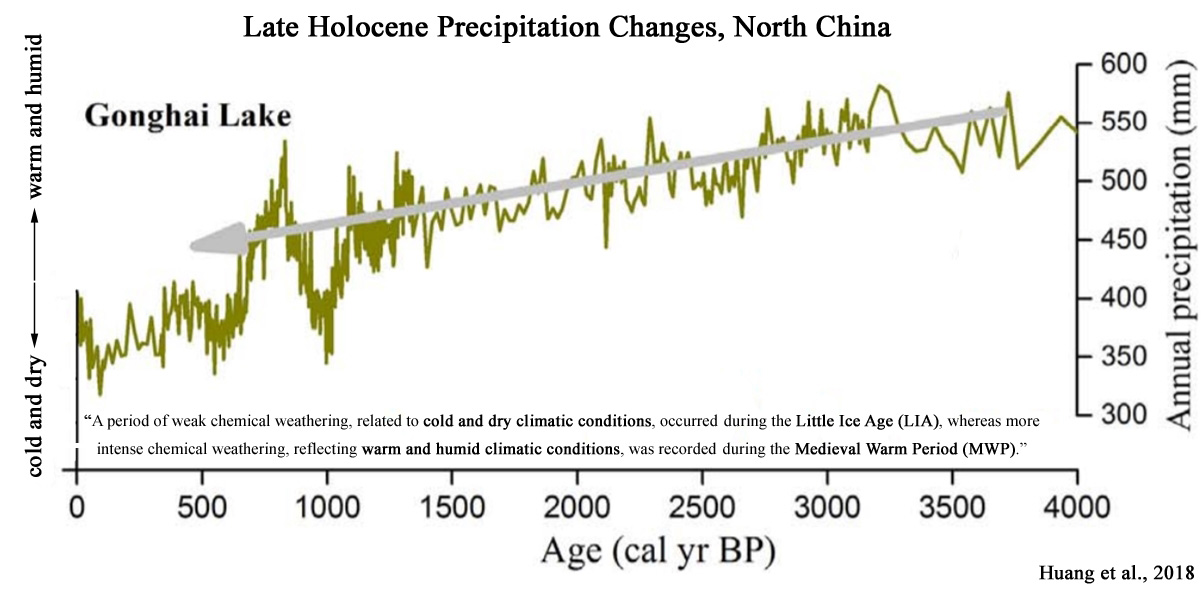
Huang et al., 2018
A period of weak chemical weathering, related to cold and dry climatic conditions, occurred during the Little Ice Age (LIA), whereas more intense chemical weathering, reflecting warm and humid climatic conditions, was recorded during the Medieval Warm Period (MWP). Besides, an intensification of chemical weathering in Poyang Lake during the late Holocene agrees well with strong ENSO activity, suggesting that moisture variations in central China may be predominantly driven by ENSO variability. … Rao et al. (2016b) demonstrated that a humid late-Holocene in central China and an arid late-Holocene in southern and northern China were significantly related to strong ENSO activity. Thus, it seems that ENSO forcing may be likely dominant factor controlling moisture variations in central China.
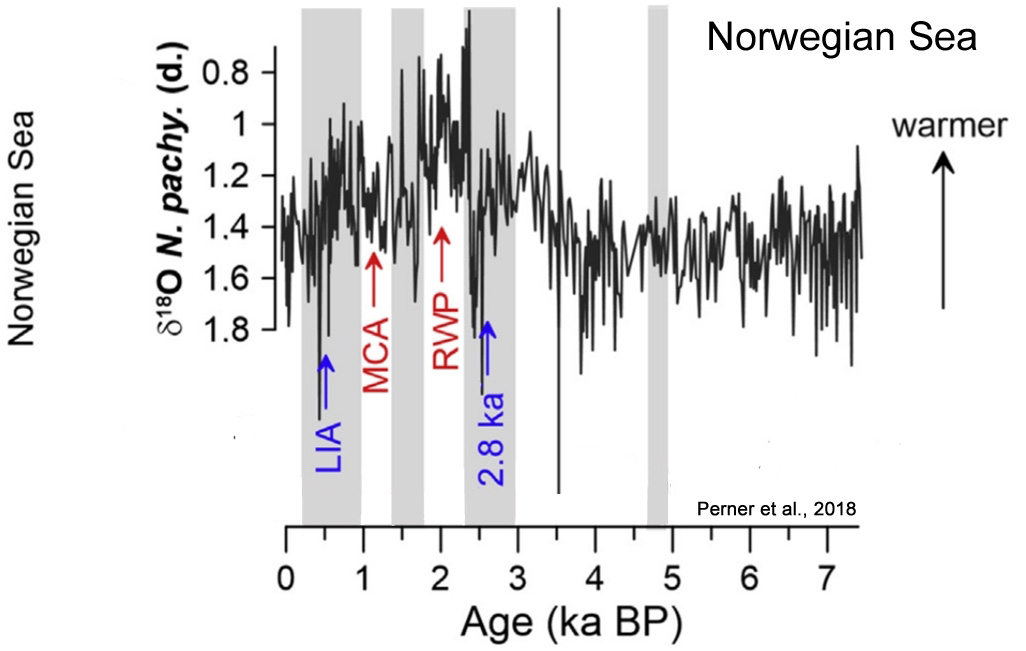
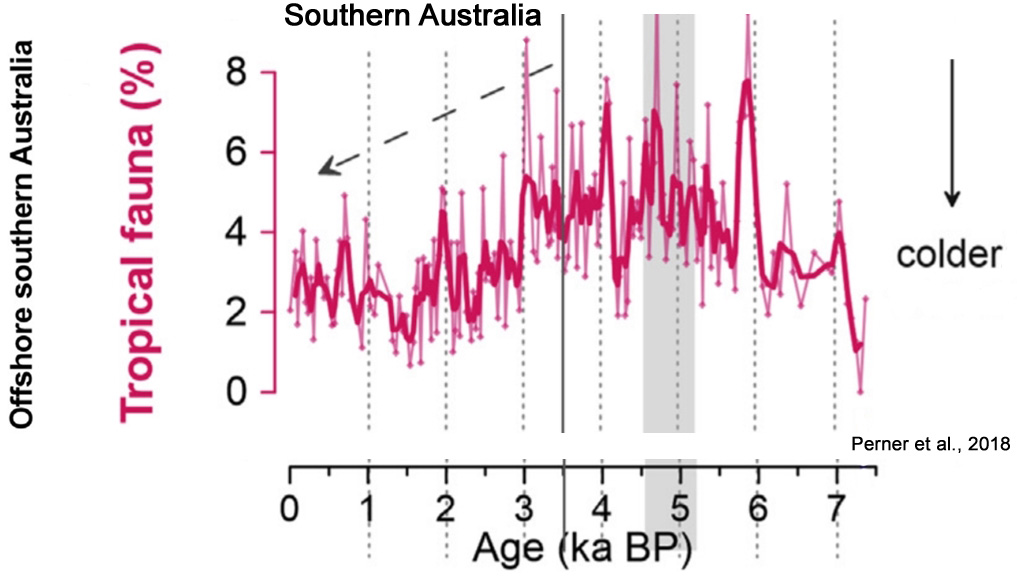
Perner et al., 2018
[W]e find evidence of distinct late Holocene millennial-scale phases of enhanced El Niño/La Niña development, which appear synchronous with northern hemispheric climatic variability.
Phases of dominant El Niño-like states occur parallel to North Atlantic cold phases: the ‘2800 years BP cooling event’, the ‘Dark Ages’ and the ‘Little Ice Age’, whereas the ‘Roman Warm Period’ and the ‘Medieval Climate Anomaly’ parallel periods of a predominant La Niña-like state.
Our findings provide further evidence of coherent interhemispheric climatic and oceanic conditions during the mid to late Holocene, suggesting ENSO as a potential mediator.
![]()
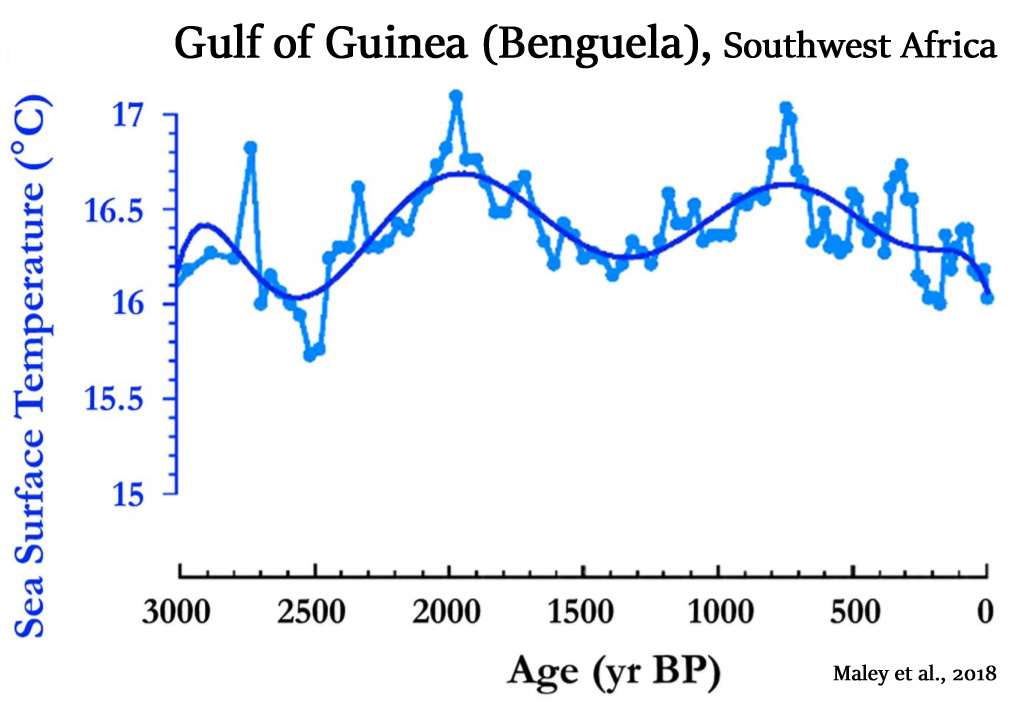
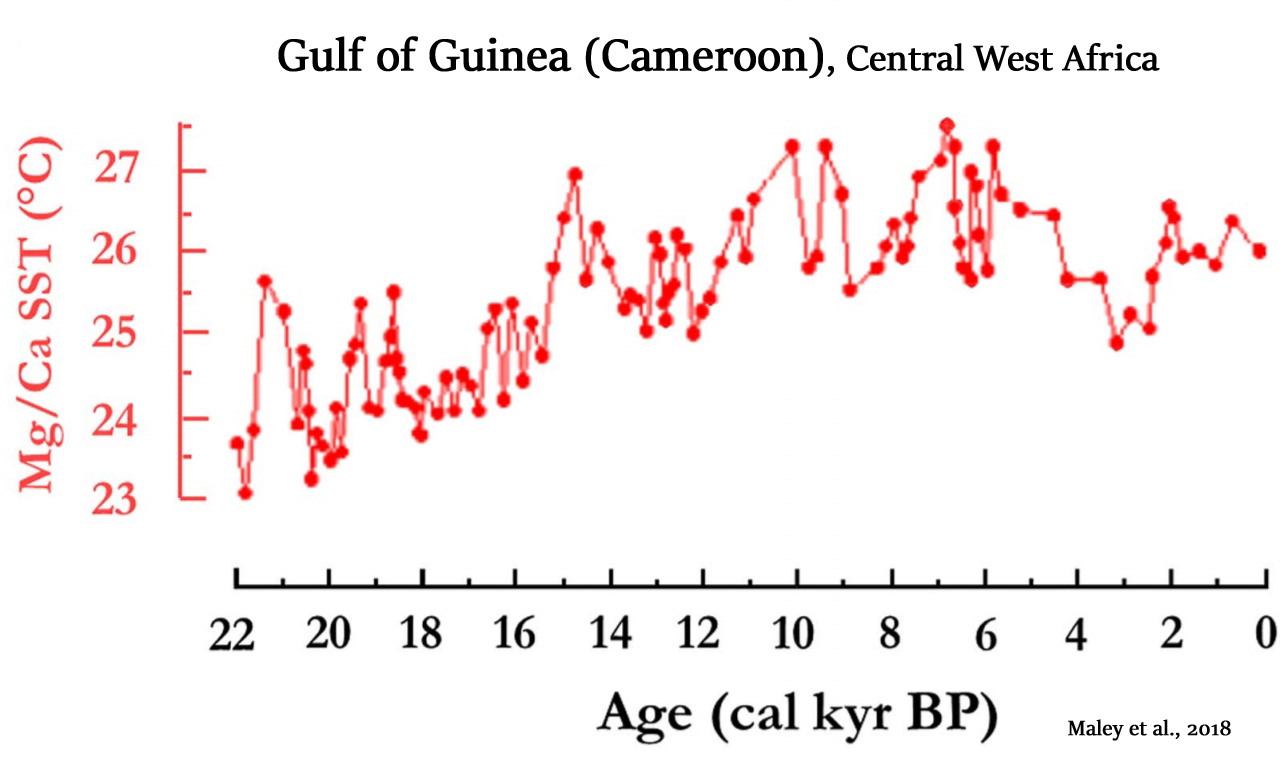
Maley et al., 2018
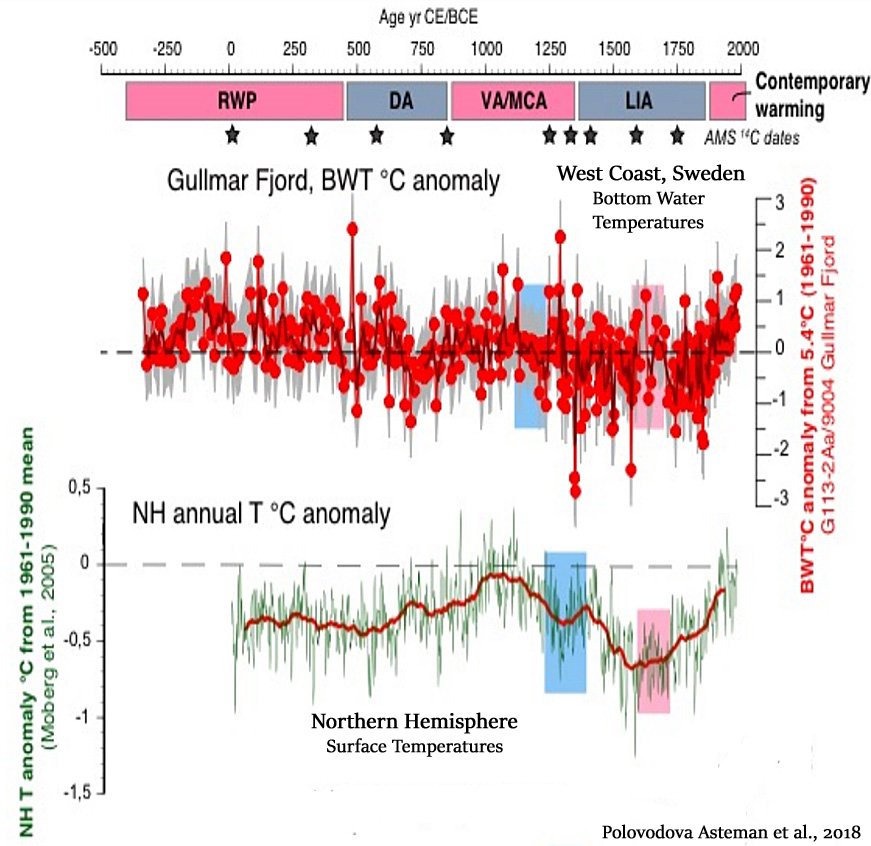
Polovodova Asteman et al., 2018
The record demonstrates a warming during the Roman Warm Period (~350 BCE – 450 CE), variable bottom water temperatures during the Dark Ages (~450 – 850 CE), positive bottom water temperature anomalies during the Viking Age/Medieval Climate Anomaly (~850 – 1350 CE) and a long-term cooling with distinct multidecadal variability during the Little Ice Age (~1350 – 1850 CE). The fjord BWT [bottom water temperatures] record also picks up the contemporary warming of the 20th century, which does not stand out in the 2500-year perspective and is of the same magnitude as the Roman Warm Period and the Medieval Climate Anomaly.

Papadomanolaki et al., 2018 (Baltic Sea)
A large fraction of the Baltic Proper became hypoxic again between 1.4 and 0.7 ka BP, during the Medieval Climate Anomaly (MCA), when mean air temperatures were 0.9–1.4 °C higher than temperatures recorded in the period 1961–1990 (e.g. Mann et al., 2009; Jilbert and Slomp, 2013).
20th/21st Centuries Non-Warming
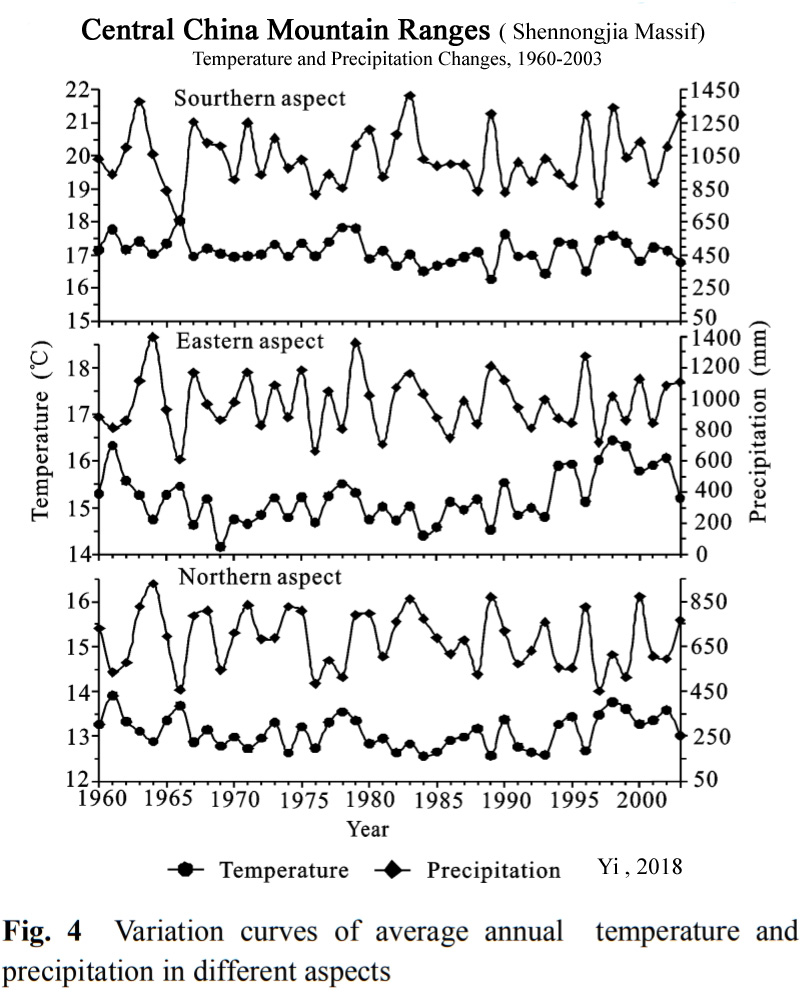
Yi, 2018
As measures of climate response, temperature and precipitation data from the north, east, and south-facing mountain ranges of Shennongjia Massif in the coldest and hottest months (January and July), different seasons (spring, summer, autumn, and winter) and each year were analyzed from a long-term dataset (1960 to 2003) to tested variations characteristics, temporal and spatial quantitative relationships of climates. The results showed that the average seasonal temperatures and precipitation in the north, east, and south aspects of the mountain ranges changed at different rates. The average seasonal temperatures change rate ranges in the north, east, and south-facing mountain ranges were from –0.0210 ℃/yr to 0.0143 ℃/yr, –0.0166 ℃/yr to 0.0311 ℃/yr, and –0.0290 ℃/yr to 0.0084 ℃/yr, respectively, and seasonal precipitation variation magnitude were from –1.4940 mm/yr to 0.6217 mm/yr, –1.6833 mm/yr to 2.6182 mm/yr, and –0.8567 mm/yr to 1.4077 mm/yr, respectively. The climates variation trend among the three mountain ranges were different in magnitude and direction, showing a complicated change of the climates in mountain ranges and some inconsistency with general trends in global climate change.
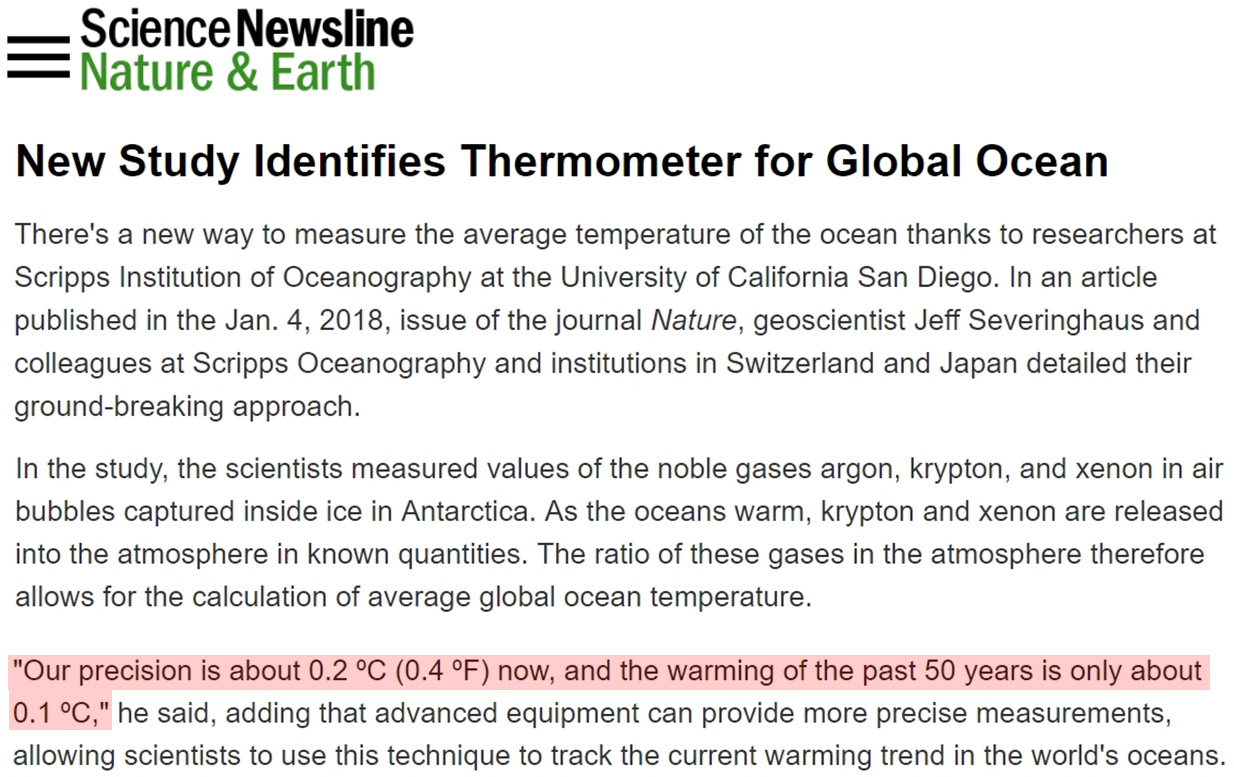
Bereiter et al., 2018
Our reconstruction provides unprecedented precision and temporal resolution for the integrated global ocean, in contrast to the depth-, region-, organism- and season-specific estimates provided by other methods. We find that the mean global ocean temperature is closely correlated with Antarctic temperature and has no lead or lag with atmospheric CO2, thereby confirming the important role of Southern Hemisphere climate in global climate trends. We also reveal an enigmatic 700-year warming during the early Younger Dryas period (about 12,000 years ago) that surpasses estimates of modern ocean heat uptake.

“Our precision is about 0.2 ºC (0.4 ºF) now, and the warming of the past 50 years is only about 0.1 ºC,” he said, adding that advanced equipment can provide more precise measurements, allowing scientists to use this technique to track the current warming trend in the world’s oceans.
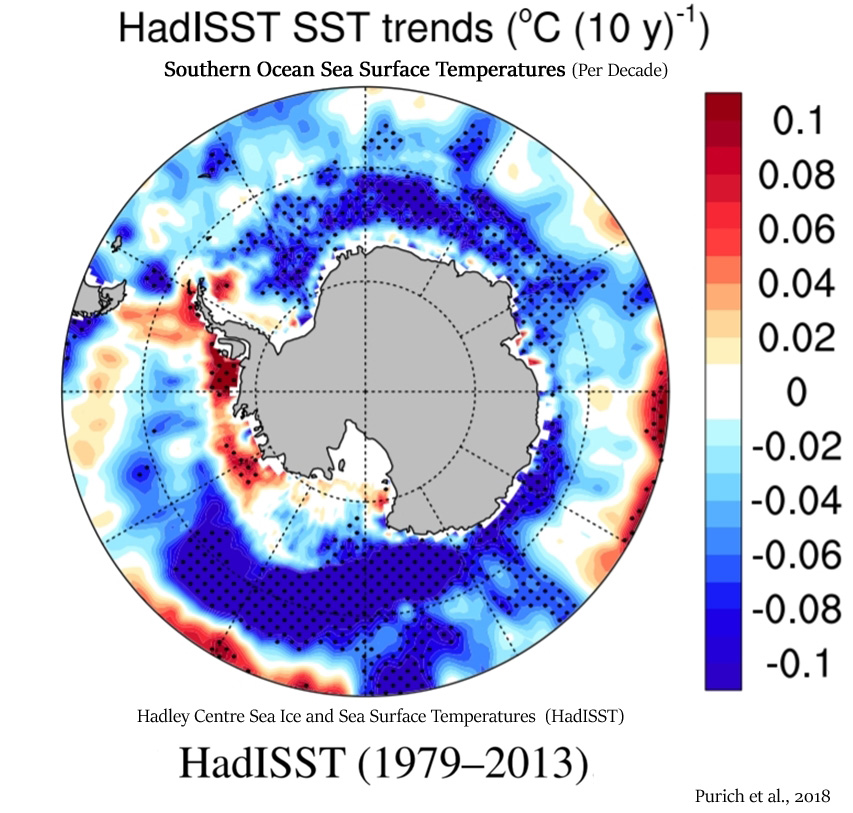
Purich et al., 2018
Observed Southern Ocean changes over recent decades include a surface freshening (Durack and Wijffels 2010; Durack et al. 2012; de Lavergne et al. 2014), surface cooling (Fan et al. 2014; Marshall et al. 2014; Armour et al. 2016; Purich et al. 2016a) and circumpolar increase in Antarctic sea ice (Cavalieri and Parkinson 2008; Comiso and Nishio 2008; Parkinson and Cavalieri 2012). … [A]s high-latitude surface freshening is associated with surface cooling and a sea ice increase, this may be another factor contributing to the CMIP5 models excessive Southern Ocean surface warming contrasting the observed surface cooling (Marshall et al. 2014; Purich et al. 2016a), and sea ice decline contrasting the observed increases (Mahlstein et al. 2013; Polvani and Smith 2013; Swart and Fyfe 2013; Turner et al. 2013; Zunz et al. 2013; Gagne et al. 2015) over recent decades. … Our results suggest that recent multi-decadal trends in large-scale surface salinity over the Southern Ocean have played a role in the observed surface cooling seen in this region. … The majority of CMIP5 models do not simulate a surface cooling and increase in sea ice (Fig. 8b), as seen in observations.
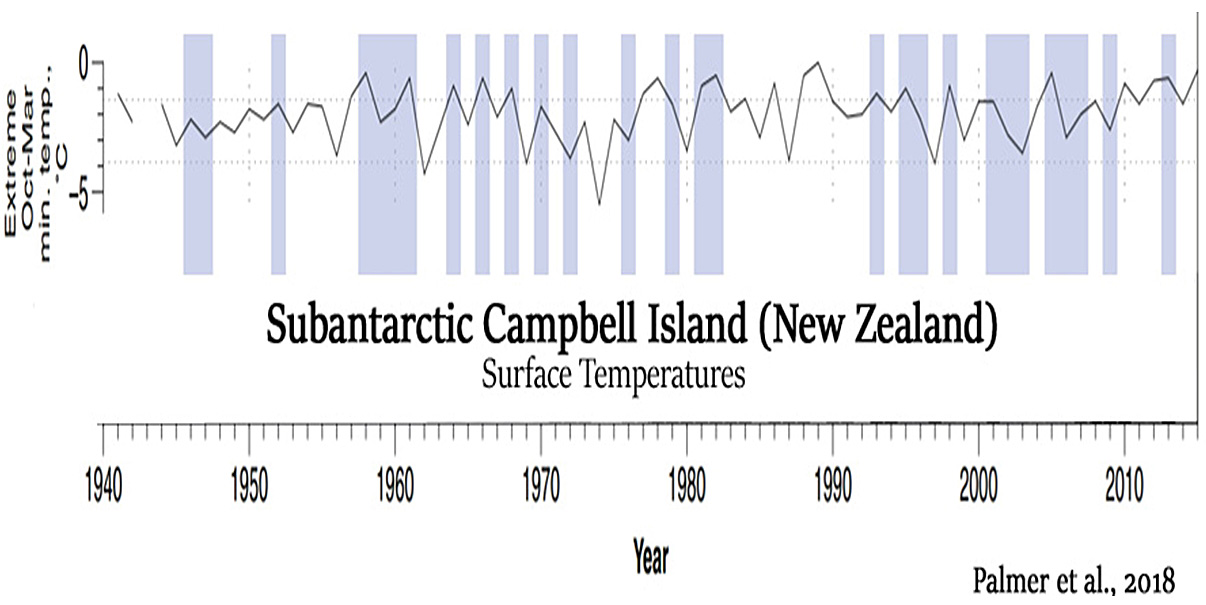
Cerrone and Fusco, 2018
Compelling evidence indicates that the large increase in the SH sea ice, recorded over recent years, arises from the impact of climate modes and their long-term trends. The examination of variability ranging from seasonal to interdecadal scales, and of trends within the climate patterns and total Antarctic sea ice concentration (SIC) for the 32-yr period (1982–2013), is the key focus of this paper. The results herein indicate that a progressive cooling has affected the year-to-year climate of the sub-Antarctic since the 1990s. This feature is found in association with increased positive SAM and SAO phases detected in terms of upward annual and seasonal trends (in autumn and summer) and upward decadal trends. In addition, the SIC [sea ice concentration] shows upward annual, spring, and summer trends, indicating the insulation of Antarctica from the warmer flows in the midlatitudes.


To preempt Sebastian, even if these papers are “cherrypicked” to prove a particular point, they do show that the science is not “settled”.
In order to cherry pick, there needs to be something to pick. This to me looks like a rather large early harvest!
Hmm, are those temperature graphs really showing the last few decades of warming or is this rather a collection of proxy data that ends somewhere in the mid 20th century?
I only use the term cherry picking when describing Kenneth’s choice of quotes from papers. I am sure one can find out what those papers are really saying when actually reading them rather than trusting his choices 🙂
Continue posting comments mentioning my handle please … I’m so interested in what you think I would write or think … Not.
Empty comment again from seb.
We are in a cooler period of the Holocene.
GET OVER IT. !!
We are not interested in your child-troll zero-science attention-seeking claptrap either , seb.
At what point will you be posting the data (from actual scientific papers) that say the oceanic biosphere cannot adjust to the speed at which the ocean waters have been “acidifying” during the last 200 years? You claimed you had that data, but have failed to produce it. This is the 6th time I have asked.
Also, please provide the data you claim to have that the satellites show the Earth is browning, or that deserts across the Earth are expanding. You said you had that data…but have failed to produce it too.
Finally, you claimed that elevated CO2 causes crop quality to decline…and that you had scientific data to back this up. Once again, you have failed to provide any supporting evidence for this too.
Perhaps you’ve noticed, but I have decided not to let you hurl your baseless claims about having data to support your climate change alarmist beliefs on these comment boards and then scurry off for a few days when asked to produce them. That’s what you do: fabricate/make up stuff and then refuse to respond when called on it. So I will be continuing to press you to back up your claims until you either (a) do so, or (b) admit you were fabricating when you wrote that you have the data.
No point, Kenneth.
He will just keep RUNNING and HIDING… yapping baseless and meaningless troll-like attention-seeking snipes.
Like he has RUN and squirmed around, avoiding producing a single paper that proves empirically that CO2 causes warming our convective atmosphere.
Kenneth, do you have the original source paper for this graph?
https://notrickszone.com/wp-content/uploads/2017/03/Arctic-Sea-Ice-Holocene-Stein-17.jpg
That clown Nick Stokes is making the claim it was not in the paper, I know I have seen it in the original paper, an upright trio of graphs, but can’t find the link.
The link is here:
Stein et al., 2017
http://onlinelibrary.wiley.com/doi/10.1002/jqs.2929/abstract
It’s behind a paywall, but if you click on the “view .pdf” and then the “view preview” under that, you can see the graph is about halfway down, inverted sideways. The only part I added was the commonly recognized warming and cooling epochs (MWP, LIA) with arrows. I have no idea why this has become contentious.
In fact, Yamamoto et al. (2017) used the Stein graph’s trend line (blue in the image below) in their paper published later in 2017. Here’s the graph:
—
1. https://notrickszone.com/wp-content/uploads/2017/11/Holocene-Arctic-Sea-Ice-Changes-Chukchi-Sea-Yamamoto-2017.jpg
Yamamoto et al., 2017
https://www.clim-past.net/13/1111/2017/cp-13-1111-2017.pdf
“Millennial to multi-centennial variability in the quartz / feldspar ratio (the BG [Beaufort Gyre] circulation) is consistent with fluctuations in solar irradiance, suggesting that solar activity affected the BG [Beaufort Gyre] strength on these timescales. … The intensified BSI [Bering Strait in-flow] was associated with decrease in sea-ice concentrations and increase in marine production, as indicated by biomarker concentrations, suggesting a major influence of the BSI on sea-ice and biological conditions in the Chukchi Sea. Multi-century to millennial fluctuations, presumably controlled by solar activity, were also identified in a proxy-based BSI record characterized by the highest age resolution. … Proxy records consistent with solar forcing were reported from a number of paleoclimatic archives, such as Chinese stalagmites (Hu et al., 2008), Yukon lake sediments (Anderson et al., 2005), and ice cores (Fisher et al., 2008), as well as marine sediments in the northwestern Pacific (Sagawa et al., 2014) and the Chukchi Sea (Stein et al., 2017).”
—
Another 2017 paper shows an almost identical trajectory for Arctic sea ice, this time in the region north of Iceland. The authors also mention the variations in sea ice corresponding to the main warming/cooling epochs.
—
2. https://notrickszone.com/wp-content/uploads/2017/11/Arctic-Sea-Ice-Extent-North-of-Iceland-3000-Years-Moffa-S%C3%A1nchez-and-Hall-2017.jpg
Moffa-Sánchez and Hall, 2017
https://www.nature.com/articles/s41467-017-01884-8
“Periods of increased influence of polar waters in the eastern Labrador Sea, reduced LSW [Labrador Sea Water] formation and weaker subpolar gyre largely coincide with well-established cold periods recorded in glacier advances, tree-ring and pollen records in the circum-North Atlantic and northwest Europe [Dark Ages Cold Period, Little Ice Age]. … Conversely, periods of reduced influence of polar waters in the eastern Labrador Sea, stronger subpolar gyre and increase LSW [Labrador Sea Water] formation largely coincide with mild/warm periods in Europe namely the Roman Warm Period and the Medieval Climatic Anomaly.”
In a 2018 paper, Arctic sea ice was once again shown to correspond to the changes shown in Stein et al. (2017), with much lower SIC during the MWP, RWP, and throughout the Holocene than now. The current SIC is only slightly below the LIA’s according to Perner et al. (2018).
—
3. https://notrickszone.com/wp-content/uploads/2018/01/Holocene-Arctic-Sea-Ice-Iceland-North-Perner-2018.jpg
Perner et al., 2018
http://www.sciencedirect.com/science/article/pii/S0277379117305930
“Phases of dominant El Niño-like states occur parallel to North Atlantic cold phases: the ‘2800 years BP cooling event’, the ‘Dark Ages’ and the ‘Little Ice Age’, whereas the ‘Roman Warm Period’ and the ‘Medieval Climate Anomaly’ parallel periods of a predominant La Niña-like state. Our findings provide further evidence of coherent interhemispheric climatic and oceanic conditions during the mid to late Holocene, suggesting ENSO as a potential mediator.”
—
And finally, we have another 2017 paper, Kolling et al., that also shows the same Holocene trajectory, linking sea ice changes to the main warming/cooling epochs, this time for East Greenland (green, middle).
—
4. https://notrickszone.com/wp-content/uploads/2017/04/Arctic-Sea-Ice-Extent-900-AD-to-2000-AD-Kolling-2017.jpg
Kolling et al., 2017
http://www.sciencedirect.com/science/article/pii/S0031018217301554
“[O]ur reconstructions reveal several oscillations with increasing/decreasing sea ice concentrations that are linked to the known late Holocene climate cold/warm phases, i.e. the Roman Warm Period, Dark Ages Cold Period, Medieval Climate Anomaly and Little Ice Age. The observed changes seem to be connected to general ocean atmosphere circulation changes, possibly related to North Atlantic Oscillation and Atlantic Multidecadal Oscillation regimes.”
—
So here are 4 other papers, and with Stein et al. (2017) that makes 5, that all show the same sea ice trajectory for the late Holocene and modern period. Feel free to copy/paste this post and its images elsewhere.
P.S. For a graph showing that 20th/21st century sea ice is effectively as low now as during the 1930s and 1940s, see Connolly et al., 2017:
https://notrickszone.com/wp-content/uploads/2017/10/Arctic-Sea-Ice-Alekseev-2016-as-shown-in-Connolly-2017.jpg
Thanks Kenneth
Nick actually posted the image that the chart I asked about came from…
… then said it wasn’t there.
HILARIOUS to say the least. 🙂
https://wattsupwiththat.com/2018/01/19/nasa-2017-was-2nd-warmest-year-noaa-says-3rd-warmest-el-nino-a-major-warming-influence/comment-page-1/#comment-2721626
Wow. So he provides an image of the graph shown that is identical to the one I presented. The North Iceland (purple) one had to be inverted to be orientated the same way as the other graphs (present <--- past) and turned upside down (because the "More Sea Ice" arrow pointed down instead of up, which is the opposite of the other graphs). The ONLY purpose of inverting graphs is to make them user-friendly for readers. If they all face the same direction, the better. Most people don't do more than glance at a series of graphs...so I need to make them visually accessible. And I have no idea why Nick has a problem with calling them Holocene Arctic sea ice trends, or labeling the warming/cooling epochs associated with the increases and decreases. The scientists themselves do that in their papers.
Nick used to work for CSIRO,
He is DESPERATELY fighting an anti-science rear-guard action in a vain attempt to hold up the AGW FARCE.
You think seb can twist and squirm and avoid ..
.. He has nothing on Nick !!
But at least Nick has a modicum of basic intelligence. 😉
It looks as though Nick is claiming that when a sea ice graph says “More Ice” with an arrow pointing upwards or downwards, it suddenly ceases to be a proxy for sea ice. All the reconstructions clearly point to the direction where there is more sea ice vs. less.
Here are two more 1800s-present Arctic sea ice graphs for him to squirm around.
Ran et al., 2010
https://notrickszone.com/wp-content/uploads/2016/11/Arctic-Sea-Ice-Iceland-1903-2006-Ran-10.jpg
https://notrickszone.com/wp-content/uploads/2018/01/Holocene-Cooling-Beaufort-Sea-Arctic-Ocean-Durantou-2012.jpg
Durantou et al., 2012
http://www.biogeosciences.net/9/5391/2012/bg-9-5391-2012.pdf
“Sea surface temperature [Arctic Ocean] between ∼ AD 1885–1935 are warmer by up to 3°C with respect to the average modern temperature at the coring site. For the period ∼ AD 1887–1945, reconstructed sea ice cover values are on average 8.3 months per year which is 1.1 months per year lower than the modern values.”
Sebastian, you are what my children would refer to as an “egg”, or “[snip]”.
These terms are used to describe those who do, or say stupid things, […], respectively.
Oh CO2 fingerprint where are you?
Hiding in the deep oceans again? 🙂
[…] Read More: Source […]
[…] Read More: Source […]
Simple, Objective and Inexpensive Approach to Exposing the CAGW Hoax; Live By The Computer, Die By The Computer
This is a very very very easy to expose the fraud that CAGW truly is, and it would be done objectively and removed from political and personal bias. President Trump should demand that “Stepwise” be run on all Tax-Payer Funded climate models, and the results of the “Stepwise” model should be compared to the results of the existing model. If the R-Square, or explanatory power, of the “Stepwise” model, is greater than the existing climate model, then you have the case for possible scientific fraud. It will at least force the slimate clientists to acknowledge that there are factors far far far more important to the climate than CO2. Slimate clientists have chosen the computer as their weapon in this war, so President Trump should fight back using the computer. Like the Frankenstein Monster, the creation can be used to turn on its creators. Computers won’t lie, slimate climatists will and do, and “Stepwise” can prove it. The very computer models the IPCC created to manufacture the CAGW Myth can be used to destroy it.
https://co2islife.wordpress.com/2018/01/19/simple-objective-and-inexpensive-approach-to-exposing-the-cagw-hoax-live-by-the-computer-die-by-the-computer/
OT, Due to shut-down of coal, basically all Eastern Australia is on a knife-edge for electricity.
No decent RELIABLE upgrades to the system in MANY years (except in Queensland)
This really has got to the FARCE stage
http://joannenova.com.au/2018/01/peak-heat-electricity-prices-lifting-off-industry-shutting-off-in-australia/
[…] A retrieval script follows. For now, here is a graphic showing the deleted data in red. Figure 1. Contrary to Gavin Schmidt’s claim that the decline is “hidden in plain sight”, the inconvenient data has simply been deleted. The reason, as explained on Sep 22, 1999 by Michael Mann to coauthors in 938018124.txt, was to avoid giving “fodder to the skeptics”. Figure 2. Retrieval script: #1. . #2. #Comparison briffa=ts.union(archive= Briffa[,"Briffa01"],gate ) briffa=window(briffa,start=1402,end=1994) # plot.ts(briffa) X=briffa Like this: The Proliferation Of Non-Global Warming Graphs In Science Journals Continues Unabated In 2018. […]