NON-Global Warming
Emphatically Emerges
…in 122 (2017) scientific papers
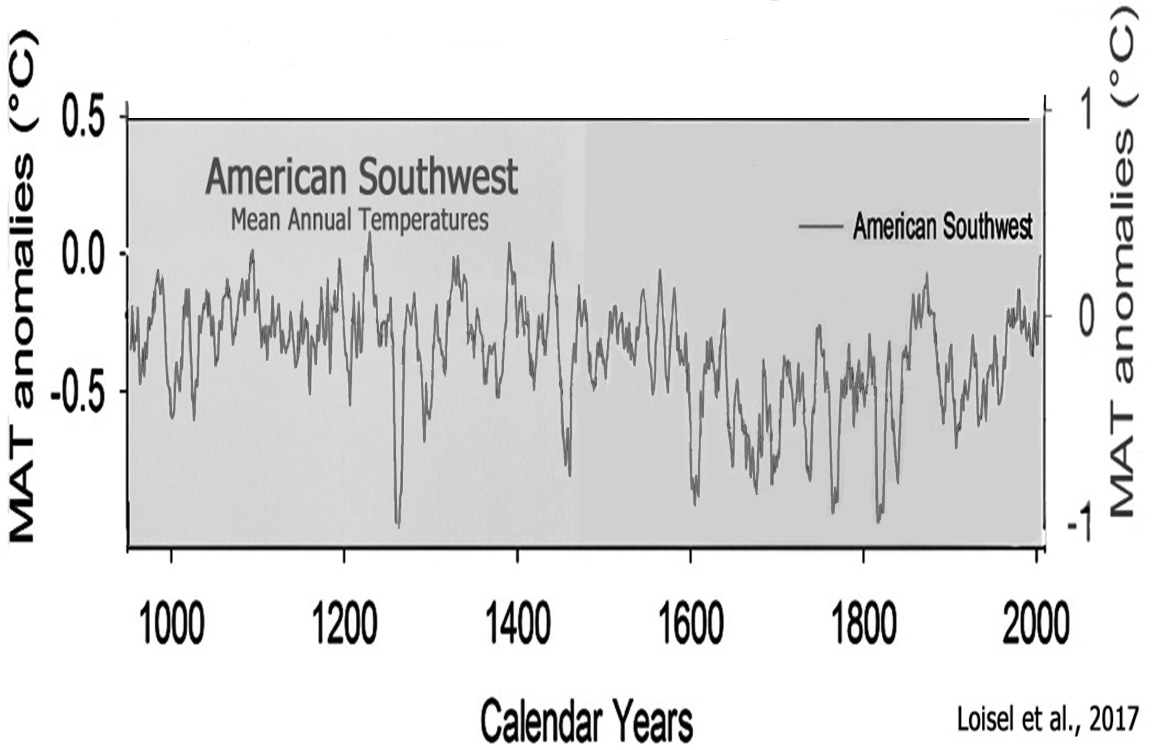
Image Source: Loisel et al., 201
2017: 150 Graphs, 122 Scientific Papers
In the last 12 months, 150 graphs from 122 peer-reviewed scientific papers have been published that undermine the popularized conception of a slowly cooling Earth temperature history followed by a dramatic hockey-stick-shaped uptick, or an especially unusual global-scale warming during modern times.
Yes, some regions of the Earth have been warming in recent decades or at some point in the last 100 years.
Some regions have been cooling for decades at a time.
And many regions have shown no significant net changes or trends in either direction relative to the last few hundred to thousands of years.
Succinctly, then, scientists publishing in peer-reviewed journals have increasingly affirmed that there is nothing historically unprecedented or remarkable about today’s climate when viewed in the context of long-term natural variability.
The following (partial) list has been organized by geographical region.
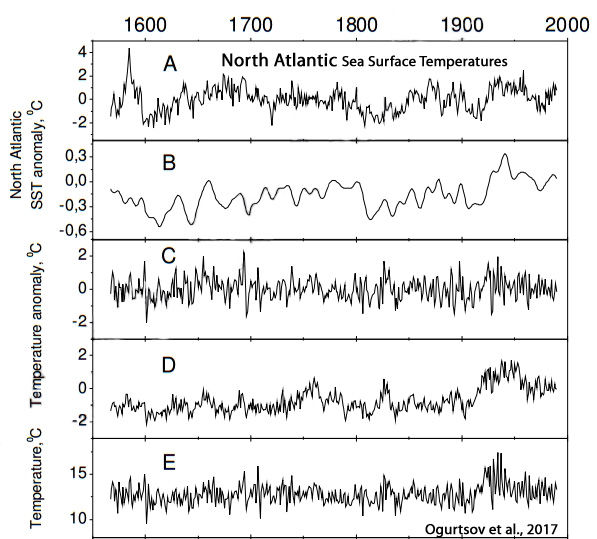
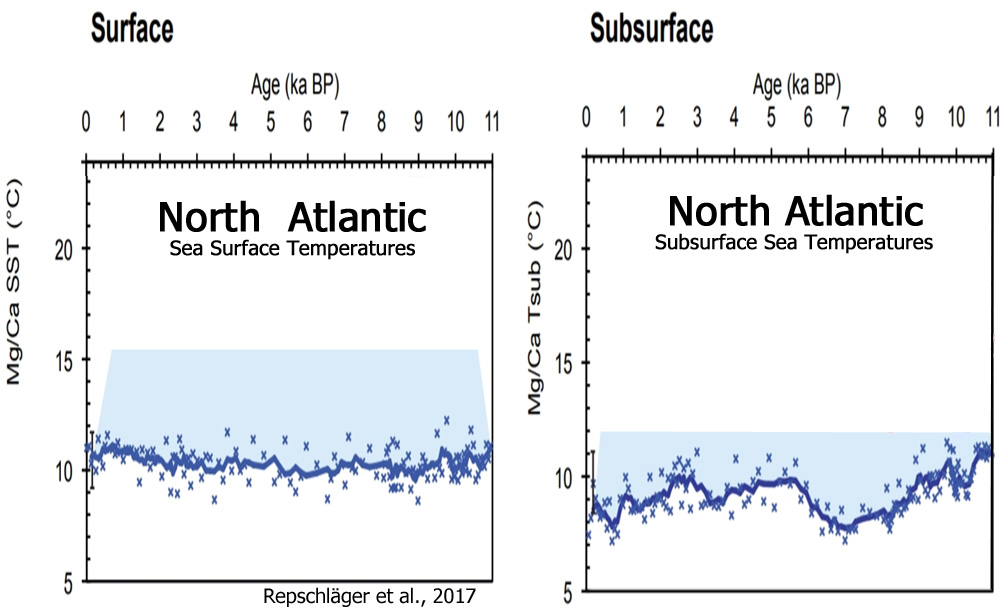
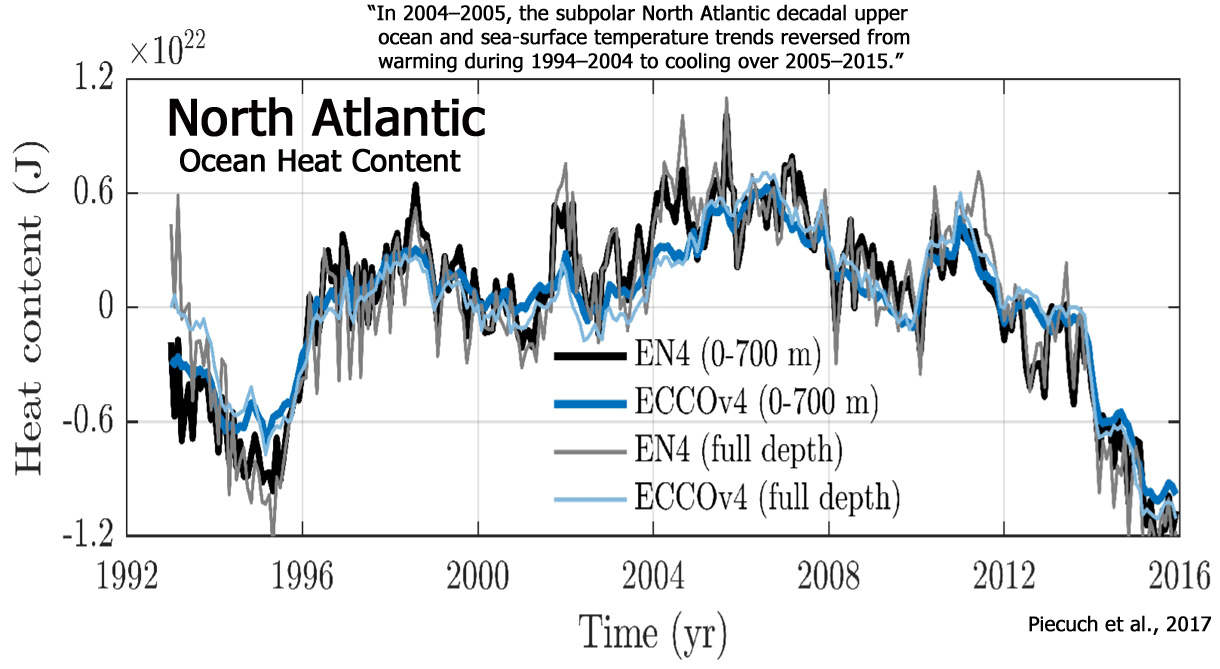
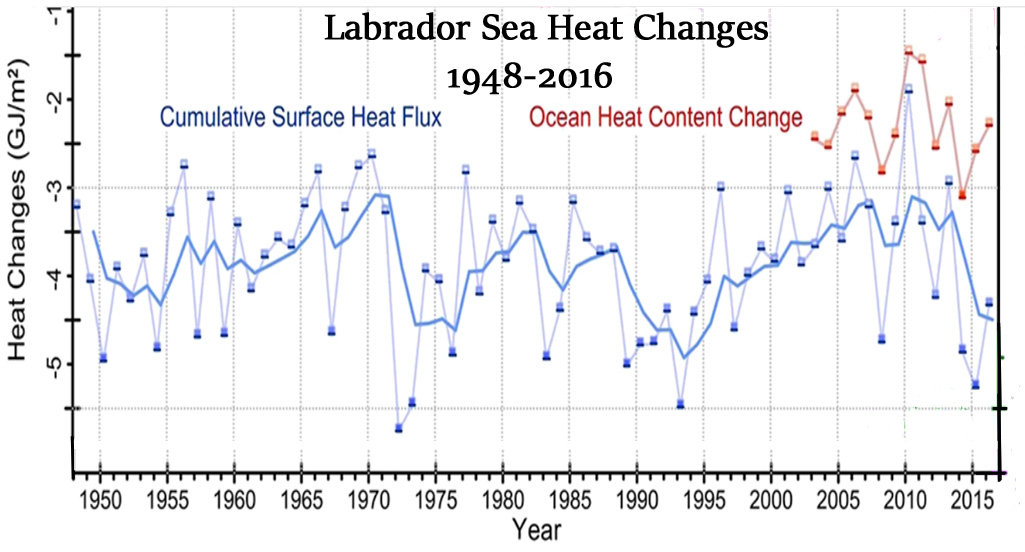
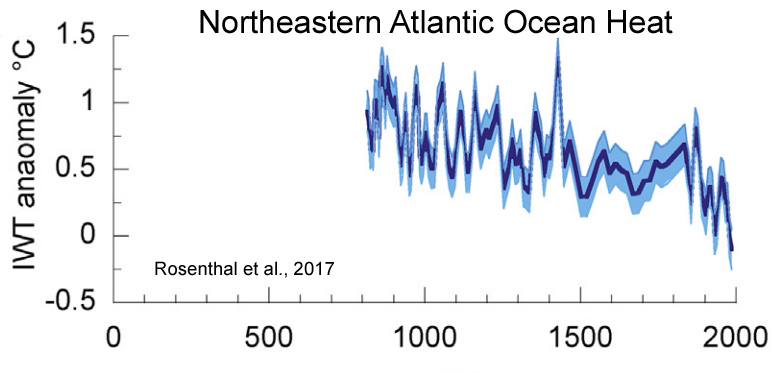
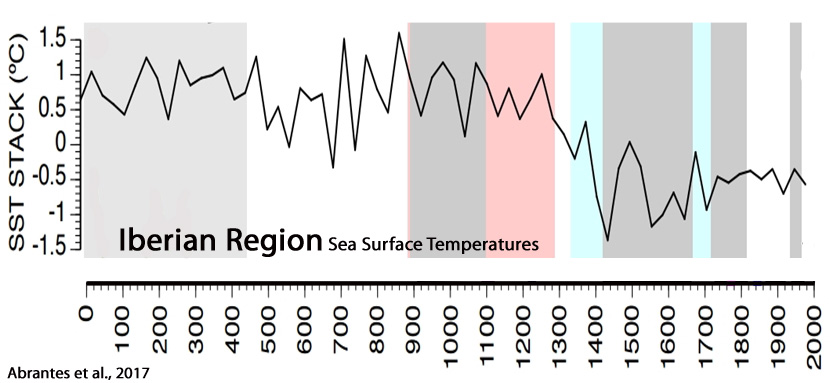
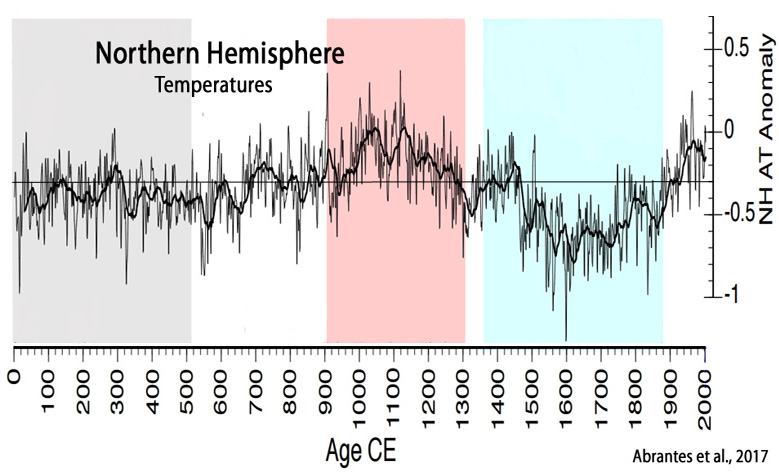
1. North Atlantic
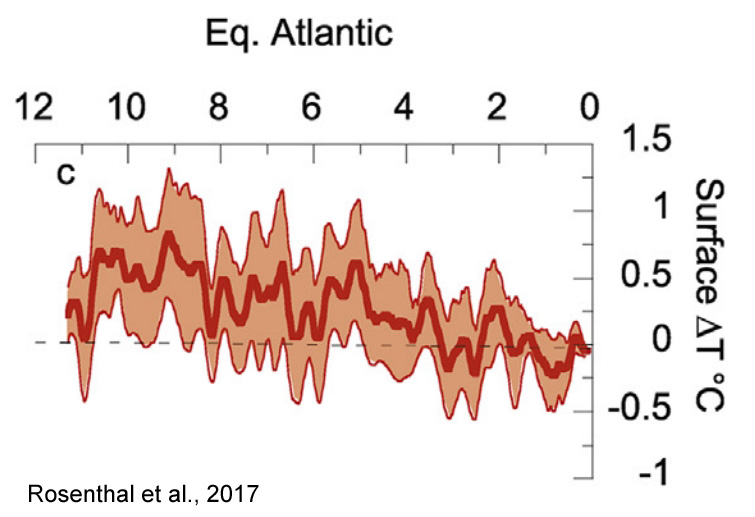
Ogurtsov et al., 2017, Kim et al., 2017, Repschläger et al., 2017, Piecuch et al., 2017, Yashayaev and Loder, 2017, Rosenthal et al., 2017, Abrantes et al., 2017


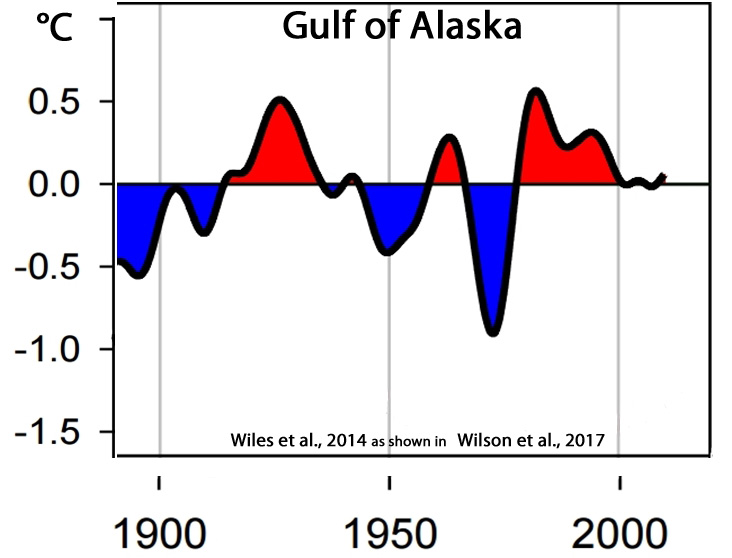
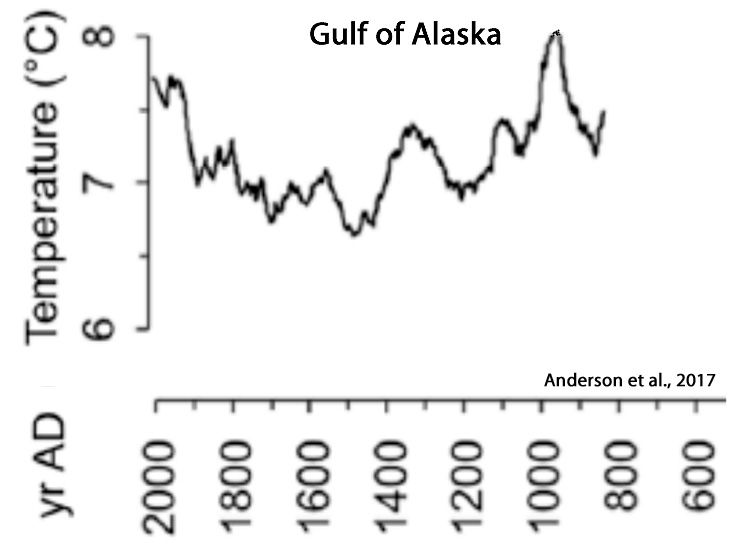
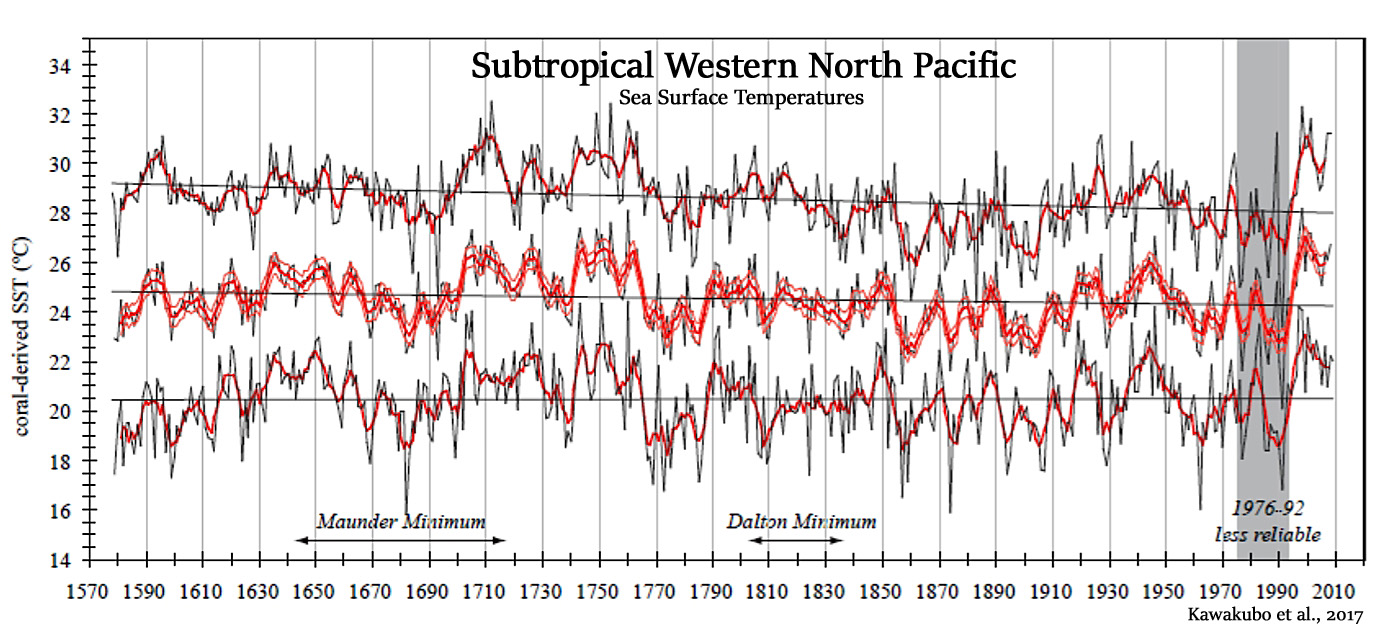
2. North Pacific
Wilson et al., 2017, Anderson et al., 2017, Kawakubo et al., 2017

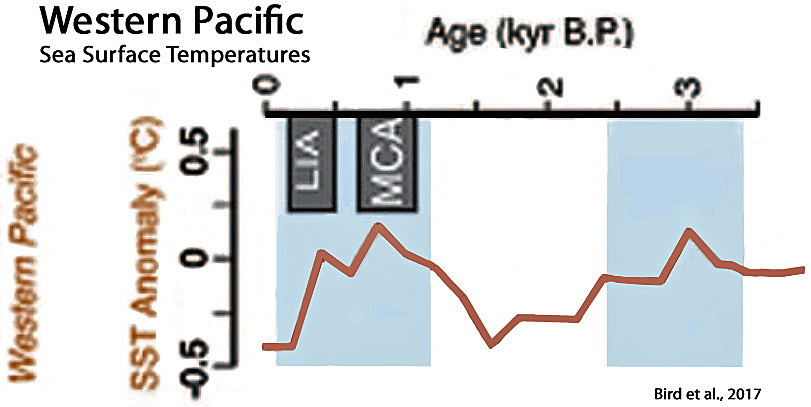
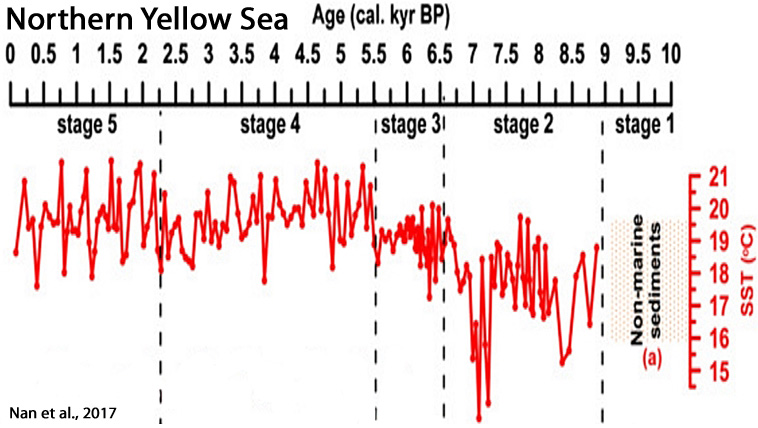
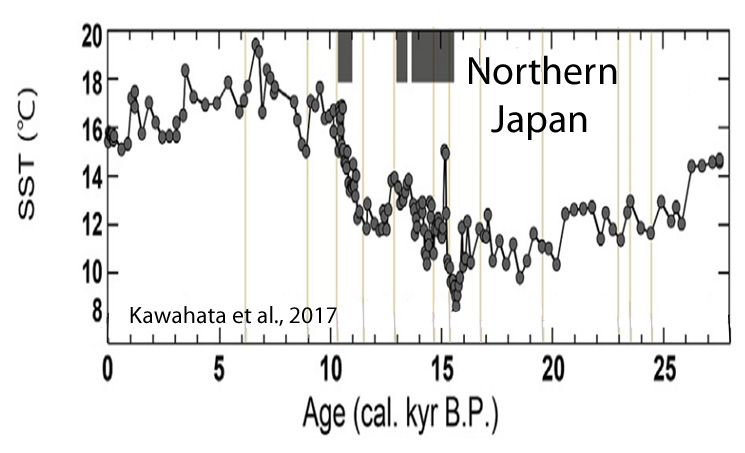
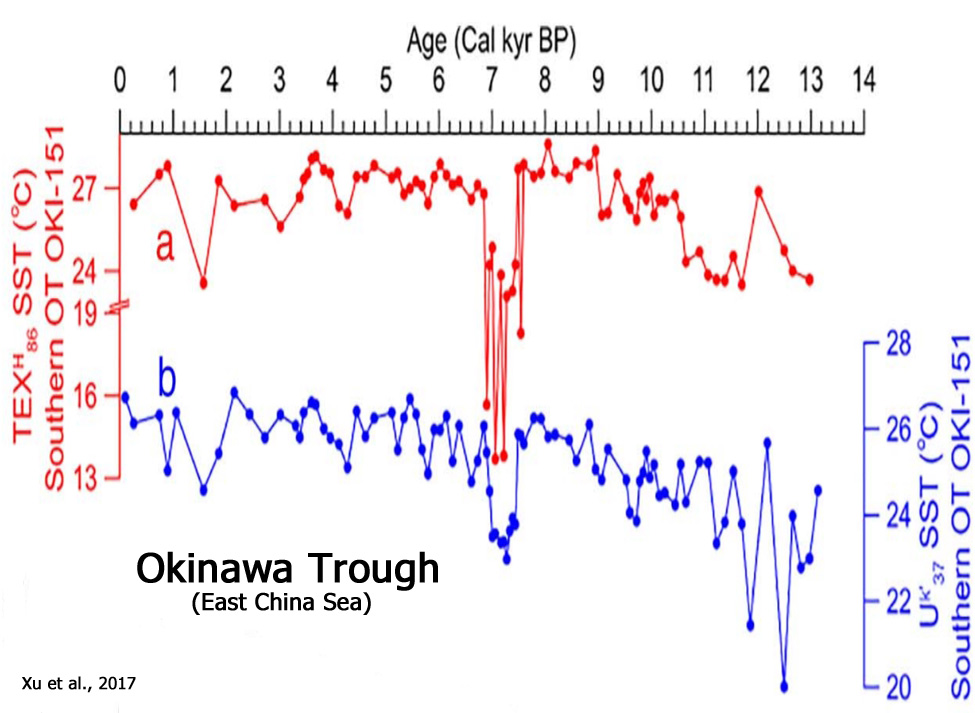
3. Western Pacific
Bird et al., 2017, Dodrill et al., 2017, Nan et al., 2017, Kawahata et al., 2017, Deng et al., 2017, Kong et al., 2017, Xu et al., 2017, Sun et al., 2017


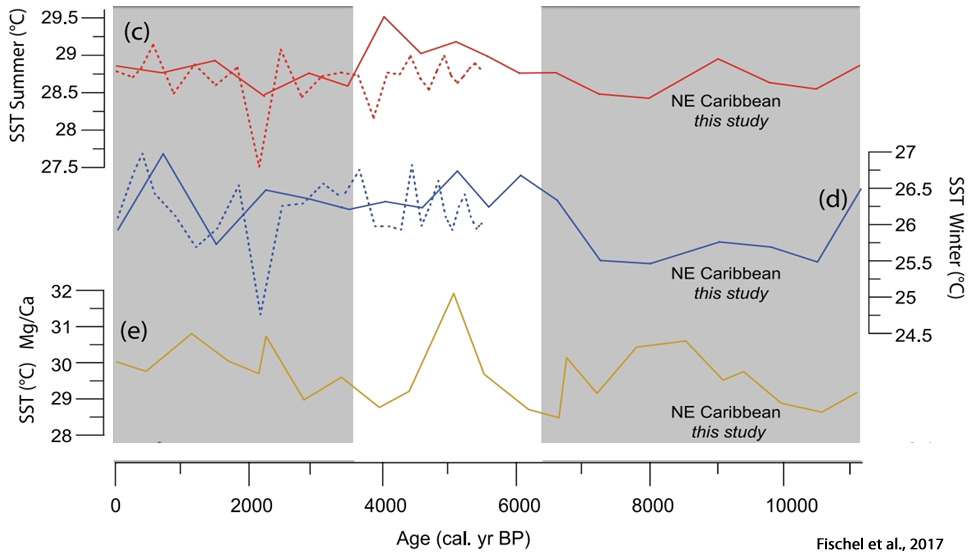
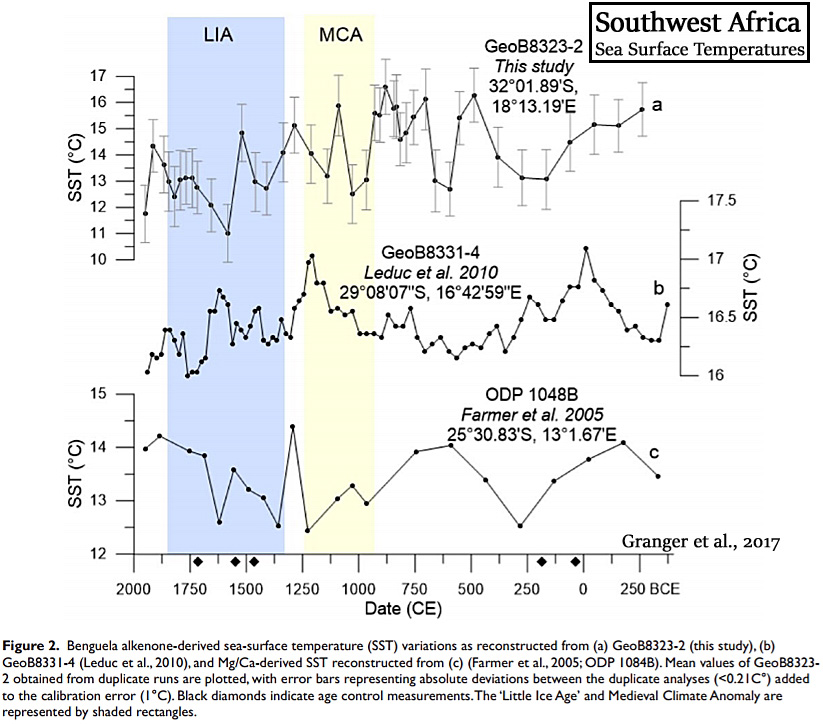
4. Tropical Atlantic
Rosenthal et al., 2017, Flannery et al., 2017, Fischel et al., 2017, Granger et al., 2017

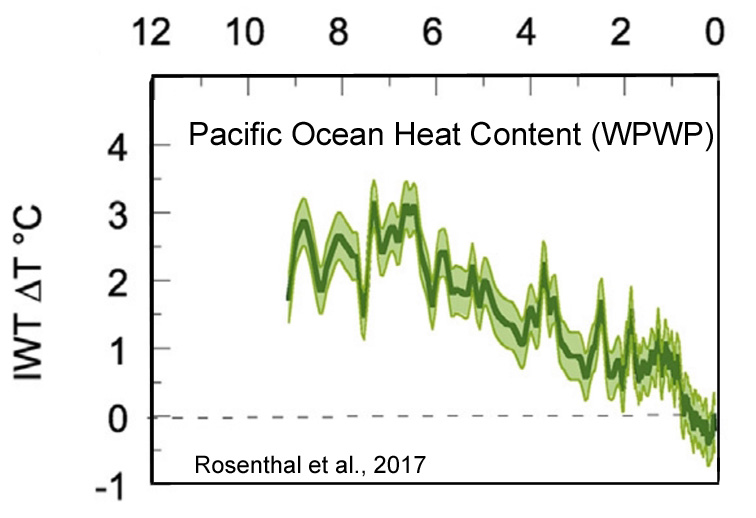
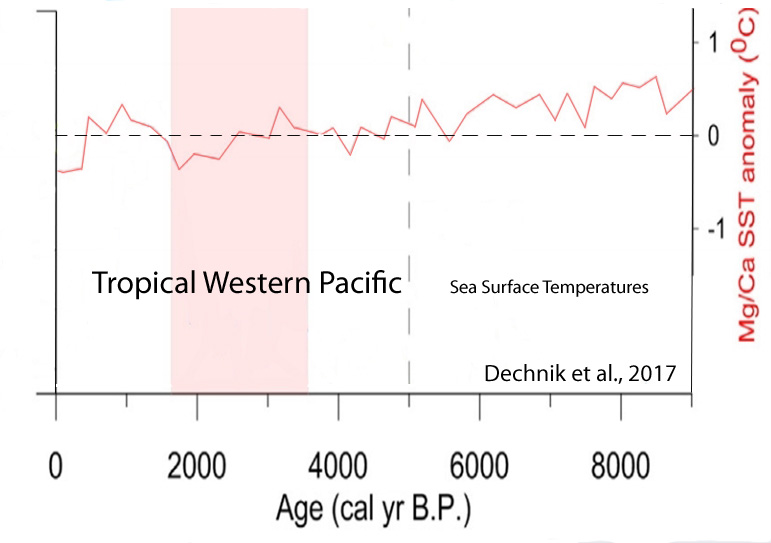
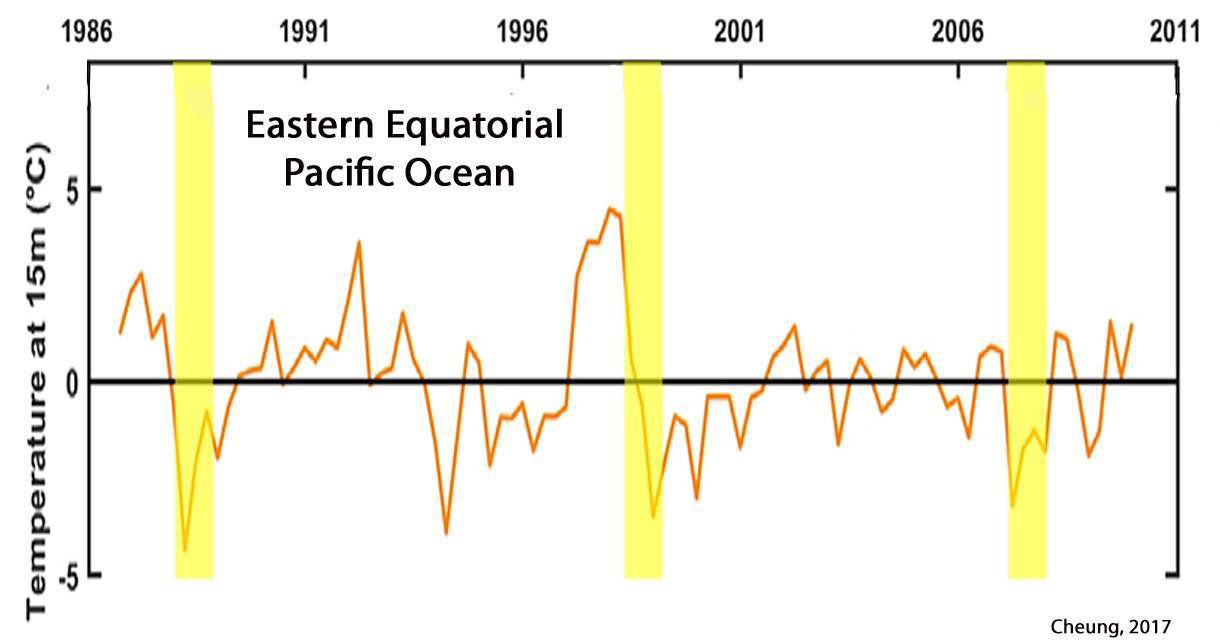
5. Tropical Pacific
Rosenthal et al., 2017, Zhang et al., 2017, Dechnik et al., 2017, Cheung, 2017

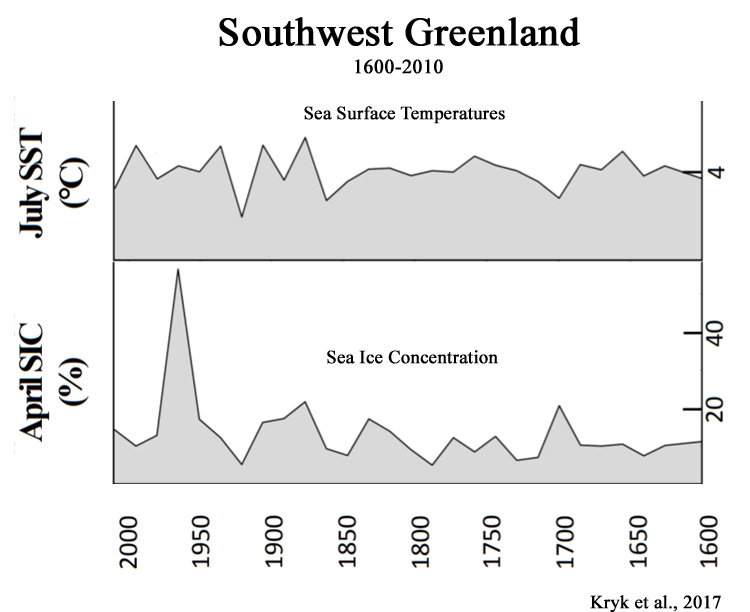
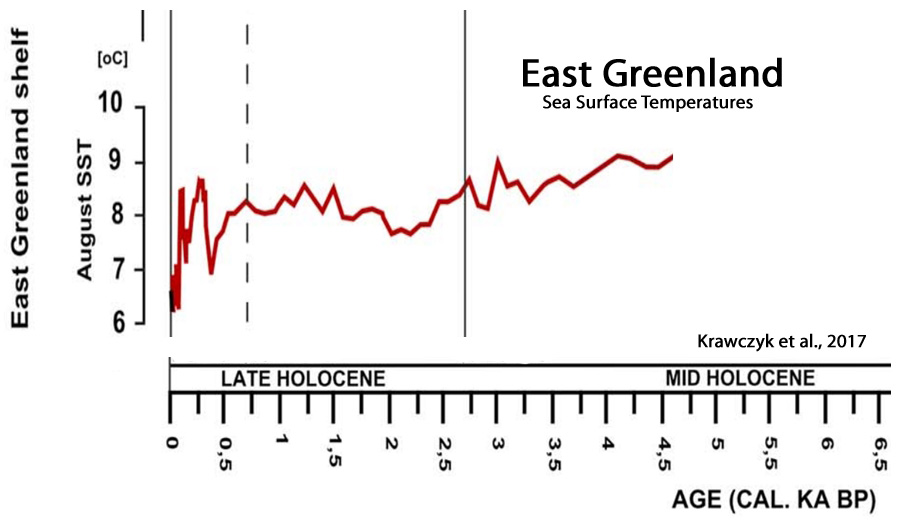
6. Southwest Greenland, East Greenland
Kryk et al., 2017, Krawczyk et al., 2017
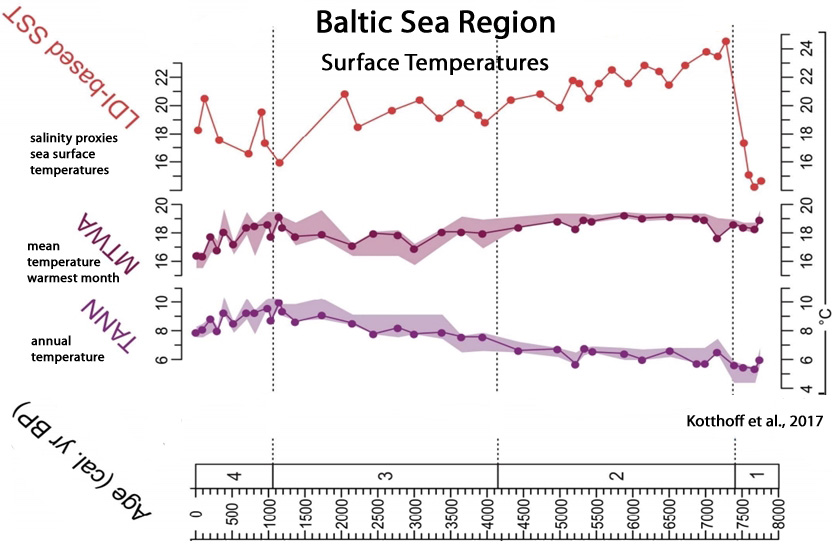
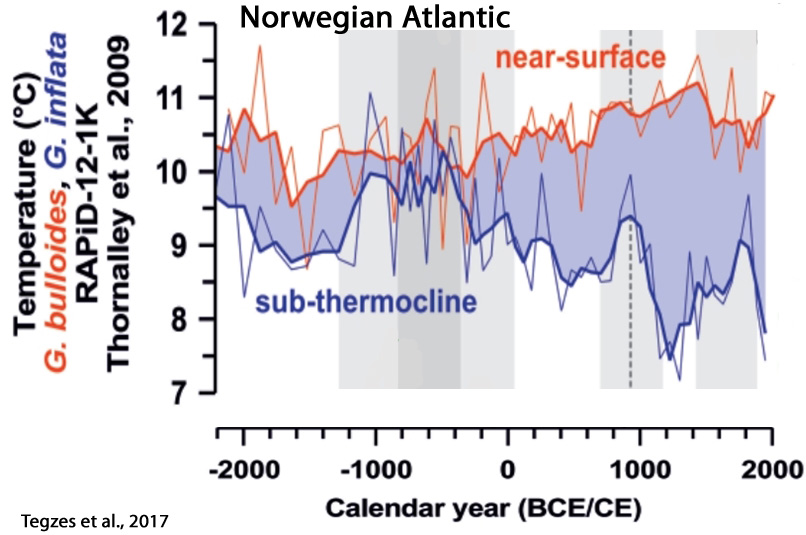
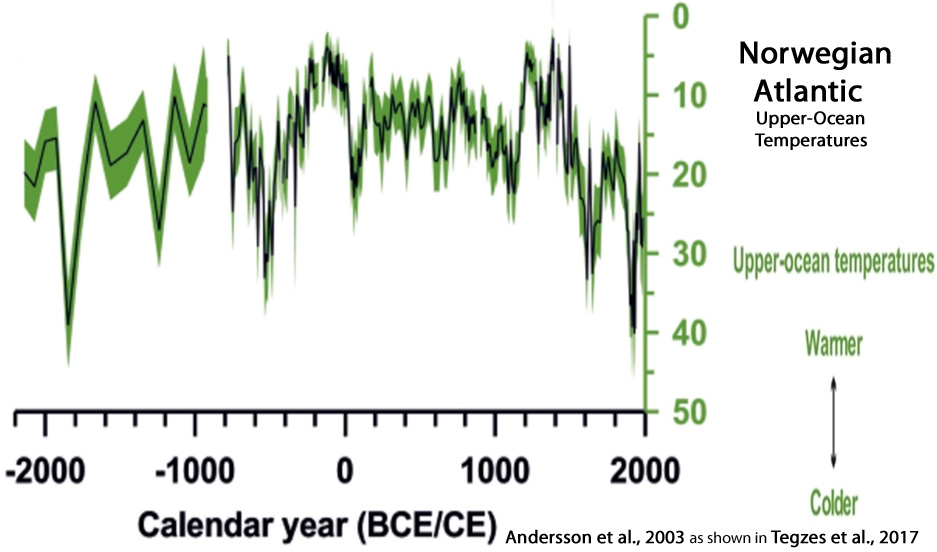
7. Nordic Seas
Kotthoff et al., 2017, Tegzes et al., 2017
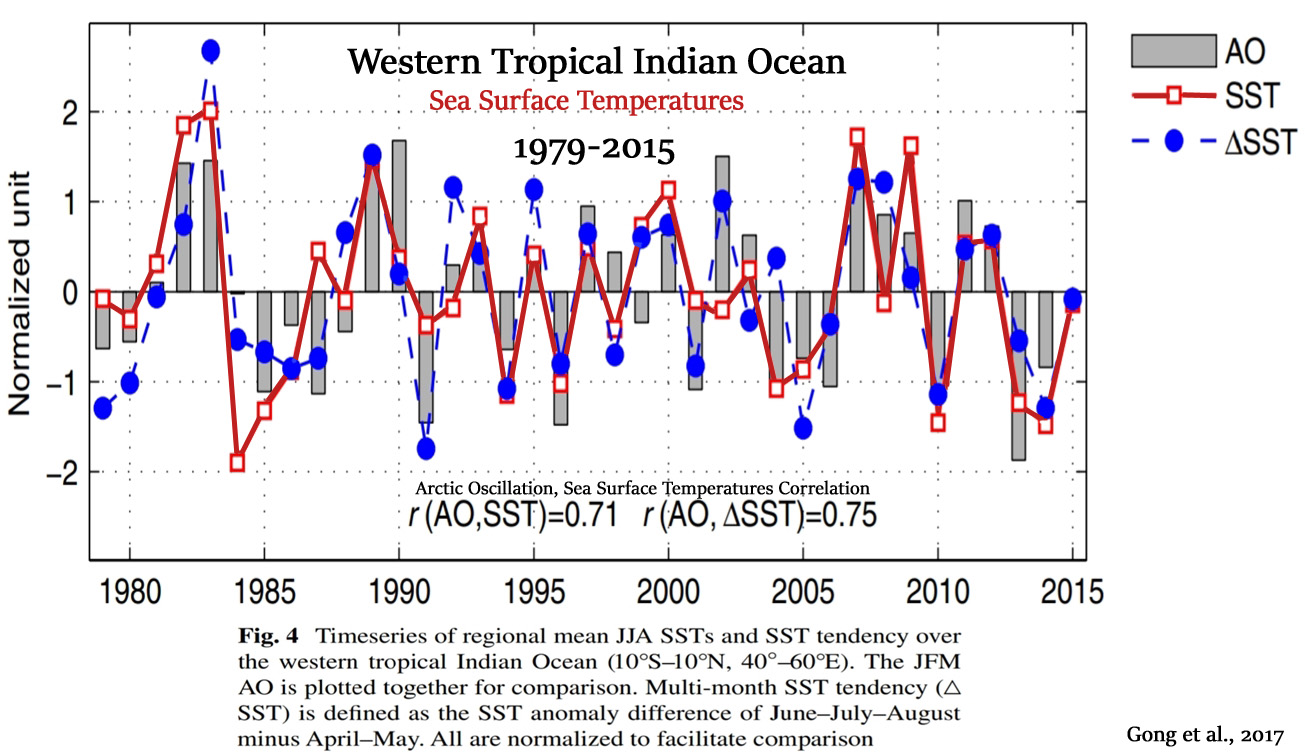
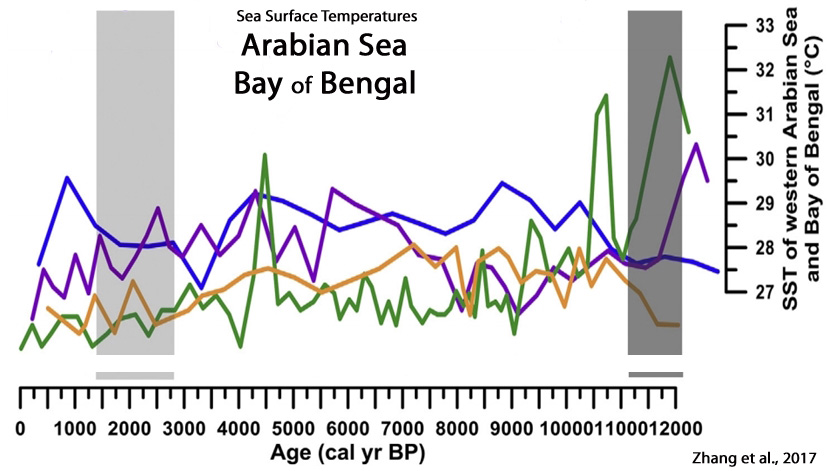
8. Indian Ocean
Gong et al., 2017, Zhang et al., 2017
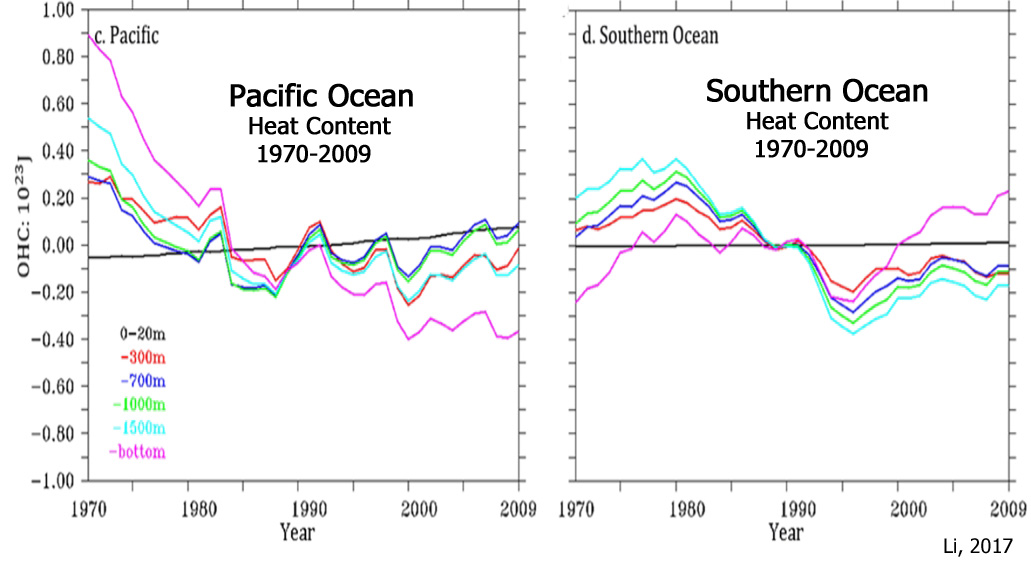
9. South Pacific/Southern Ocean
Li, 2017 , Markle et al., 2017, Turney et al., 2017
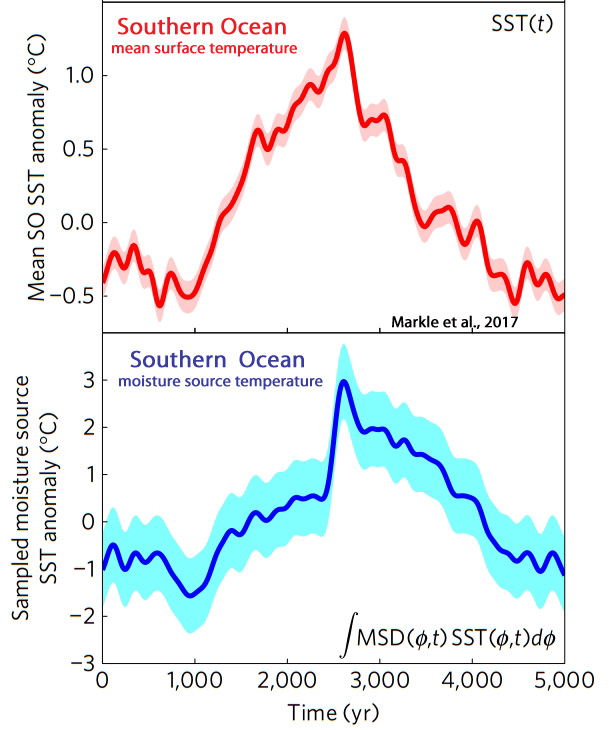
“Occupying about 14% of the world’s surface, the Southern Ocean plays a fundamental role in ocean and atmosphere circulation, carbon cycling and Antarctic ice-sheet dynamics. … a cooling trend since 1979.”
Latif et al., 2017 “The Southern Ocean featured some remarkable changes during the recent decades. For example, large parts of the Southern Ocean, despite rapidly rising atmospheric greenhouse gas concentrations, depicted a surface cooling since the 1970s…”
Kusahara et al., 2017 “Concomitant with this positive trend in Antarctic sea ice, sea surface temperatures (SSTs) over the Southern Ocean south of approximately 45°S have cooled over this period [since 1979].”
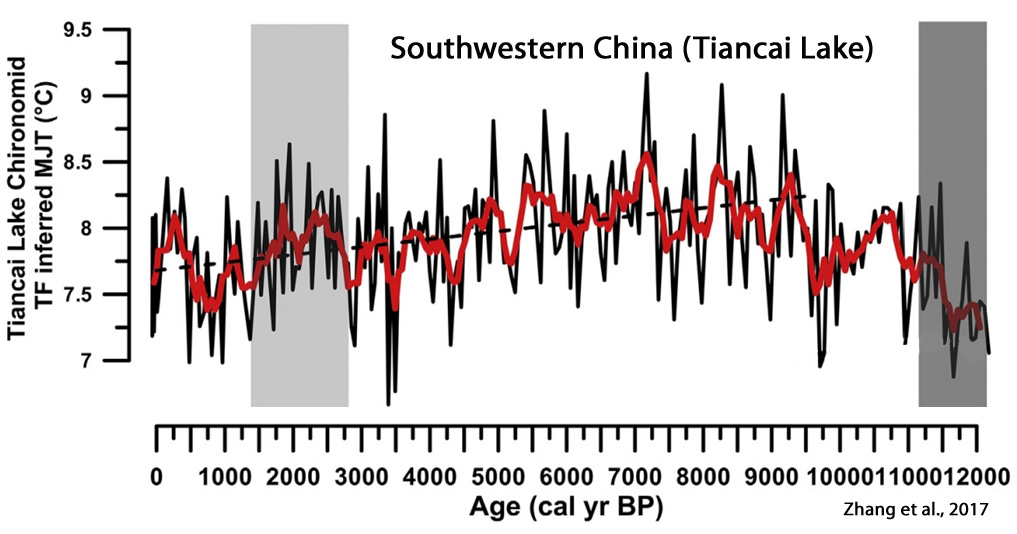
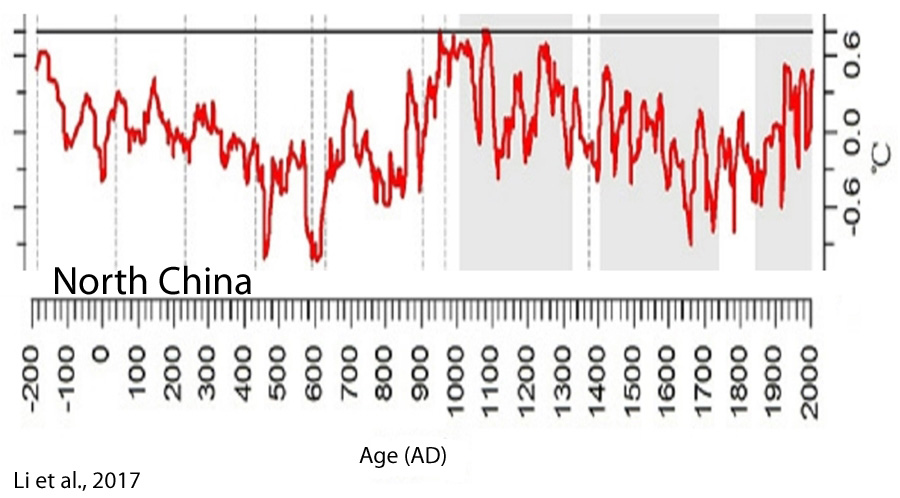
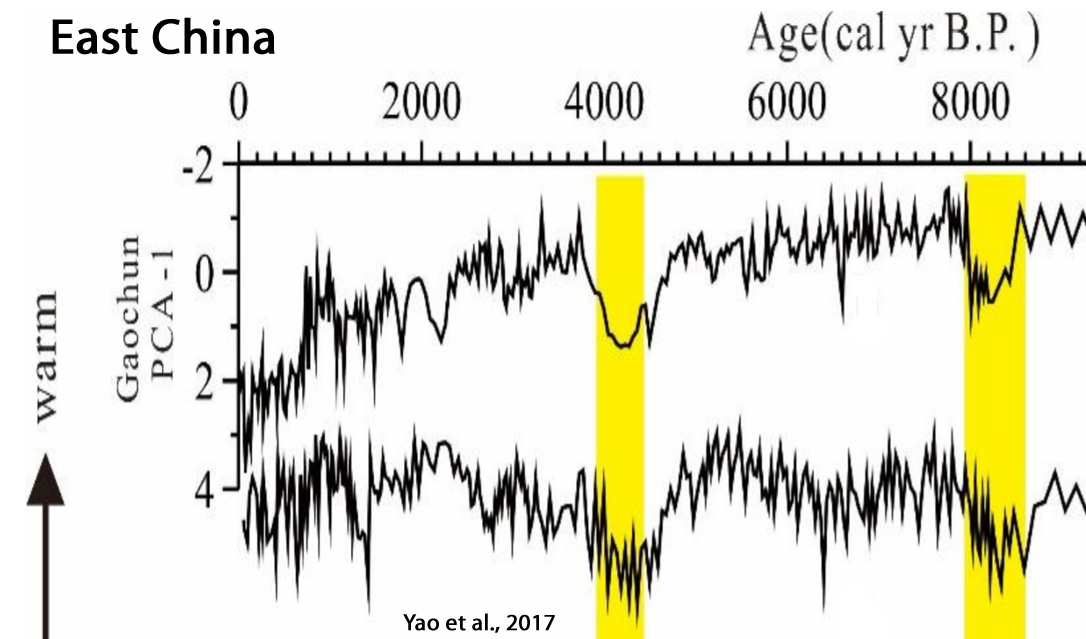
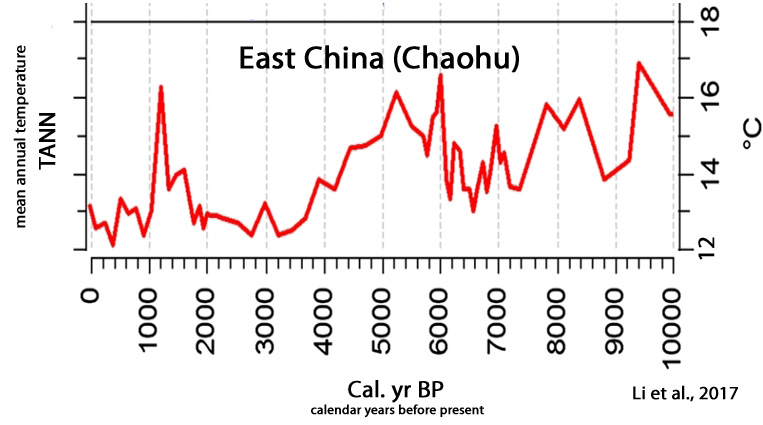
10. China
Wang et al., 2017, Zhang et al., 2017, Ge et al., 2017, Li et al., 2017, Li et al., 2017, Zheng et al., 2017, Yao et al., 2017, Li et al., 2017
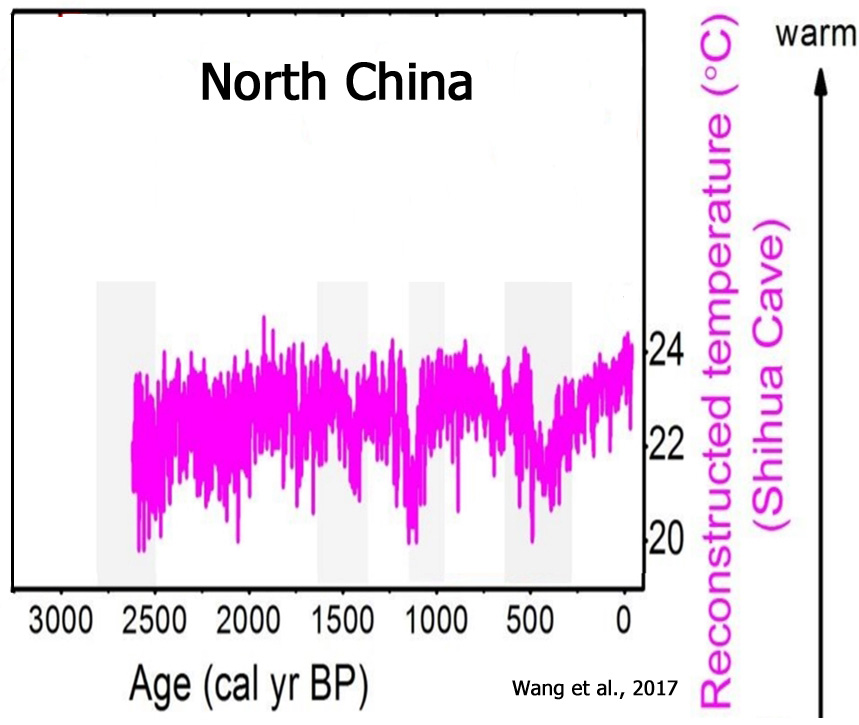
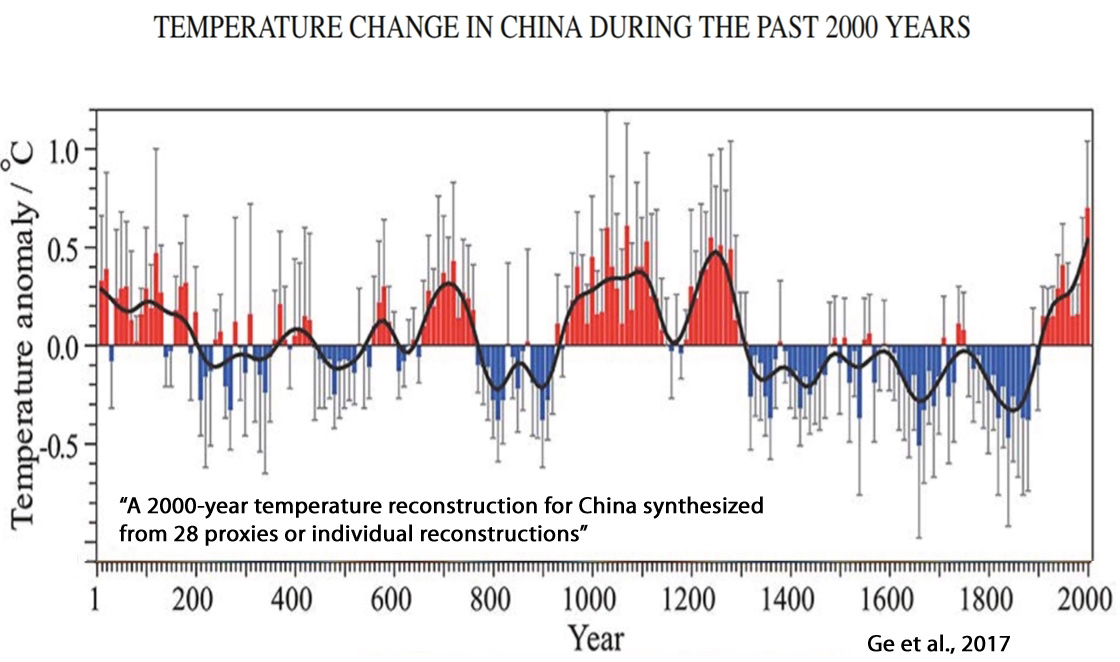

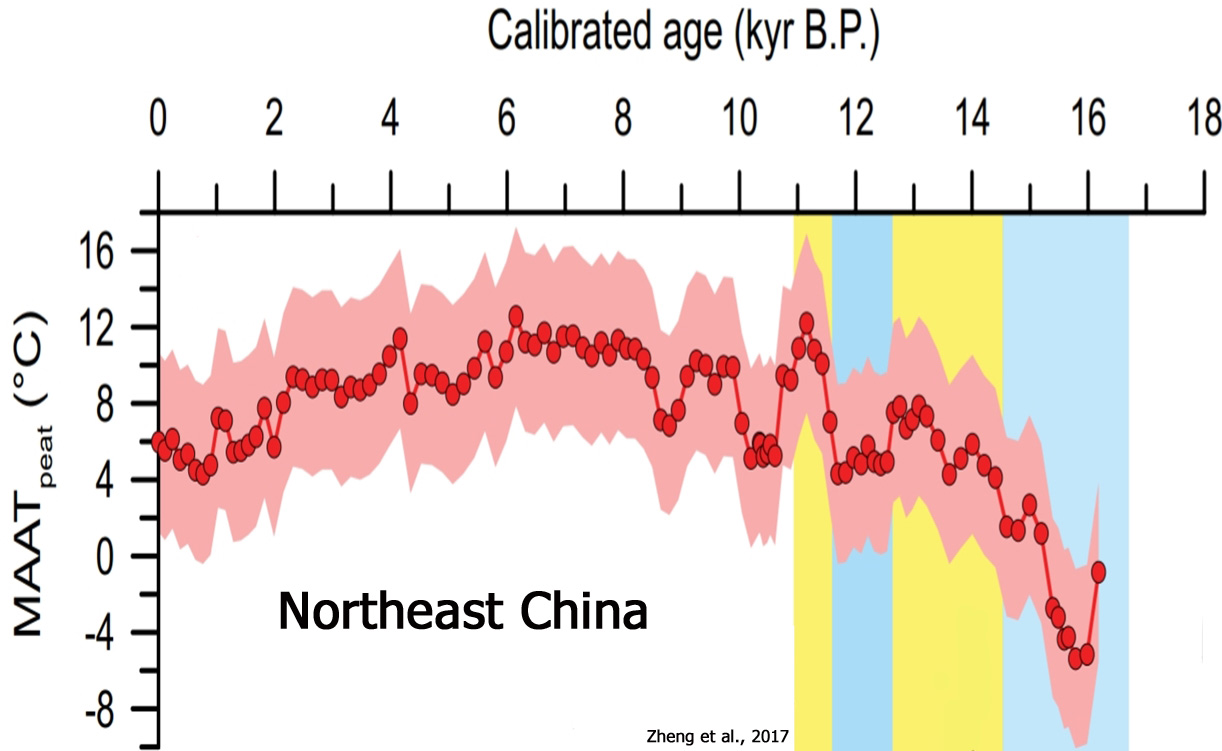
Hu et al., 2017 “According to the pollen records in the HRYR [Headwater Region of the Yellow River], the climate in the Holocene thermal maximum was warmer and wetter than present (temperature was 2 -3 °C higher than present)“
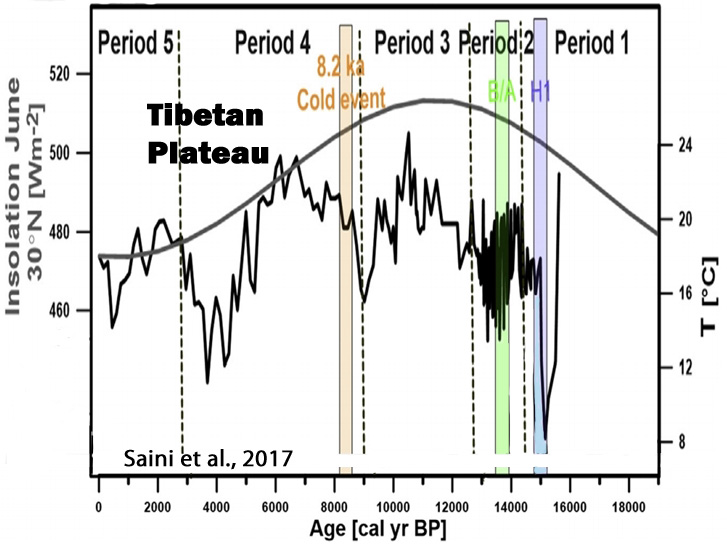
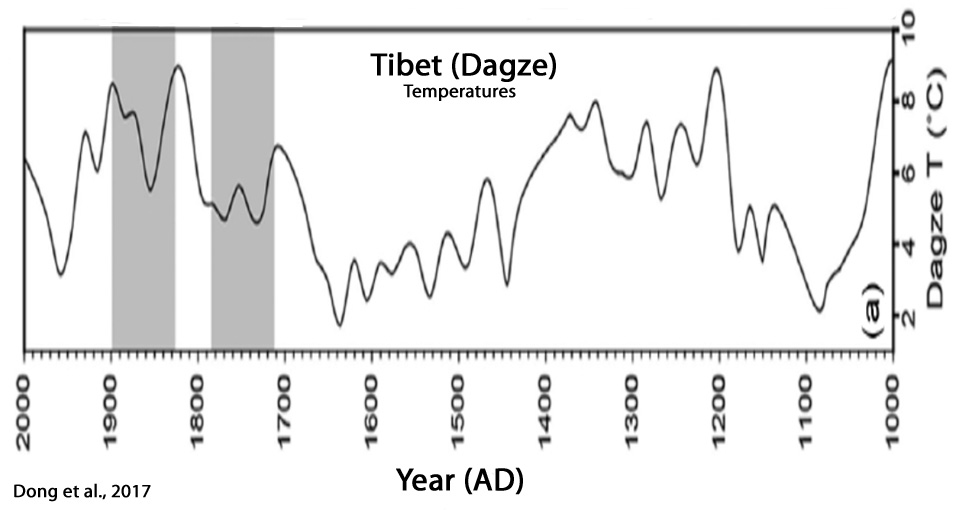
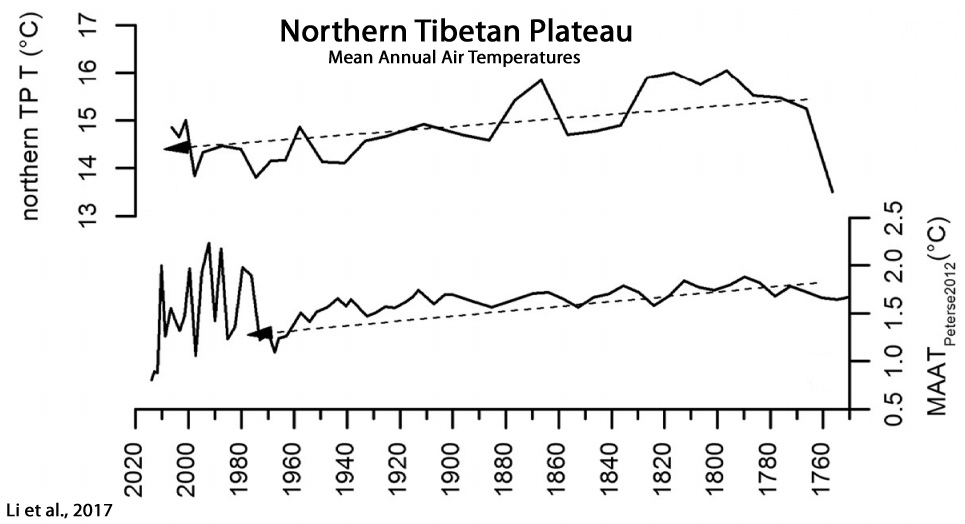
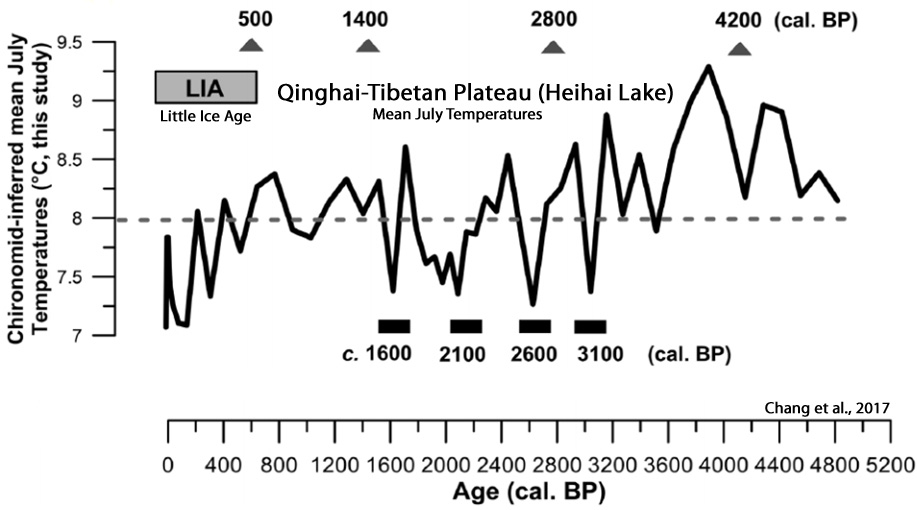
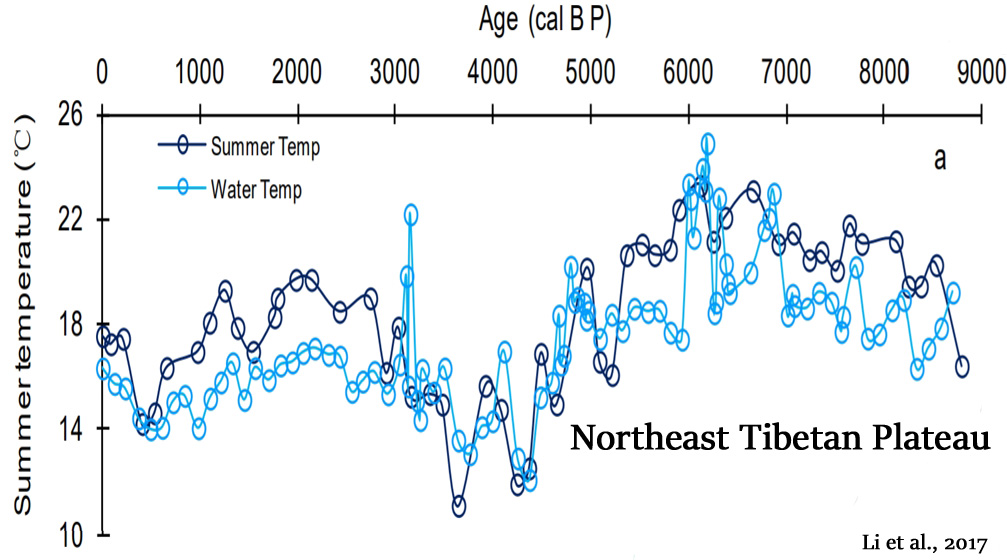
11. Tibetan Plateau
Saini et al., 2017, Sun et al., 2017, Dong et al., 2017, Li et al., 2017, Chang et al., 2017, Li et al., 2017
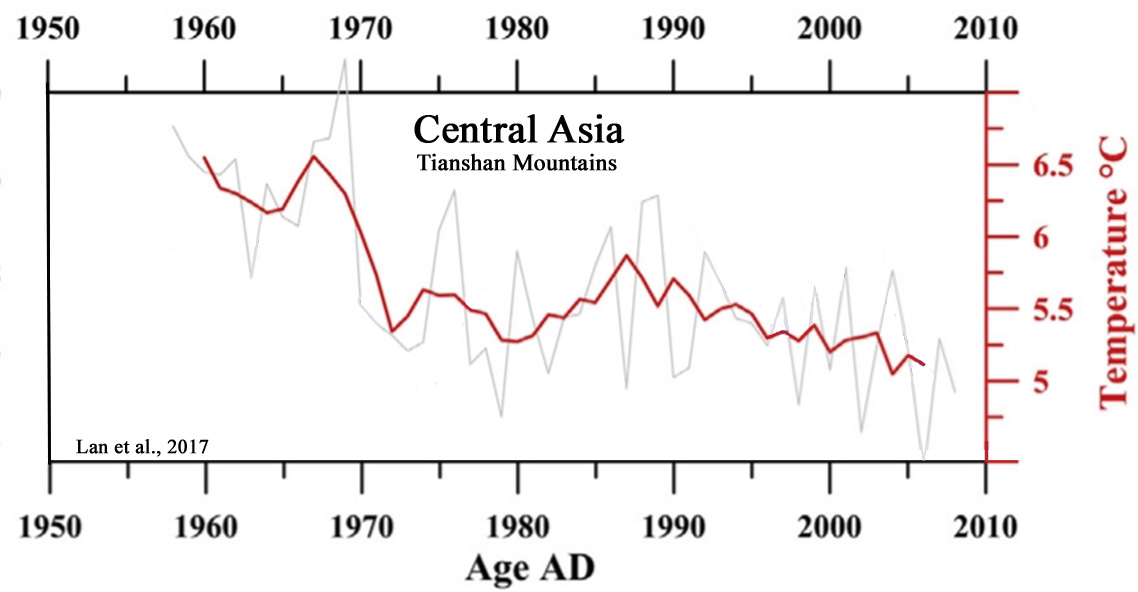
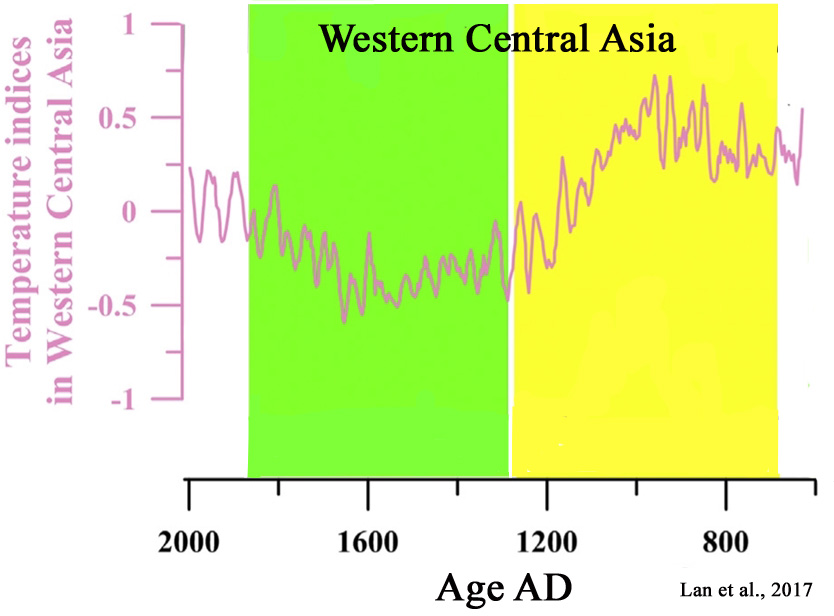
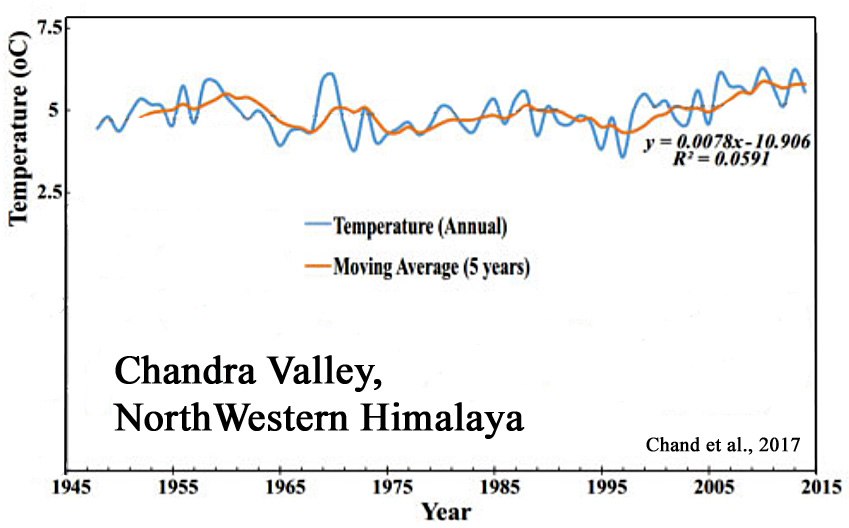
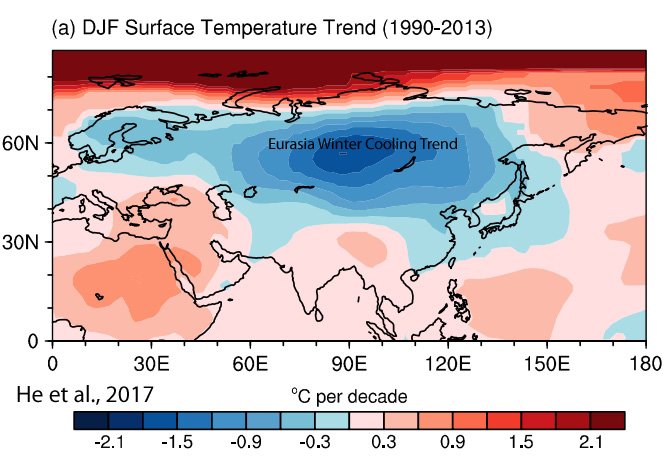
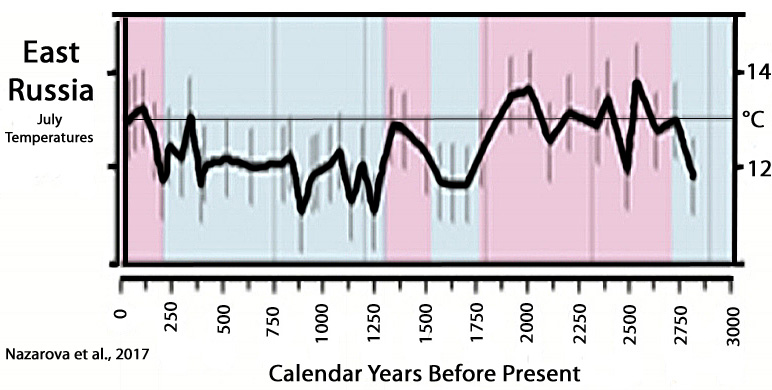
12. Central Asia
Lan et al., 2017, Chand et al., 2017, He et al., 2017, Nazarova et al., 2017
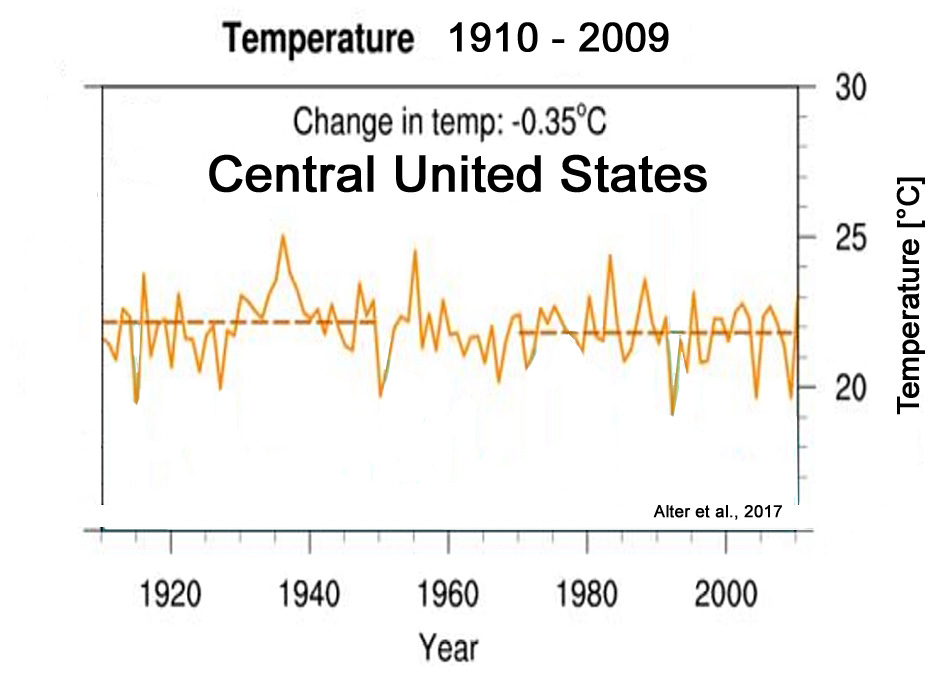
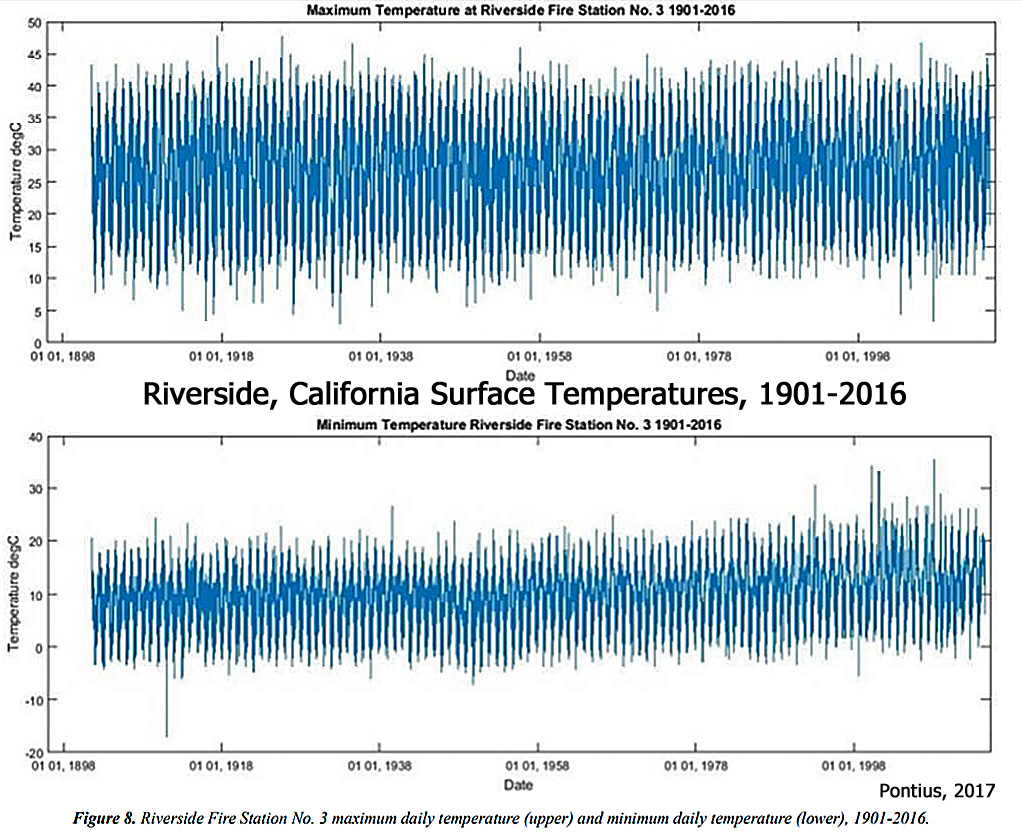
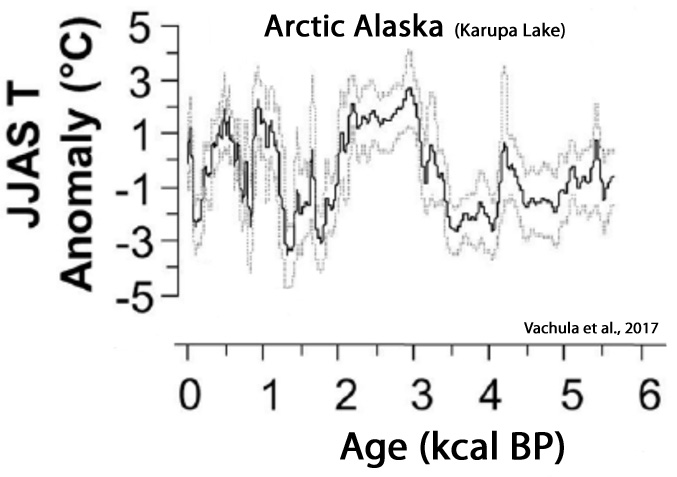
13. United States
Alter et al., 2017, Loisel et al., 2017, Pontius, 2017, Vachula et al., 2017
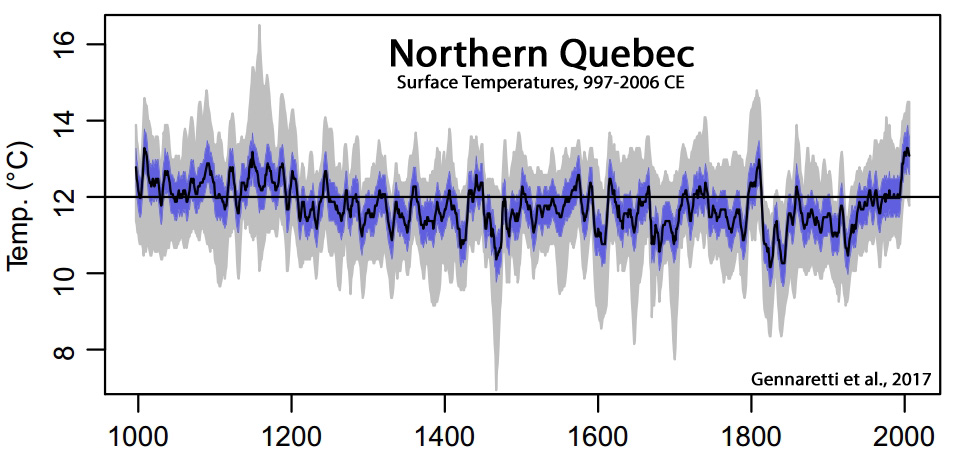
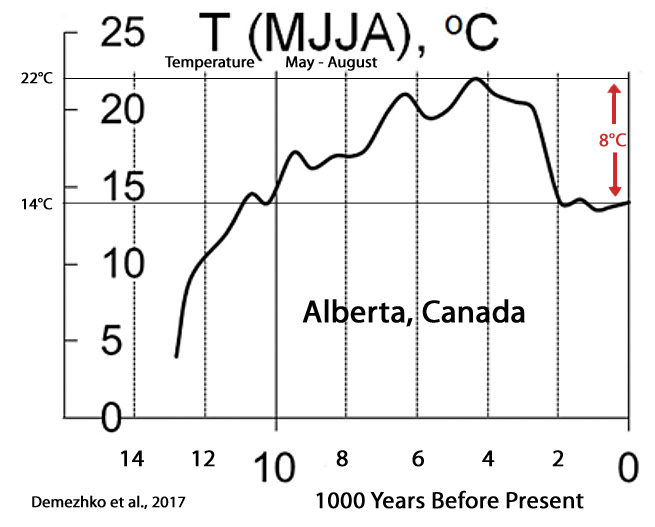
14. Canada
Gennaretti et al., 2017, Demezhko et al., 2017, Bolton and Beaudoin, 2017

Elmslie, 2017 “Pollen-based inferences suggest HTM temperatures were elevated by approximately 2-3°C [above present], and lake levels were regionally lower than today, suggesting warmer and more arid conditions than today. This warming resulted in increased algal production and associated cyanobacteria blooms in lakes in northwestern Ontario. In northeastern Ontario, climate projections suggest the HTM was 2-3°C warmer.”
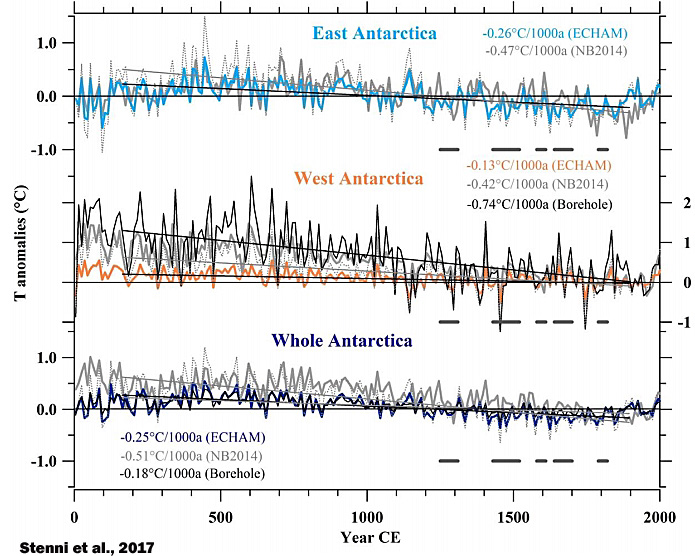
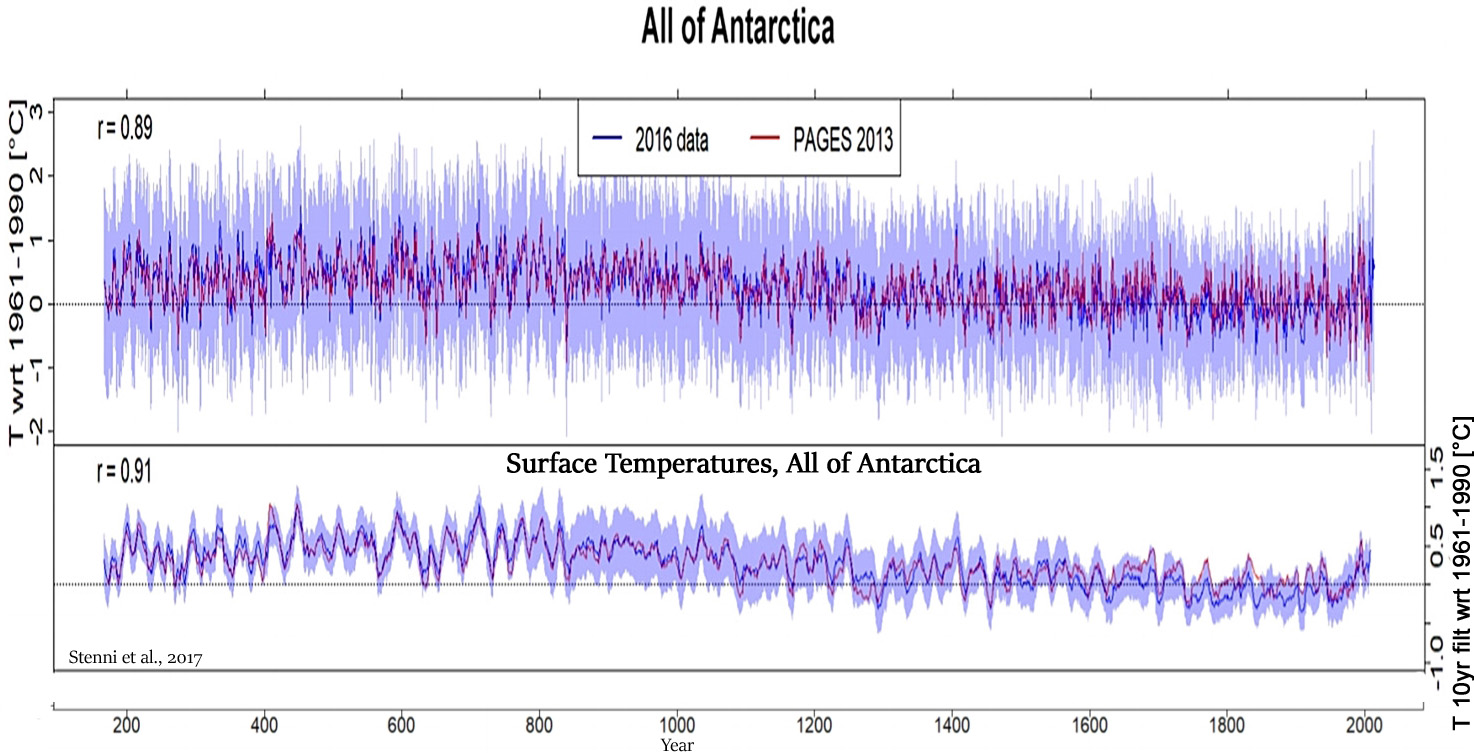
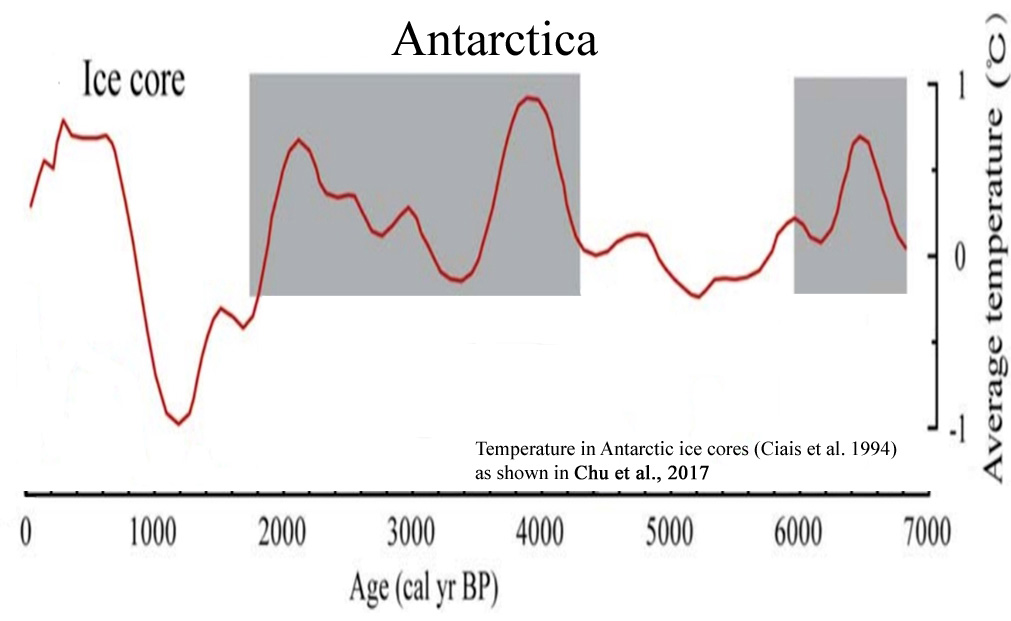
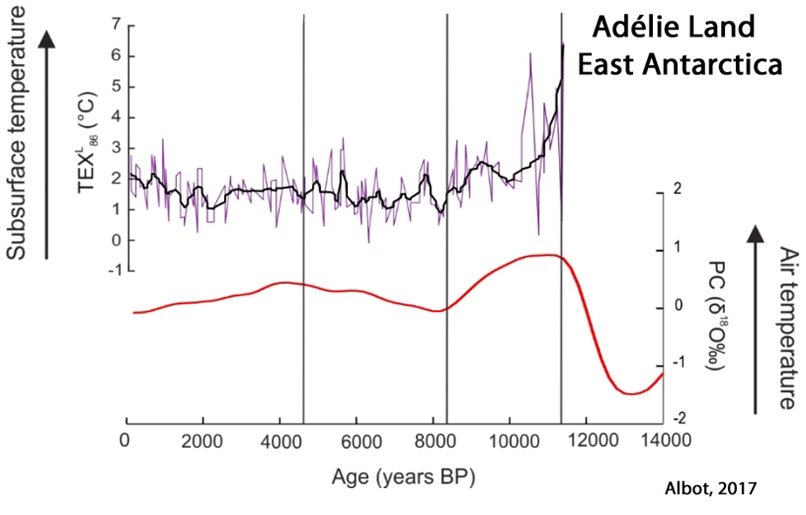
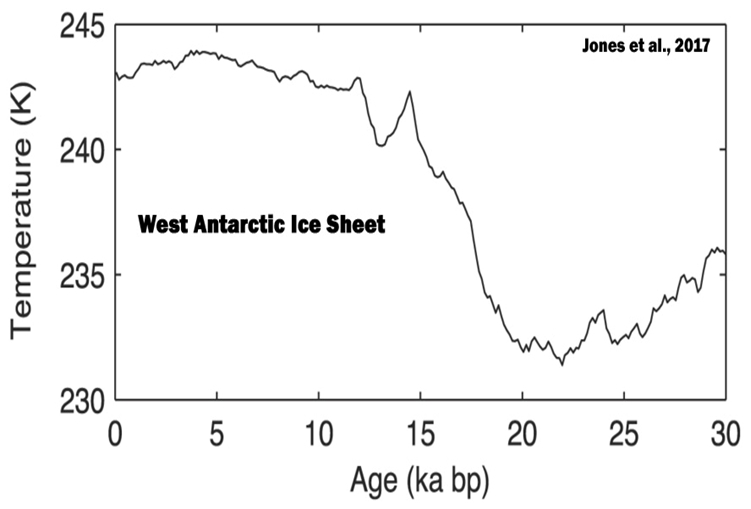
15. Antarctica
Mayewski et al., 2017, Stenni et al., 2017, Chu et al., 2017, Albot, 2017, Jones et al., 2017
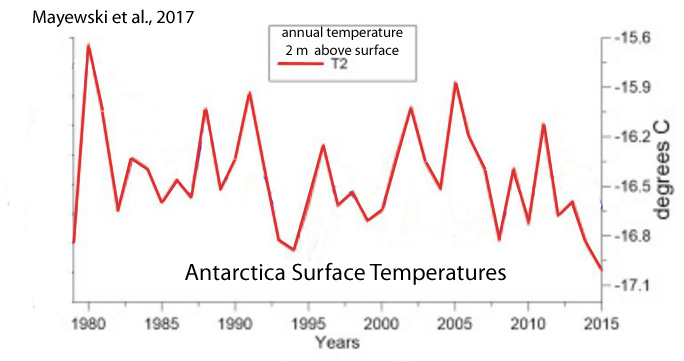
Oliva et al., 2017 (West Antarctic Peninsula) “However, a recent analysis (Turner et al., 2016) has shown that the regionally stacked temperature record for the last three decades has shifted from a warming trend of 0.32 °C/decade during 1979–1997 to a cooling trend of − 0.47 °C/decade during 1999–2014. … This recent cooling has already impacted the cryosphere in the northern AP [Antarctic Peninsula], including slow-down of glacier recession, a shift to surface mass gains of the peripheral glacier and layer of permafrost in northern AP islands.”
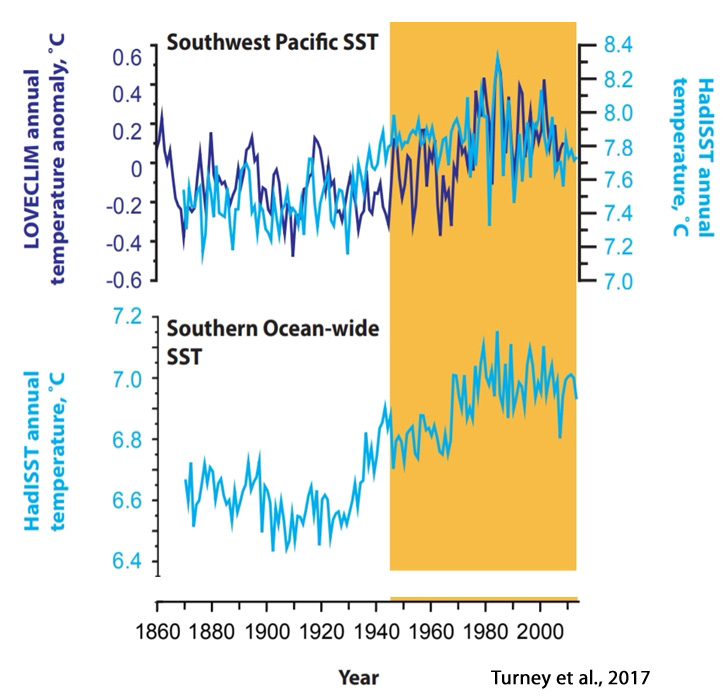
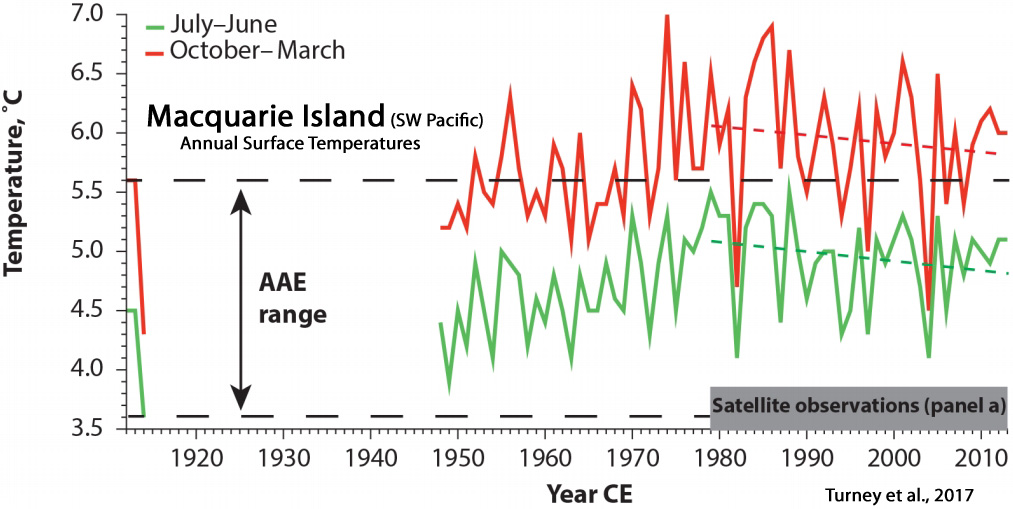
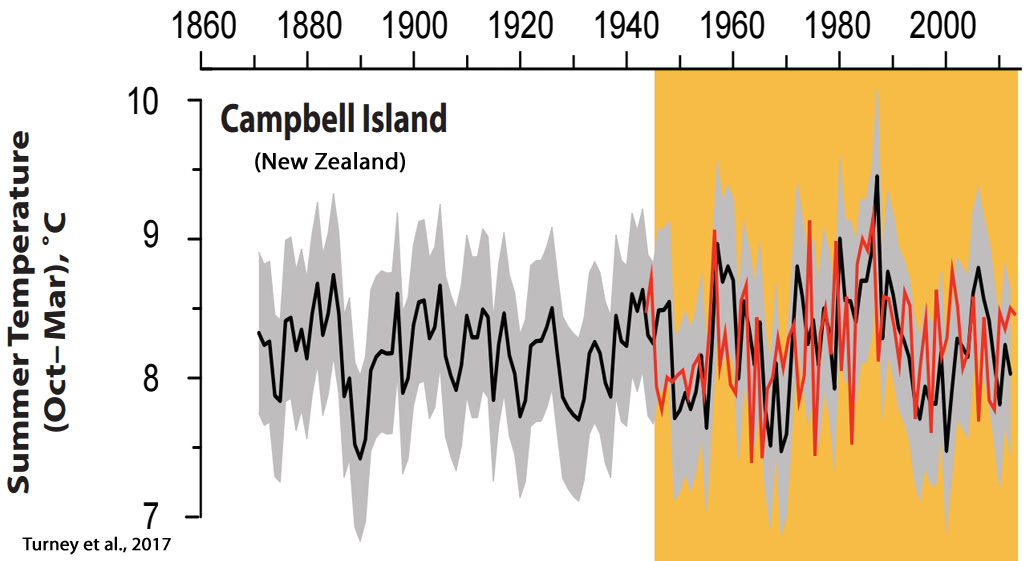
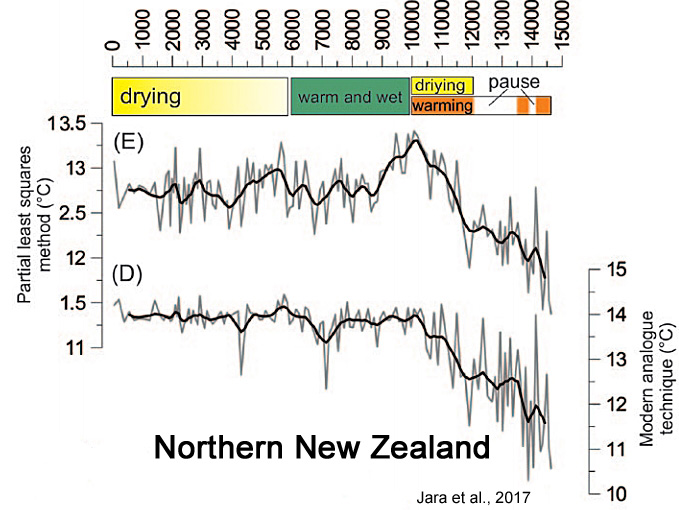
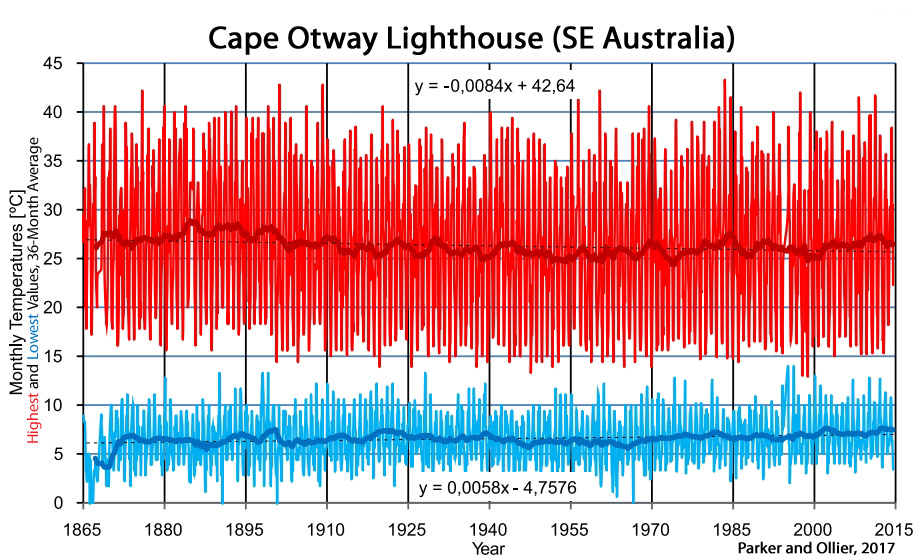
16. Australia/New Zealand
Turney et al., 2017, Jara et al., 2017, Parker and Ollier, 2017

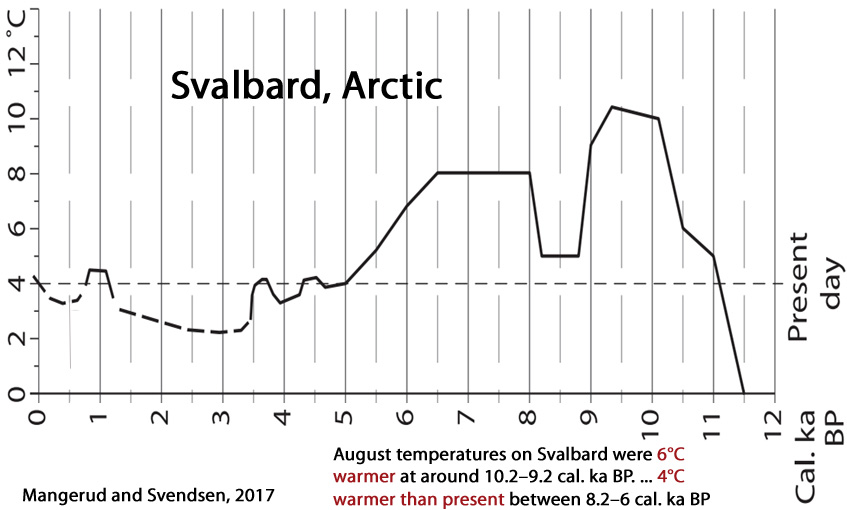
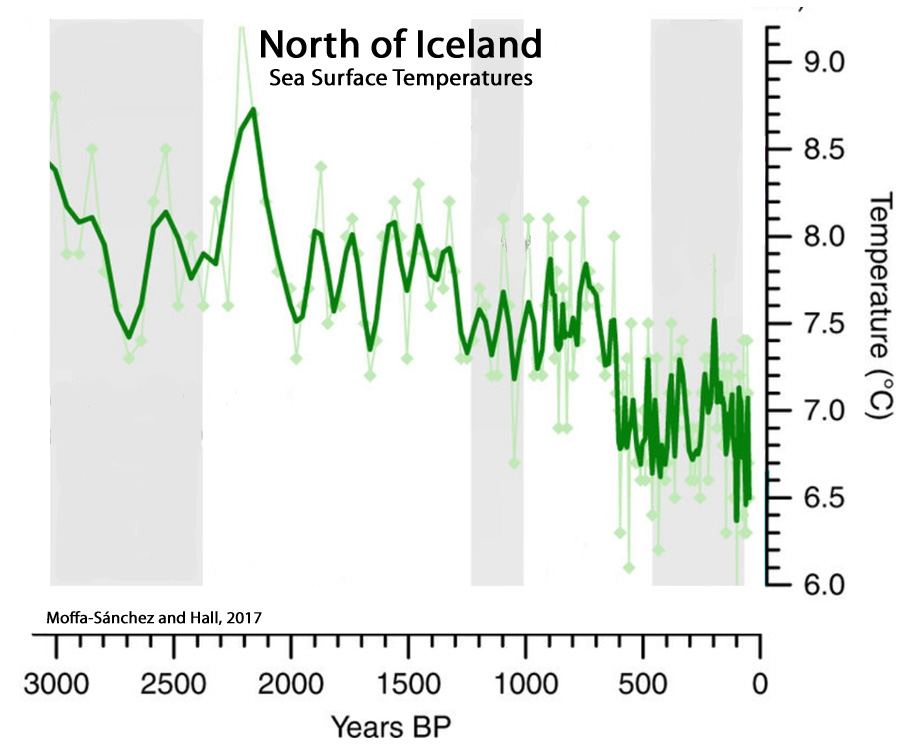
17. Arctic
Mangerud and Svendsen, 2017, Fernández-Fernández et al., 2017, Werner et al., 2017, Moffa-Sánchez and Hall, 2017


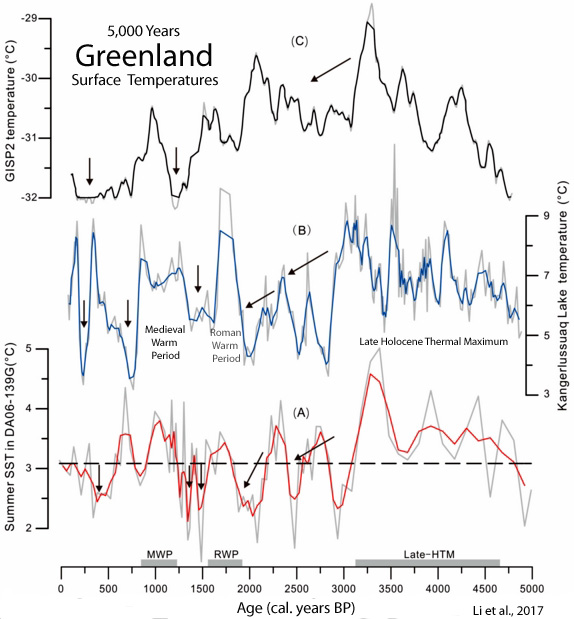
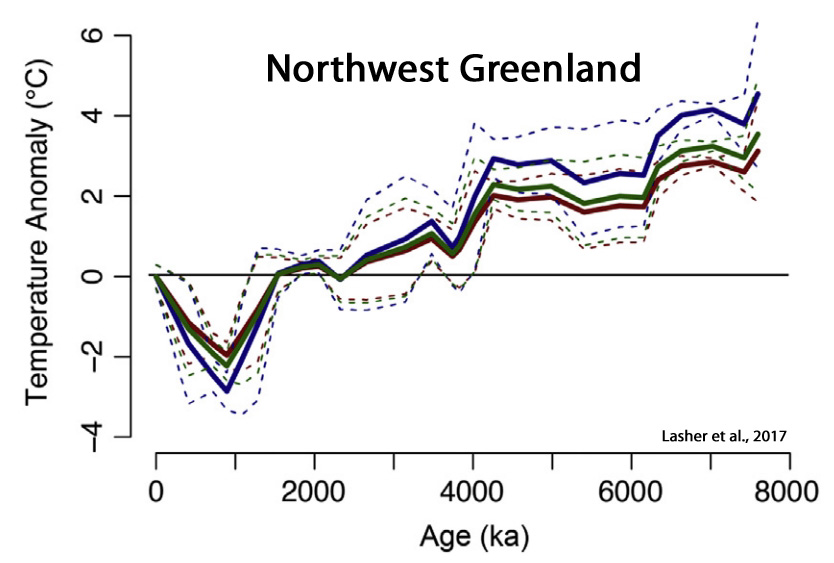
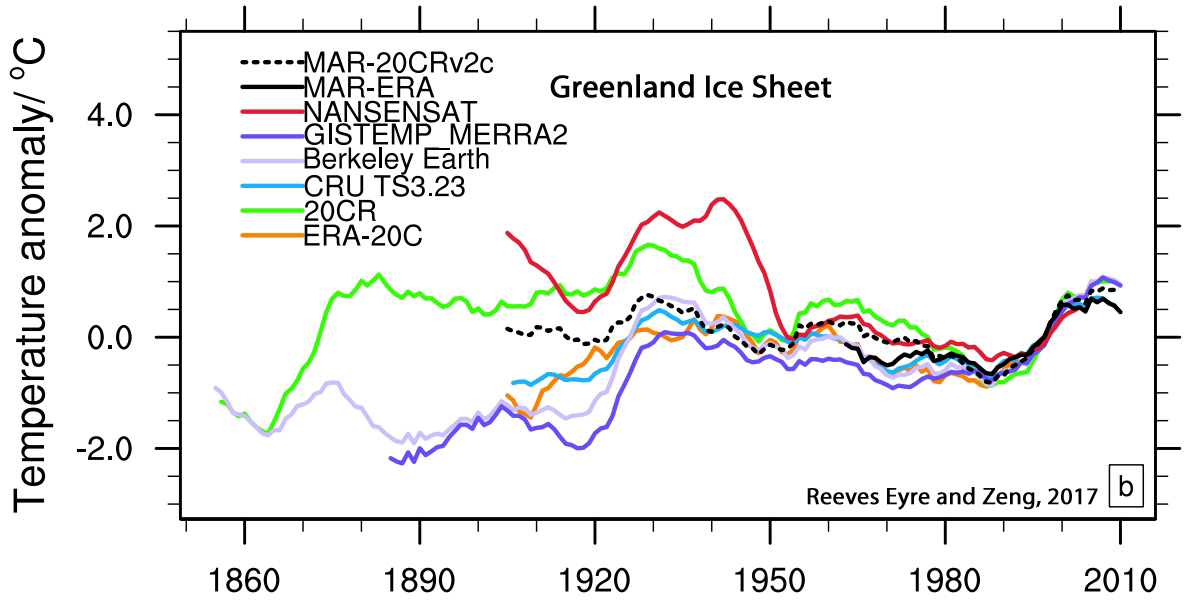
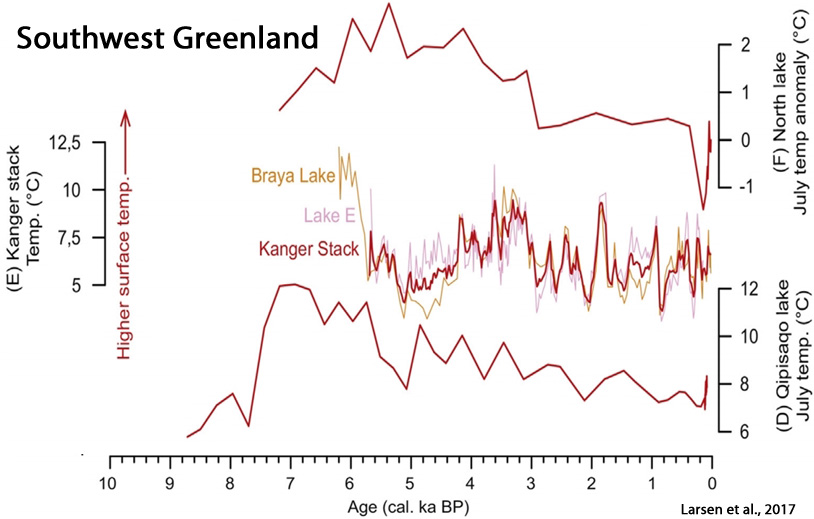
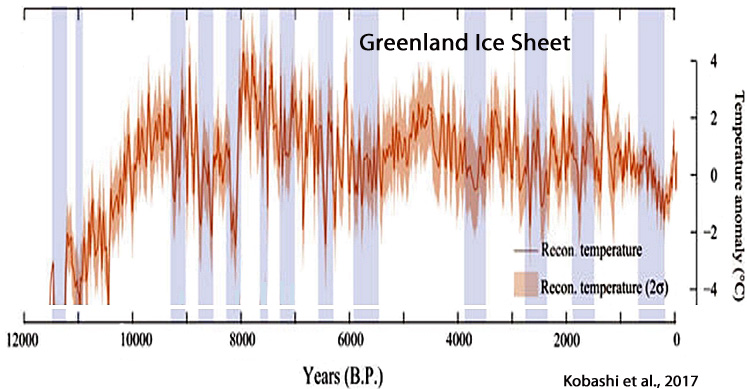
18. Greenland
Li et al., 2017, Lasher et al., 2017, Reeves Eyre and Zeng, 2017, Larsen et al., 2017, Kobashi et al., 2017
Lusas et al., 2017 (East Greenland) “The lack of glacio-lacustrine sediments throughout most of the record suggests that the ice cap was similar to or smaller than present throughout most of the Holocene. … Air temperatures in Milne Land, west of our study area, based on preliminary estimates from chironomids, may have been 3–6°C warmer than at present (Axford et al. 2013).”
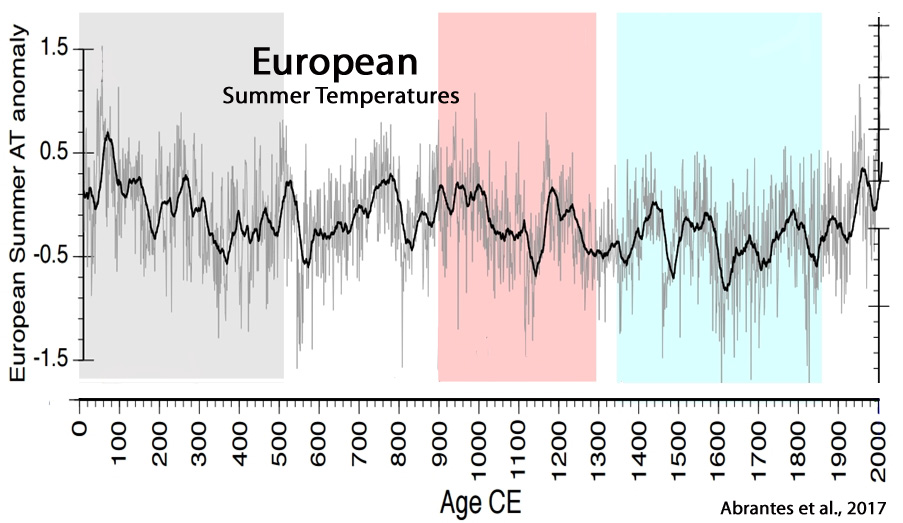
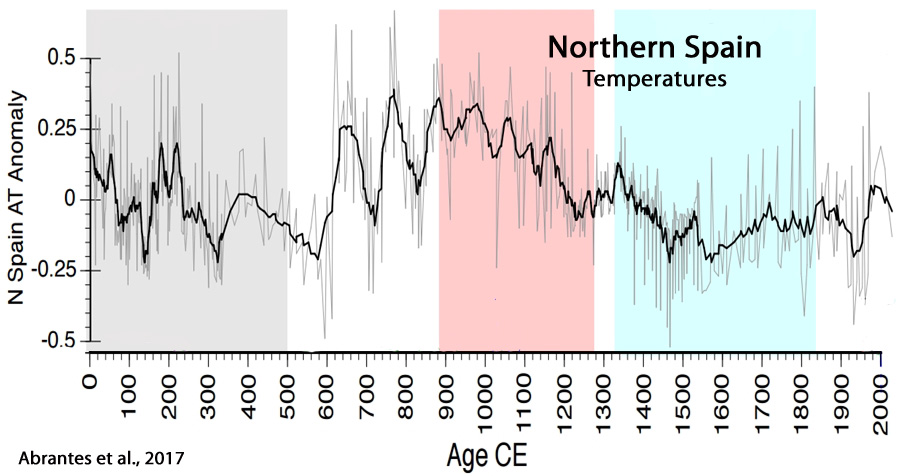
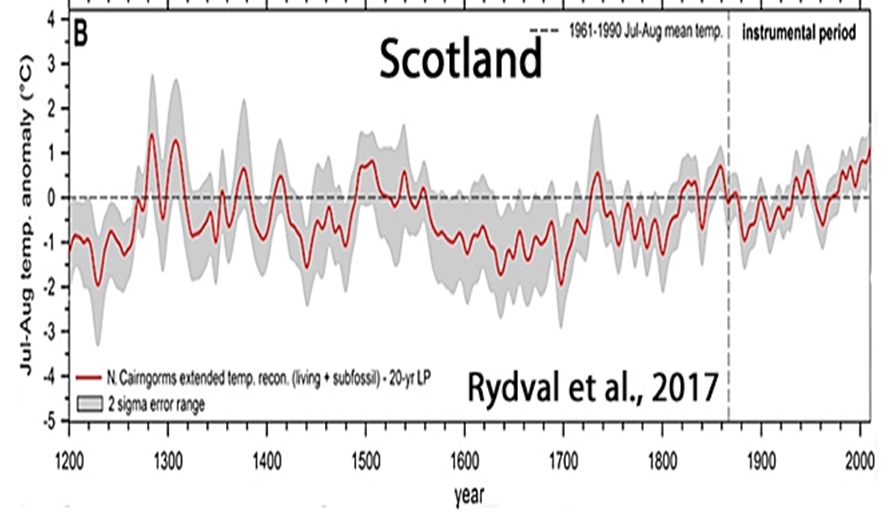
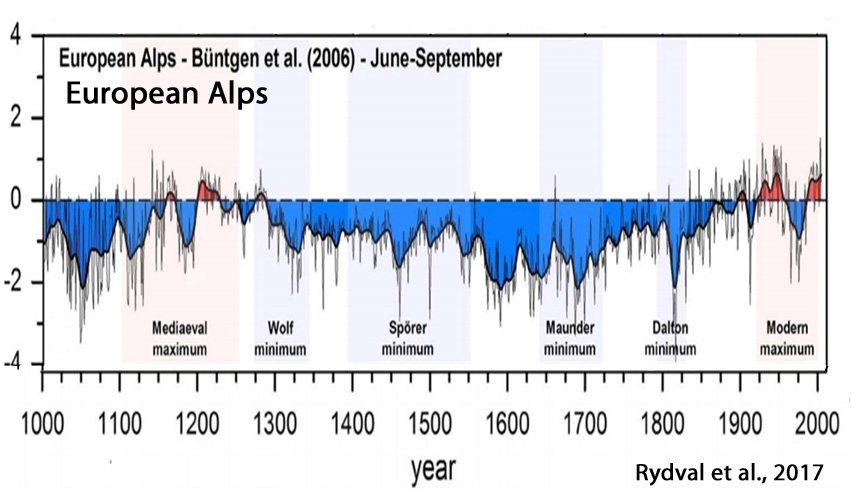
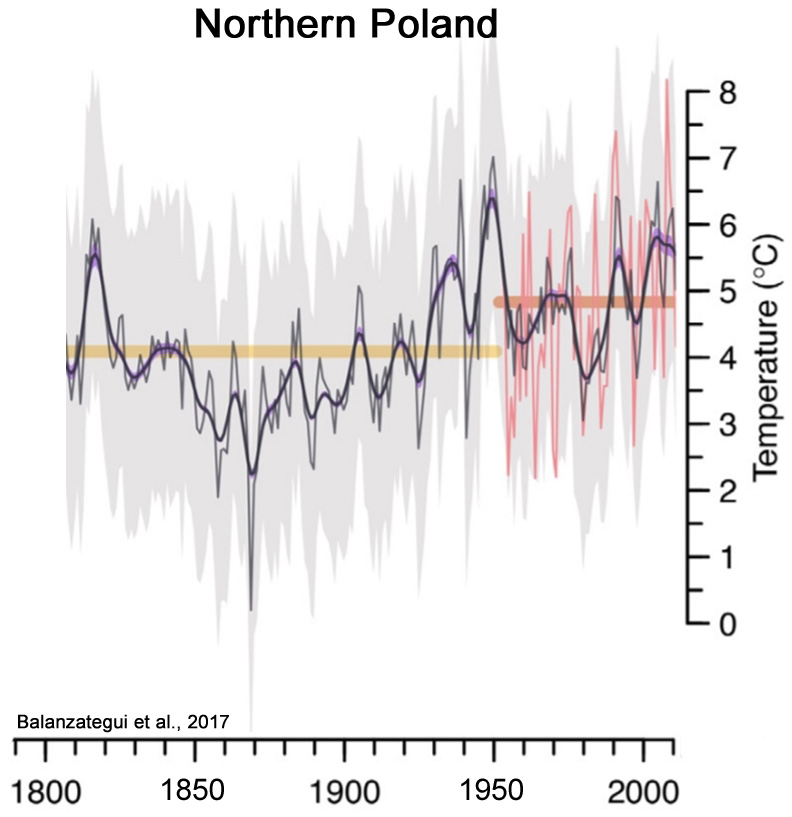
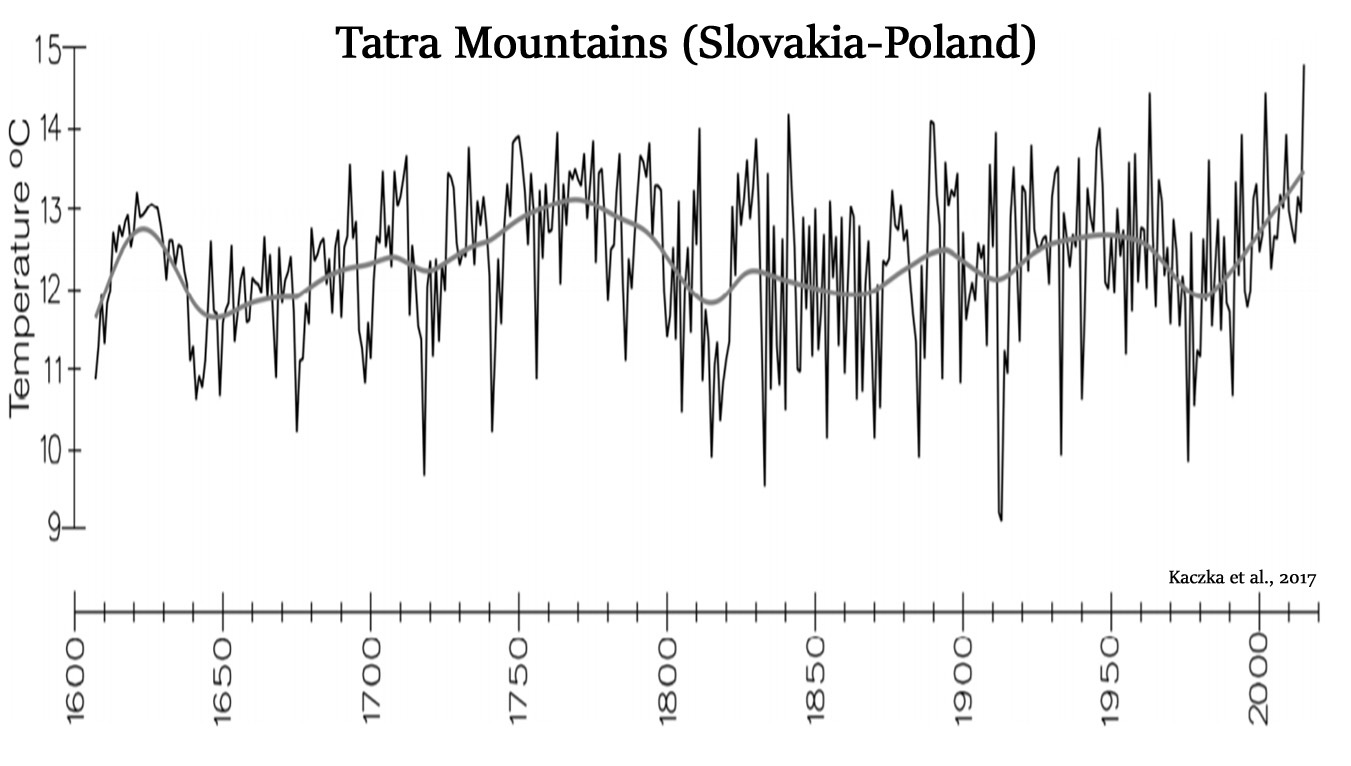
19. Europe
Perșoiu et al., 2017, Abrantes et al., 2017 , Tejedor et al., 2017, Rydval et al., 2017, Balanzategui et al., 2017, Kaczka et al., 2017, Simon et al., 2017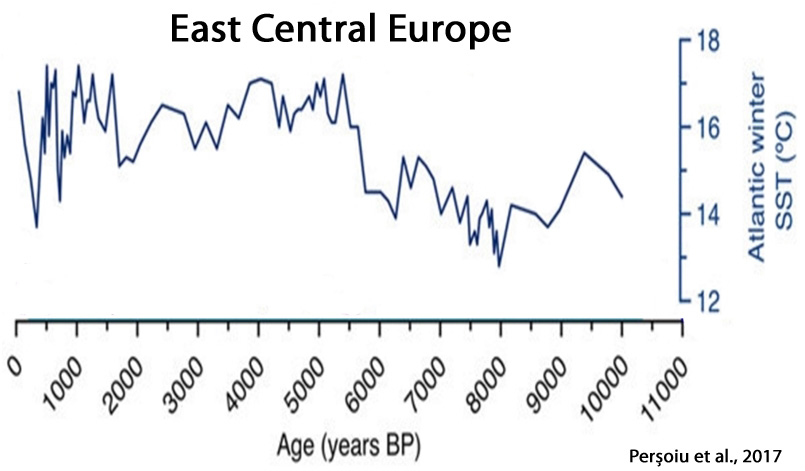

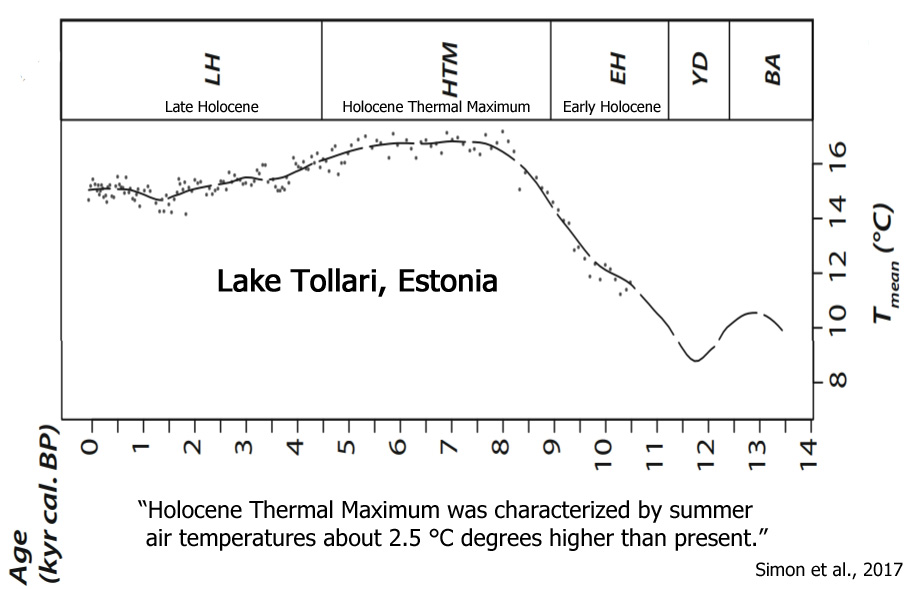
Stivrins et al., 2017 (Latvia) “[A] thermokarst active phase … began 8500 cal. yr BP and lasted at least until 7400 cal. yr BP. Given that thermokarst arise when the mean summer air temperature gradually increased ca. 2°C beyond the modern day temperature”
Molnár and Végvári, 2017 (SE Central Europe) “Our study provides an estimate for the value of MAT of HTM of Pannon region with an interval of 0.4°C, relying on macroecological considerations. We calculate the temperature of the HTM [Holocene Thermal Maximum] 1.3–1.7°C warmer than the present temperature.”
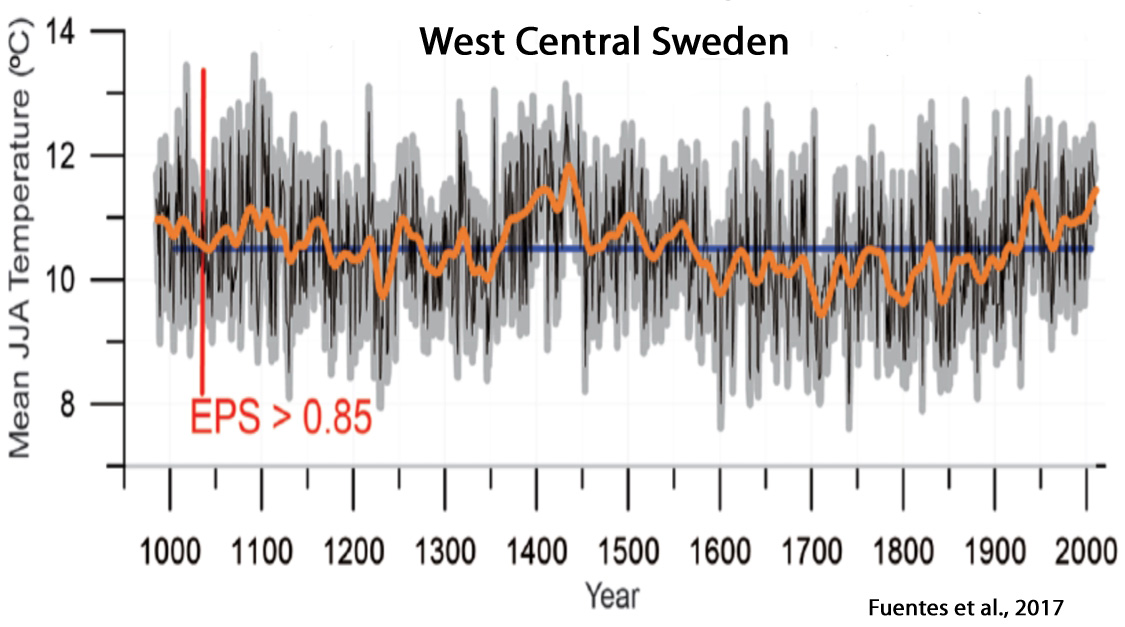
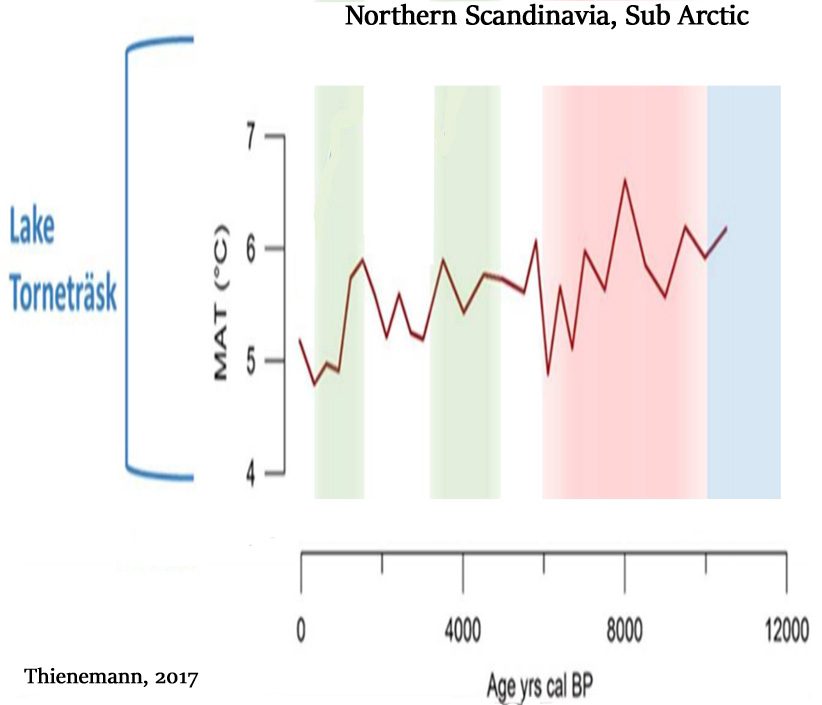
20. Scandinavia
Krossa et al., 2017, Luoto and Nevalainen, 2017, Fuentes et al., 2017, Thienemann, 2017
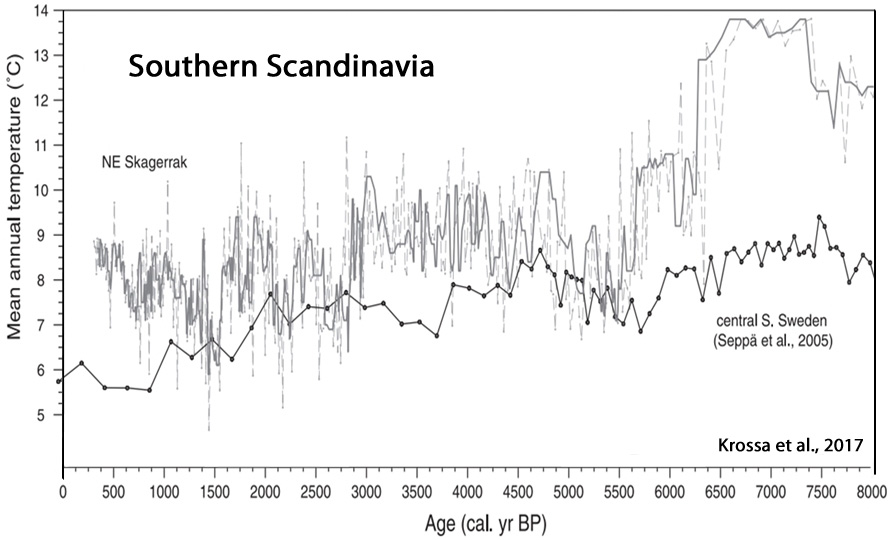

Åkesson et al., 2017 (Norway) “Reconstructions for southern Norway based on pollen and chironomids suggest that summer temperatures were up to 2 °C higher than present in the period between 8000 and 4000 BP, when solar insolation was higher (Nesje and Dahl, 1991; Bjune et al., 2005; Velle et al., 2005a).”
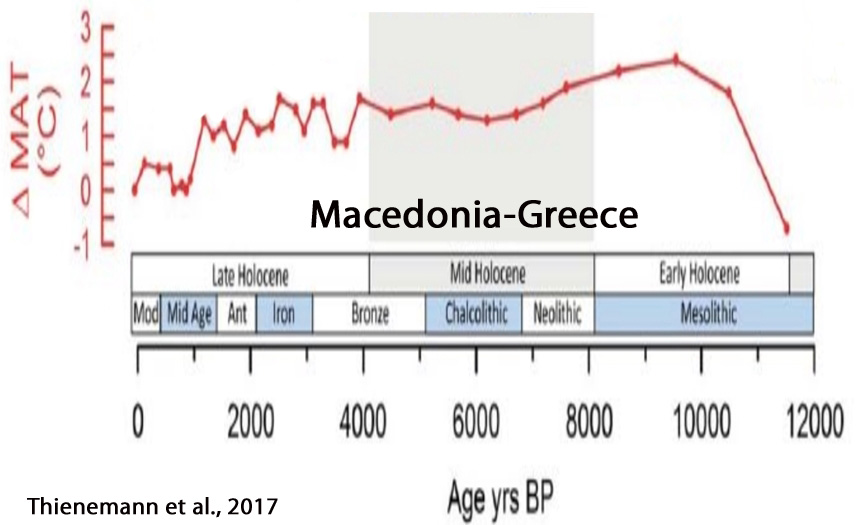
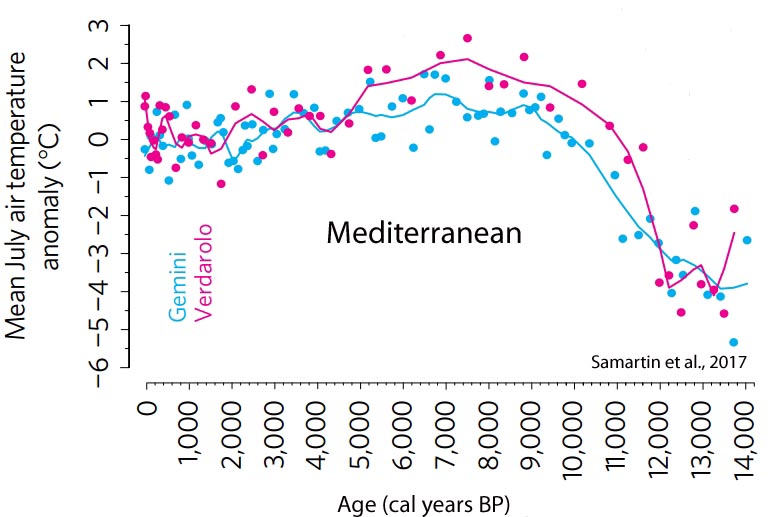
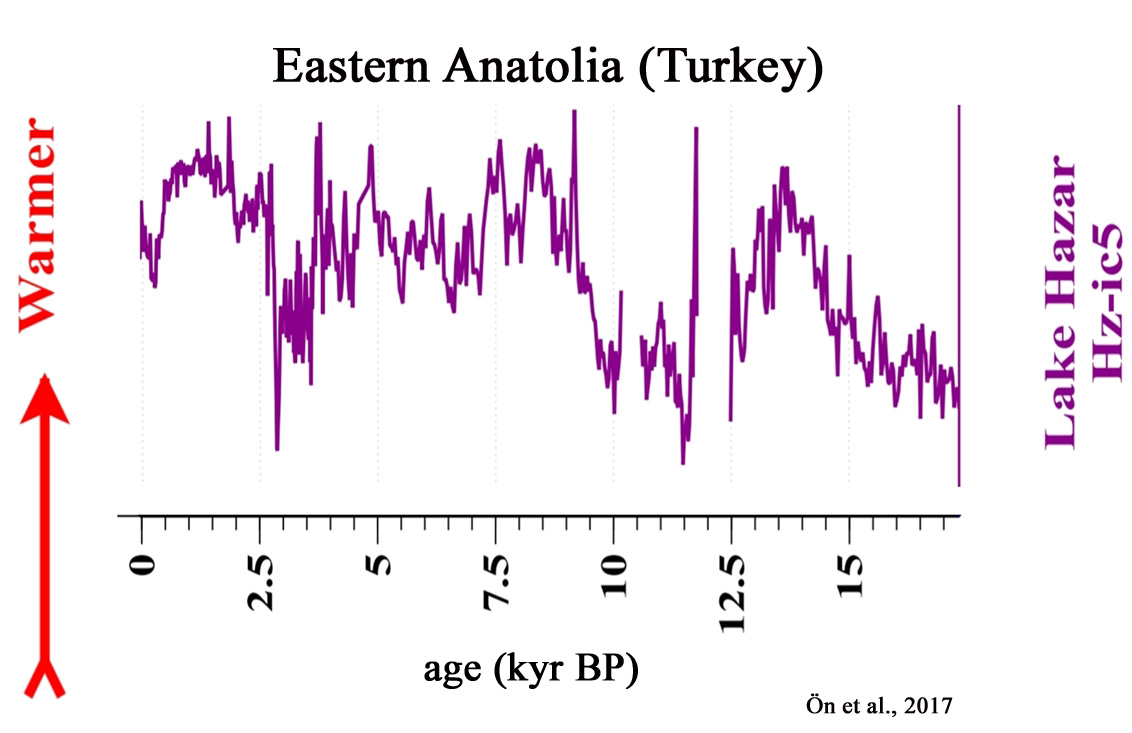
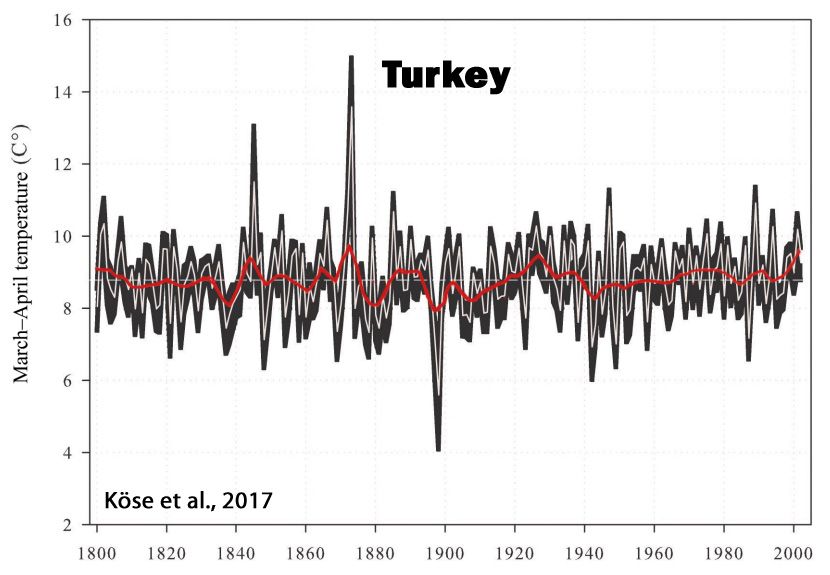
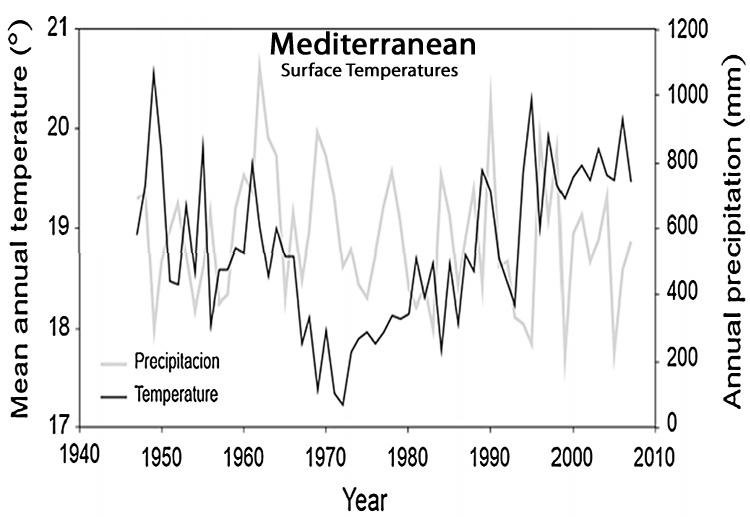
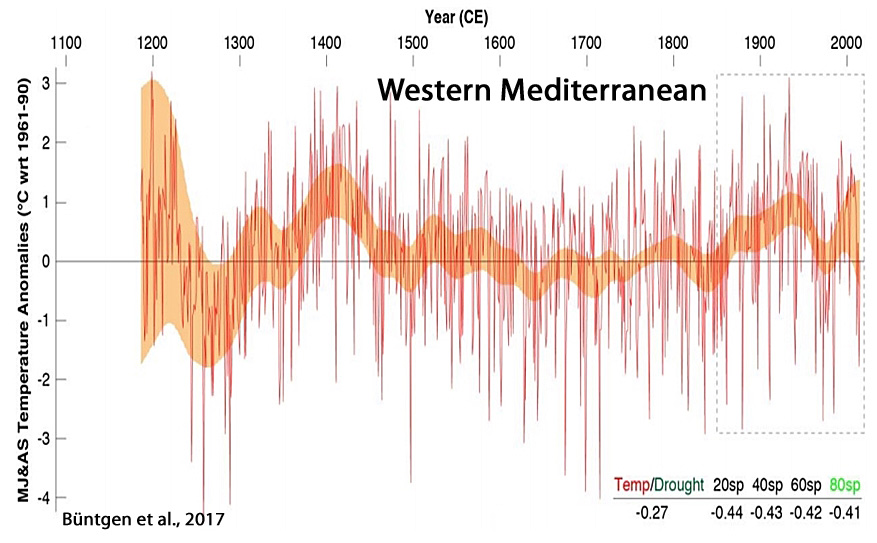
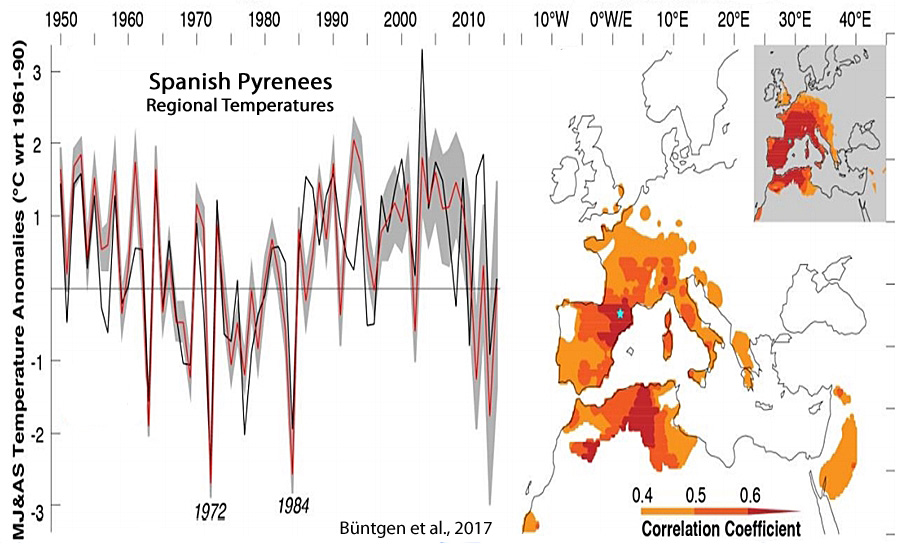
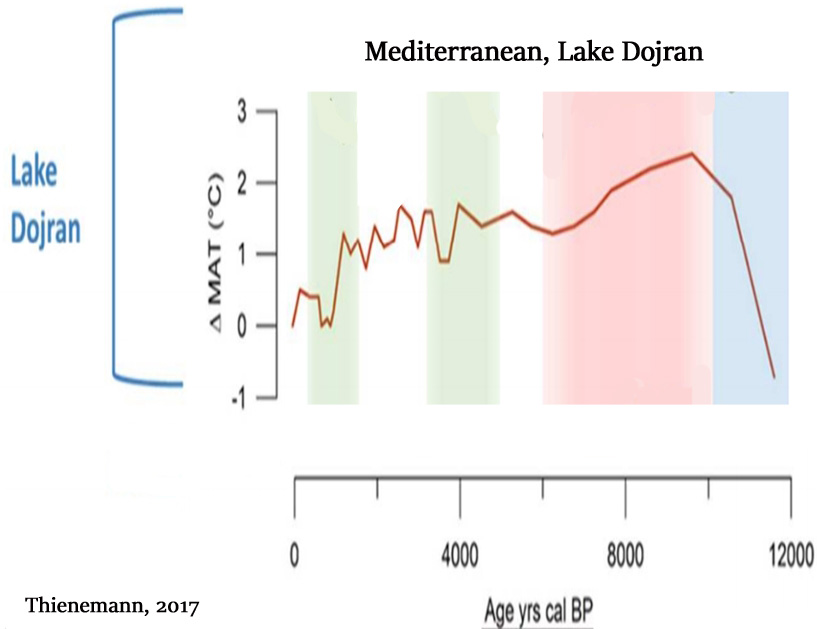
21. Mediterranean
Thienemann et al., 2017, Samartin et al., 2017, Ön et al., 2017, Köse et al., 2017, Zywiec et al., 2017, Büntgen et al., 2017, Thienemann, 2017
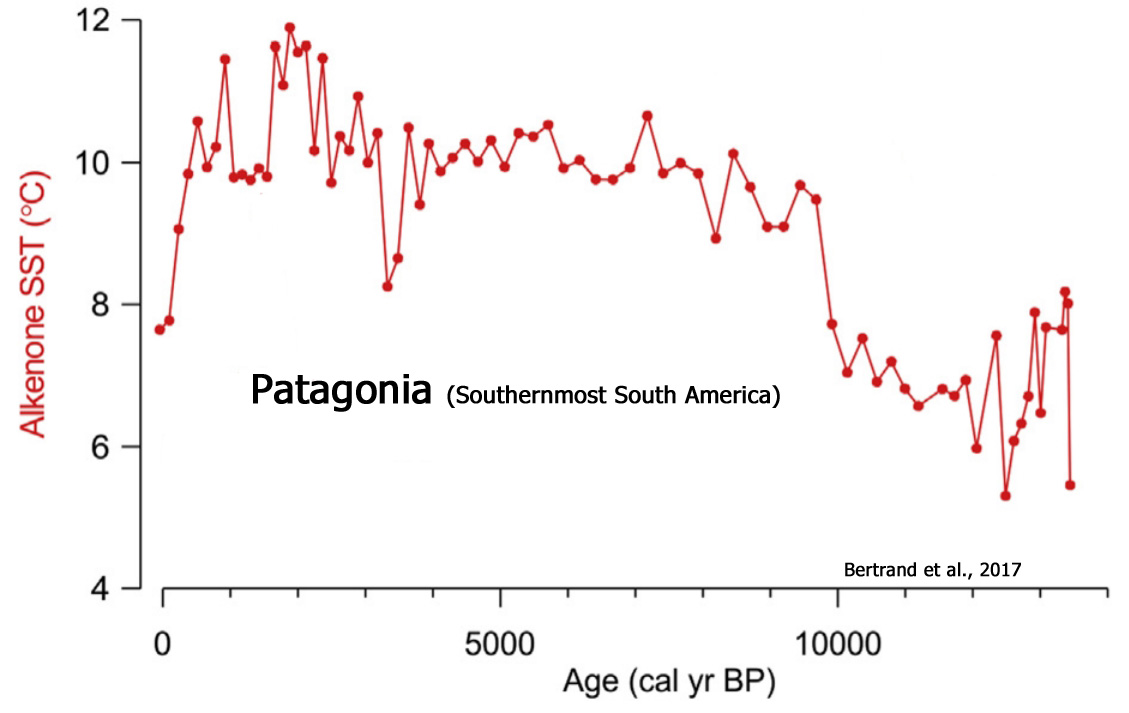
22. South America
Bertrand et al., 2017
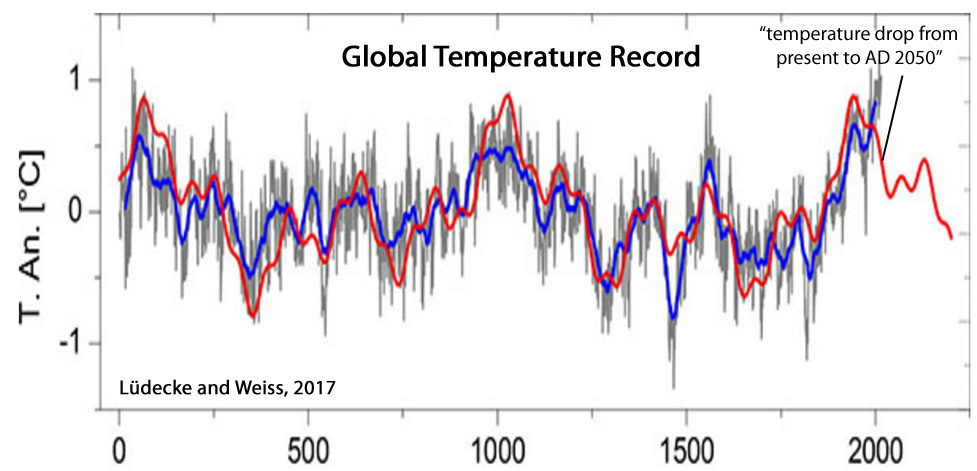
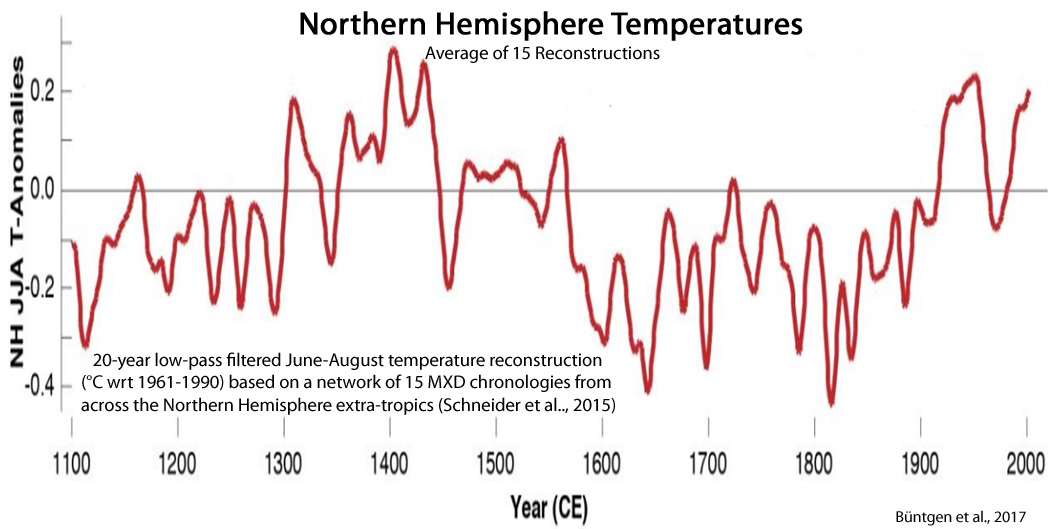
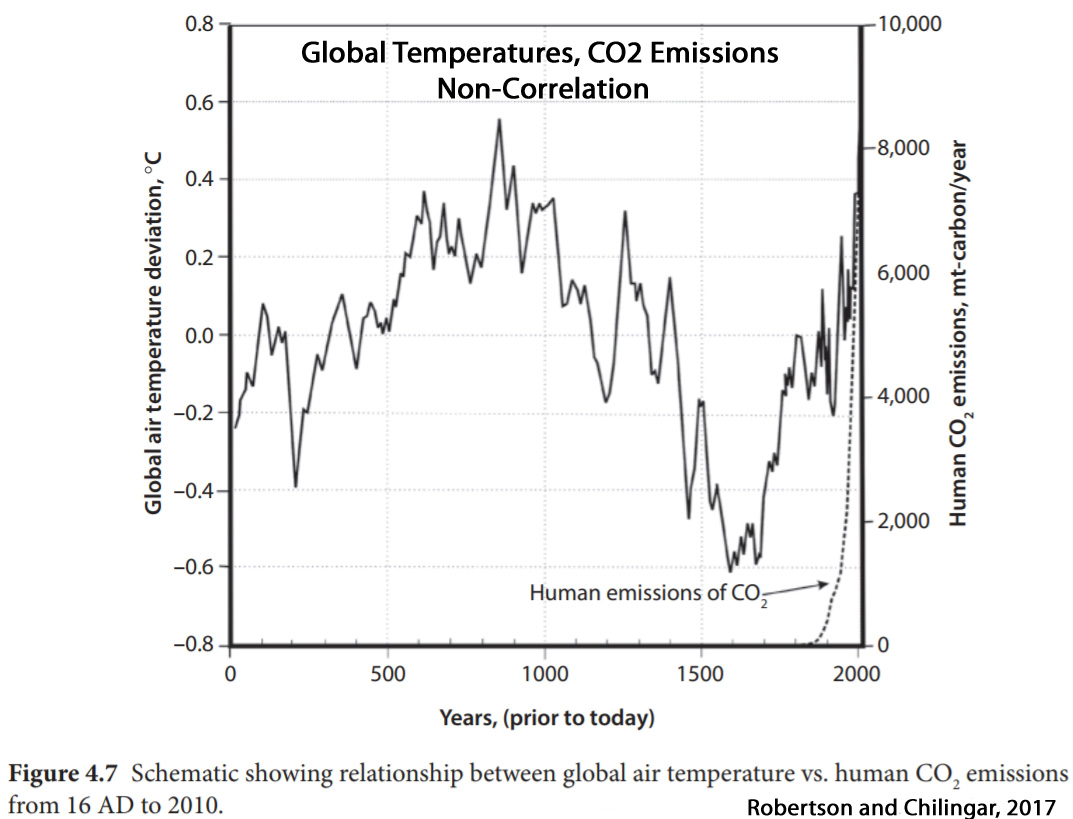
Global/Northern Hemisphere
Lüdecke and Weiss, 2017, Büntgen et al., 2017, Robertson and Chilingar, 2017, Abrantes et al., 2017


Kenneth, another fantastic compilation. I have no idea how you have the time or energy to produce these reports but please keep it up.
I am generally just a reader (lurker) on this site but I always enjoy your posts. I am sure there are many hundreds just like me enjoying your contributions while doing our best to ignore the ramblings of trolls like Seb…….
Happy New Year to you and yours.
Thank you for the affirming comments.
Yep, keep up the great work of totally destroying the AGW meme with FACTS and DATA.
You do a great job, Kenneth. 🙂
[…] would rely on a model where the independent variable can change by 33% and have no impact on the dependent variable? That isn’t science, that is […]
Meanwhile the “Unprecedented Recent Warmth” industry rolls along, such as in this recent effort by Briffa et al:
http://www.sciencedirect.com/science/article/pii/S0277379113001406#
Is it just me, or does dendroclimatology have zero credibility? It seems to be so full of magic potions and secret incantations, and the outputs seem indistinguishable from random noise, with only certain examples getting any publicity.
In the Briffa et al. Northern Hemisphere reconstruction from 2002, they showed how they “take care” of the declining temperatures in the tree-ring record after the 1970s. They just discard the decline (or “hide” it as per the purloined e-mails) and replace it with the adjusted instrumental record to show warmth.
https://notrickszone.com/wp-content/uploads/2017/08/Holocene-Cooling-Northern-Hemisphere-Briffa-2002-Divergence.jpg
You know so much of climate science is expressed in charts and graphs. But at least for me, when there is a historical record that runs counter to the charge or graph being presented then I go with the history. I trust the contemporary accounts of events more than I do any reconstruction or even thermometer data when that data is just for a very confined area of a regional or hemispherical or global climate event.
I see these various temperature charts that seem to minimize the MWP and LIA and they just don’t add up with what was written about the weather and conditions at the time.
From my recent reading I would agree with you RAH. I have been collecting information about recent archaeology in SW Greenland , the Norse settlements , for a proposed talk to a local archaeology/history group. (Vikings are always popular subjects).
Much of the recent archaeology is a rescue attempt to recover organic remains threatened by permafrost thawing.
It is obvious that the ground in which people were buried, or their wste deposited in the 11th to 14th cent was not frozen , nor were their hay fields , but they are now only just emerging from the LIA freezing .
The attempts to diminish the MWP/MCA by adjustment of proxy results thus run counter to the physical evidence. I know which I am inclined to believe.
I join with others above in saying thank you to both Richard and Pierre for this down to earth site keeping us informed in a factual way
Cheers for 2018
[…] K Richard, January 1, 2018 in […]
[…] – 150 NON-Global Warming Graphs From 2017 Pummel Claims Of Unusual Modern Warmth […]
Preliminary UAH is out: http://www.drroyspencer.com/
Above the running 13 month average but still a downward trend is emerging.
Something lost in translation ??
NON-Global Warming
Seems you mean
Global Non-Warming
Maybe not.
There has been some highly beneficial regional warming linked to solar and ocean cycles.. (mostly in colder NH places that could use some warming)
But the warming has definitely been NON-global.
The warming is not global, but regional. Some regions are cooling, some are warming, but overall there is nothing unusual about modern climate relative to the Holocene context. That’s why it’s “NON-global warming” instead of global non-warming…because the latter would imply it is not warming anywhere on the globe…and that’s not true either.
Just in
https://notalotofpeopleknowthat.wordpress.com/2018/01/04/noaa-erase-anomalously-cold-winters/
[…] 2017, there were 150 graphs from 122 scientific papers published in peer-reviewed journals that indicated modern temperatures are not unprecedented, […]