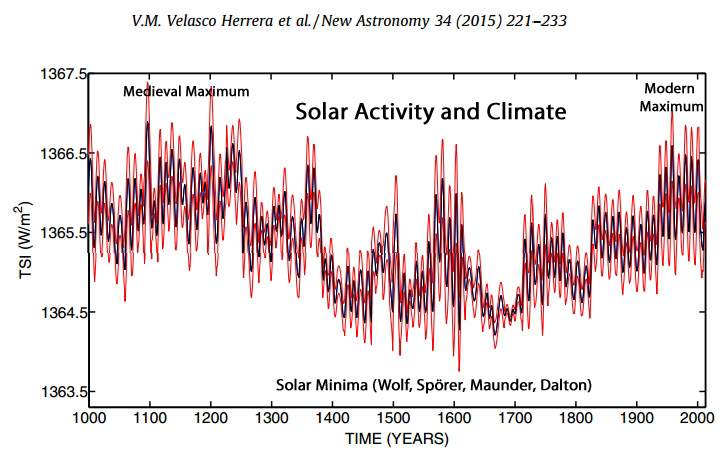
Graph Source: Herrera et al., 2015
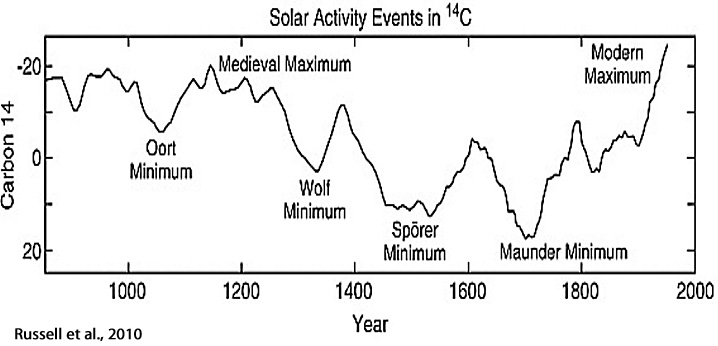
Graph Source: Russell et al., 2010
1. Oliva et al., 2018
Cold period during 1645–1706 (Maunder solar minimum). Cold period during 1810–1838 (Dalton solar minimum). Warm period during the mid-20th and 21st centuries (modern solar maximum).
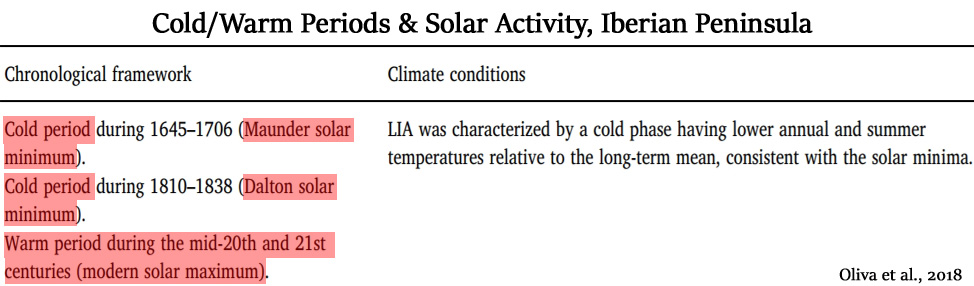
LIA [Little Ice Age] was characterized by a cold phase having lower annual and summer temperatures relative to the long-term mean, consistent with the solar minima. … The record shows rapid cooling since the start of the Spörer Minimum, which intensified during the Maunder Minimum (with the lowest estimated temperature being 2 °C lower than the recent average). A later increase in the temperature and another slight cooling probably coincided with the Dalton Minimum. Particularly cold winters occurred during the MCA (from 1090 to 1179), during the LIA onset (1350) and from the late 15th to early 16th centuries. Winter temperatures would have been approximately 0.5 °C lower during the LIA (1500–1900) than during the 20th century. … [T]he Maunder Minimum coincided with a cold period from 1645 to 1706, and the Dalton Minimum (1796–1830) is correlated with a cold stage spanning the years from 1810 to 1838.
Four warm periods (1626–1637, 1800–1809, 1845–1859, and 1986–2012) coincided with periods of increased solar activity.
The gradual increase in temperature during the second half of the 19th century resulted in significant glacier retreat, with rates of receding [in the second half of the 19th century] similar to those recorded during the last decades of the 20th century and in the early 21st century (Chueca et al., 2008). … The colder climate of the LIA was accompanied by severe droughts, floods, and cold/heat waves that showed significant spatio-temporal variation across the Iberian mountains.
The 20th century did not show unprecedented warmth over the last 800 years.
2. Ukhvatkina et al., 2018
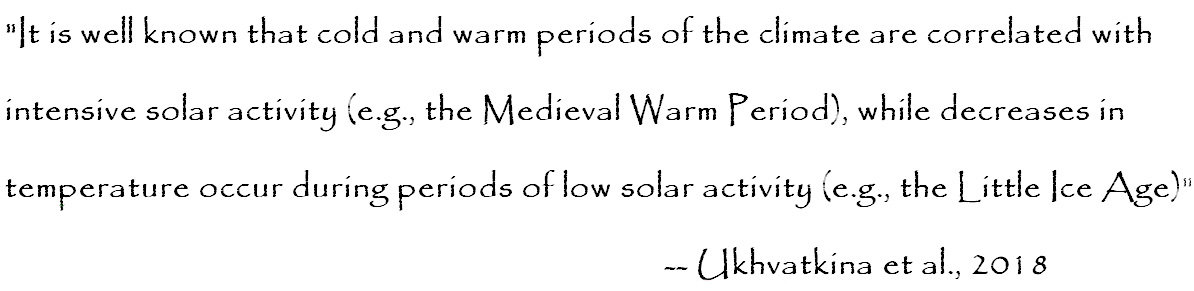
It is well known that cold and warm periods of the climate are correlated with intensive solar activity (e.g., the Medieval Warm Period), while decreases in temperature occur during periods of low solar activity (e.g., the Little Ice Age; Lean and Rind, 1999; Bond et al., 2001).
Long cold periods from 1643 to 1667 and from 1675 to 1690 that were revealed for another territory (Lyu et al., 2016; Wilson et al., 2016) coincided with the Maunder Minimum (1645–1715), an interval of decreased solar irradiance (Bard et al., 2000). The coldest year in this study (1662) was revealed in this period too. The Dalton minimum period centered in 1810 is also notable. … We suppose that a 9-year cycle may be related to solar activity, as, first of all, many authors showed influence of solar activity on the climate variability (Bond et al., 2001; Lean and Rind, 1999; Lean, 2000; Mann et al., 2009; Zhu et al., 2016). Secondly, the significant correlation between of the August–December minimum temperature reconstruction and TSI [total solar irradiance] can be regarded as additional evidence of this assumption. Finally, there is a coincidence of the reconstructed cold periods with the Maunder Minimum (1645–1715) and the Dalton minimum period centered in 1810. The solar activity influence in the region is traditionally associated with an indirect effect on the circulation of the atmosphere (Erlykin et al., 2009; Fedorov et al., 2015).
In the second half of the 20th century the solar radiation intensity changes contributed to more intensive warming of the equatorial part of the Pacific Ocean and more active inflow of warm air masses to the north (Fedorov et al., 2015).
Close periodicity is revealed in long-term climate reconstructions and is linked to the quasi-200-year solar activity cycle in other studies (Raspopov et al., 2008, 2009). Raspopov et al. (2008) showed that in tree-ring-based reconstructions the cycle varies from 180 to 230 years. Moreover, the high correlation between the minimum temperature reconstructions and TSI, and also the revealed link between the reconstructed temperatures and solar activity minima, lead us to suppose that the solar activity may be the driver of the 200-year cycle. Such climate cycling, linked not only to temperature but also to precipitation, is revealed for the territories of Asia, North America, Australia, the Arctic, and the Antarctic (Raspopov et al., 2008). At the same time, the 200-year cycle (de Vries cycle) may often have a phase shift from some years to decades and correlates not only positively but also negatively with climatic fluctuations depending on the character of the nonlinear response of the atmosphere– ocean system within the scope of the region (Raspopov et al., 2009). According to Raspopov et al. (2009), the study area is in the zone that reacts with a positive correlation to solar activity, though the authors note that we should not expect a direct response because of the nonlinear character of the atmosphere–ocean system reaction to variability in solar activity (Raspopov et al., 2009). Taking into consideration this fact and that the cold and warm periods shown in our reconstruction are slightly shifted compared with more continental areas and the whole Northern Hemisphere, we can say that the reconstruction of minimum August–December temperatures reflects the global climate change process in aggregate with the regional characteristics of the study area.
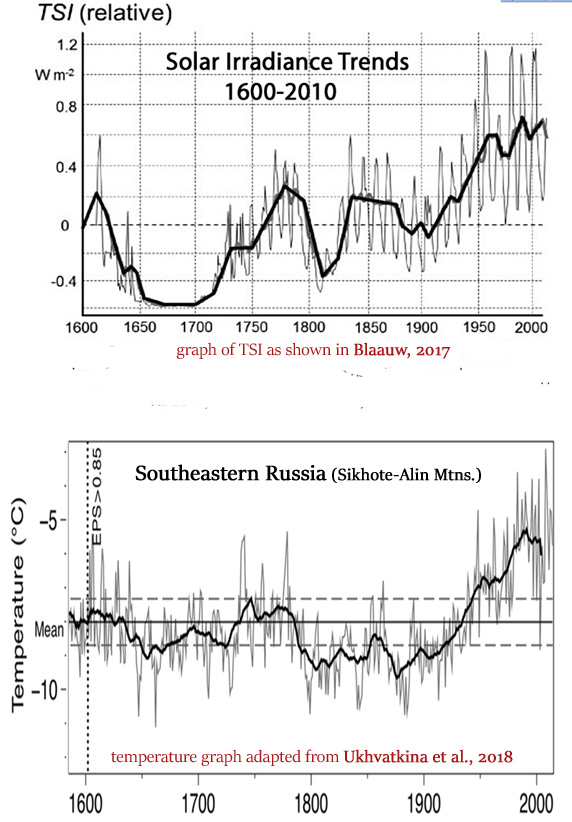
TSI graph (top) as shown in Blaauw, 2017
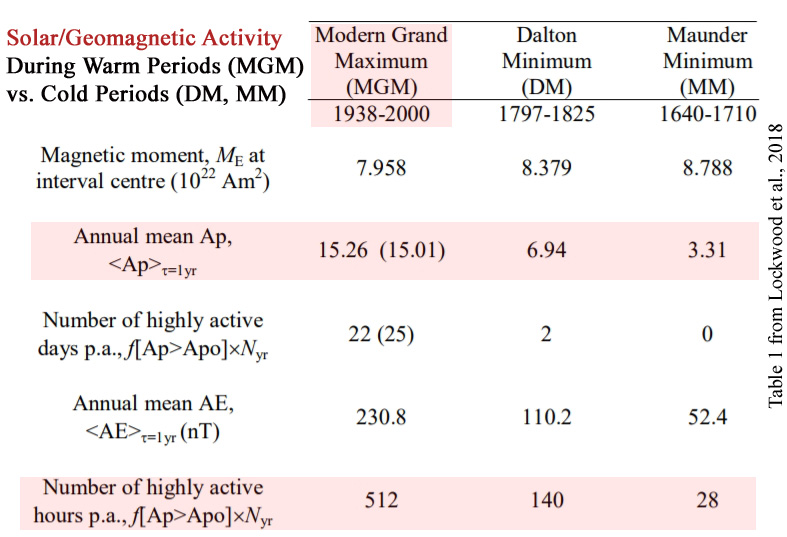
3. Lockwood et al., 2018
Space climate and space weather over the past 400 years: 2. Proxy indicators of geomagnetic storm and substorm occurrence
During the Dalton minimum [1797-1825] these reconstructions predict an average Ap that is roughly half of that during the modern maximum [1938-2000] but the number of storm-like days (with <Ap>=1dy > Apo) falls radically by an order of magnitude.
For the Maunder minimum, the mean Ap is lower than for the modern grand maximum by a factor of about 5 and the reconstructions predict no storm-like days would have been detected. Given the strong correlation between annual means of AE and Ap (r = 0.98), it is not surprising that the reconstructed AE index behaves in a somewhat similar way to Ap, with average values relative to the modern maximum that are roughly halved for the Dalton minimum and a fifth for the Maunder minimum.
The number of strong substorm-like hours p.a. in the Dalton minimum [1797-1825] is predicted to have been 140 compared to 512 in the modern grand maximum [1938-2000].
In the Maunder minimum this to falls 28 per annum (i.e. this predicts a total of 1,680 substorm-like hours during the 60 years of the Maunder minimum compared to 30,720 for the 60 years of the modern grand maximum). …
Looking to the future, the weakening of Earth’s magnetic moment means that the terrestrial disturbance levels during a future repeats of the solar Dalton and Maunder minima will be weaker and we here quantify this effect for the first time.


As far as I know I have the only proposed mechanism for the solar / climate link as set out here:
http://joannenova.com.au/2015/01/is-the-sun-driving-ozone-and-changing-the-climate/
Hi Stephen, Nice to see you visiting.
I suspect your ideas are part of the story, but let’s not forget changes to other solar facets in strong solar cycles.
Changes in magnetic fields,
Changes in solar winds
Changes in frequency content
They would all have some effects on the amount of energy reaching and being stored within Earth’s gravity controlled atmosphere.
The way I see I, gravity effect sets the approximate temperature balance point and is modified by solar and cloud effects.
Zero proof that CO2 has anything but a very tiny immeasurable effect.
addition…
“stored within Earth’s gravity controlled atmosphere..”
and within the oceans.
Hey Seb@stian, have you seen the the big, bright, yellow ball in the sky?
Believe it or not its radiant enenergy provides the Earth’s atmosphere, land and oceans with most of their heat.
It also interactacts with the Earth’s magnetic field and it modulates cloud forming cosmic rays.
Of course changes in the different modes of solar output are as nothing compared with the “miracle molecule”, CO2.
Yet another fine batch of papers! Well done Kenneth 🙂
Again, and again, and again! it is shown that our climate is commanded by solar variations. Indeed the sun is the ultimate controller for all life on this planet, human influence is negligible in comparison. Solar energy and the ocean’s storage and release mechanisms (of that energy), are the main drivers of this planet’s climate.
The influence of atmospheric CO2 levels on the planets ability to retain the sun’s heat is also negligible, as CO2 does not and has not (while water has been on the surface and in the atmosphere) controlled the temperature of this planet.
If anyone has scientific observations that shows atmospheric CO2 controls this planet’s temperature and the climate better than the sun, or that atmospheric CO2 somehow regulates/moves more (solar) energy than oceans do, please feel free to provide it(them?) here.
Human generated CO2 has even less influence because there is so little of it compared to other natural sources of CO2 (unless you have verified scientific observations to the contrary).
It’s interesting to me that the warmists dismiss solar variation of 0.1% as being too insignificant to affect the climate, while at the same time telling us it’s CO2 we have to worry about, despite the fact that total CO2 is only 0.04% of our atmosphere.
Some good news? Climate scientists are beginning to look at factors other than CO2.
https://science.nasa.gov/science-news/science-at-nasa/2013/08jan_sunclimate
That was 5years ago. I wonder if they’ve made any progress since then?
There are often “take-away” lines in articles.
“There is, however, a dawning realisation among researchers that even these apparently tiny variations can have a significant effect on terrestrial climate”
Except,that some of the changes during solar cycles are not “tiny” by any stretch of AGW non-science.
NASA.. starting to try to cover its “assets” against the coming cooling trend ???
Also..
“Of particular importance is the Sun’s extreme ultraviolet (EUV radiation, which peaks during years around solar maxima. Within a relatively narrow band of EUV, the Sun’s output varies not by a minuscule 0.1% but by a whopping factor of 10 or more”
And UV interacts with ozone, and also penetrates the oceans to varying depths.
Great article, yon. 🙂
Very good point yonason,
I suspect cAGW advocate dismiss solar variation because their rationality has been locked in a greenhouse.
[…] Step #5: Go back and make needed adjustments and retest – The mean temperature of the past 150 years does not fall outside the norm for the past 12,000 years. Search for another variable that can better explain the temperature variation…like the sun. […]
[…] Step #5: Go back and make needed adjustments and retest – The mean temperature of the past 150 years does not fall outside the norm for the past 12,000 years. Search for another variable that can better explain the temperature variation…like the sun. […]
I’ve started directly saying to folks that there is zero evidence that CO2 is the control knob for temperature on this planet. If they have the evidence, please call a press conference and become famous. They sputter and fume, then run away.
You can see that the big empty cannot produce any evidence of CO2 warming in our gravity controlled convective atmosphere.
Spluttering is now his modus operandi.
Do you mean to tell us that global climate might not be determined by the concentration of the only component of the atmosphere over which we have convinced ourselves that we have some influence over?
Wow!
So, how are we going to control the climate, then? (Which, surely, we must be able to do, as so-o-o-o many politicians have told us that we can – and they have been told that we can by scientists whose income depends upon convincing these politicians that we can.)
[…] New (2018) Papers Link Modern Warming And Past Cooling Periods To High, Low Solar Activity 3 New (2018) Papers Link Modern Warming And Past Cooling Periods To High, Low Solar Activity http://static-m.meteo.cat/wordpressw…et-al-2018.pdf […]
[…] Read more at notrickszone.com […]
[…] finds the best correlations, not causation. It would, however, produce reports that would show the sun and ocean temperatures are far more significant than CO2 with regards to temperature. Slimate clientists would then be […]
The ipcc says that more than 50% of warming occurred since 1950 and there reasoning for this is there were no natural causes. Looking at the Herrera graph I’d say that tie went up about .7 watts/m2 since about 1900. Also there was increases in higher energy uv and xrays. The oceans would absorb both of those. Trenberth say the total imbalance since 1900 was about 0.6 watts/m2. This correlates almost exactly with the total energy increase from the sun. How can they ignore this?
[…] H/T to Kenneth Richard at the No Tricks Zone. https://notrickszone.com/2018/01/22/3-new-2018-papers-link-modern-warming-and-past-cooling-periods-to… […]
History:
“An dieser Stelle spricht Lichtenberg von dem Problem möglicher periodischer Schwankungen der Sonnenstrahlung und der Abhängigkeit von Klimaveränderungen von diesen / There Lichtenberg speaks of the problem regarding possible periodical variations of the solar rays and the dependance of climatic variations from these.” (Hans Blumenberg, “Wirklichkeiten in denen wir leben”, Philipp Reclam jun. 7715, Stuttgart 1999,p. 159)
Georg Christoph Lichtenberg 1742 – 1799