Guest writer Kenneth Richard provided in a comment an abbreviated list of locations across the globe that have not seen any warming over the past 60 years and more.
Yet many authorities at these locations are rushing blindly to curb rapid warming they falsely believe is taking place. Maybe they ought to look at the data for once before wasting billions trying to prevent something that isn’t even there.
For example the North Atlantic, an important region concerning global climate, has not warmed since the 1870s!
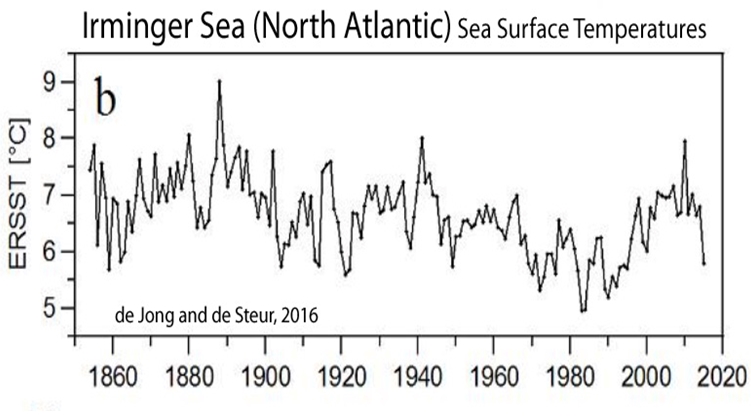
The North Atlantic was warmer 130 years ago than it is today. Source: de Jong and de Steuer, 2016.
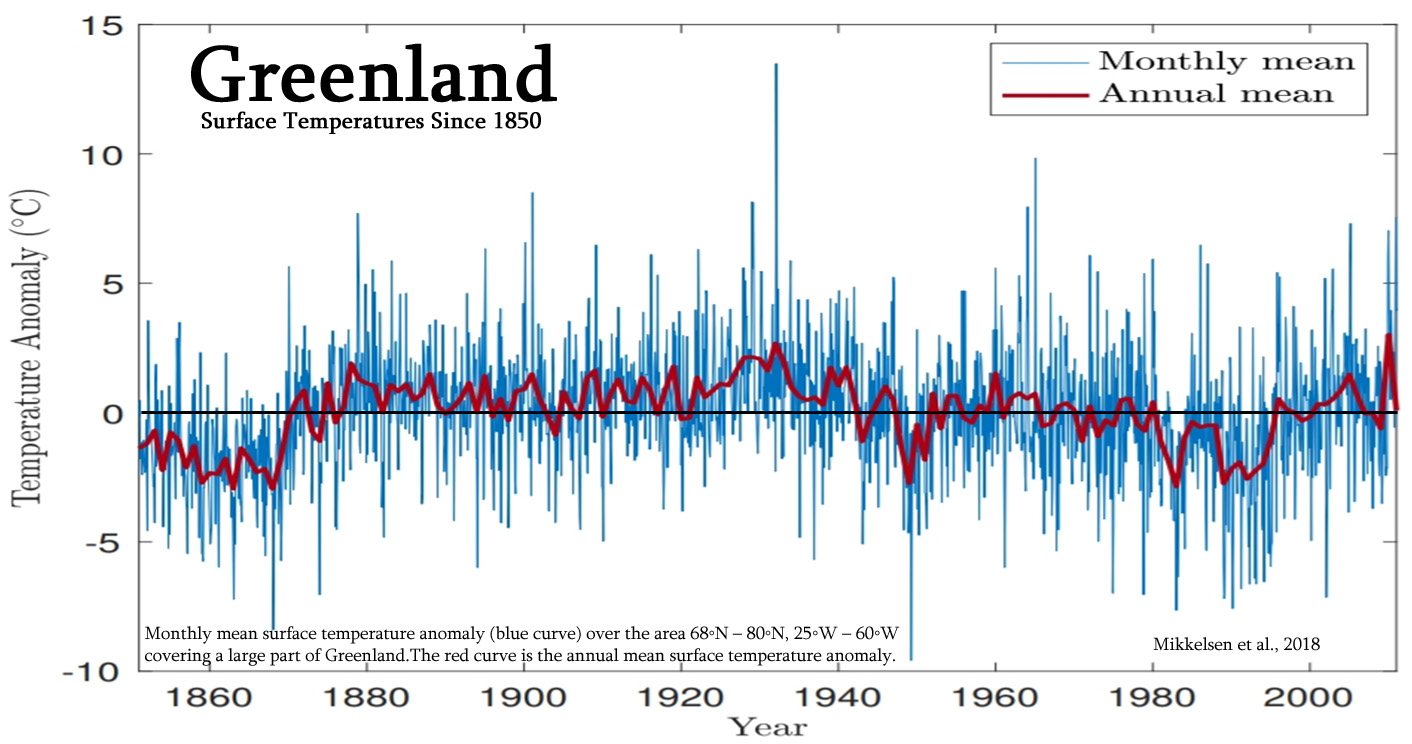
Greenland as stable as ever
Greenland, a major concern of climate alarmists because it stockpiles enough ice to raise global sea levels some 6 meters, also hasn’t warmed in since the 1880s, as the following chart from Mikkelsen et al 2018 shows:
Antarctica: no warming in 200 years
The big sea level kahuna of course is Antarctica. If that huge block of ice ever melted completely, sea levels would rise some 60 meters! And thus submerge vast areas of lowlands worldwide (never mind it would take thousands of years at extremely higher global temperatures).
Yet According to Schneider et al 2006, there hasn’t been warming there in 200 years!
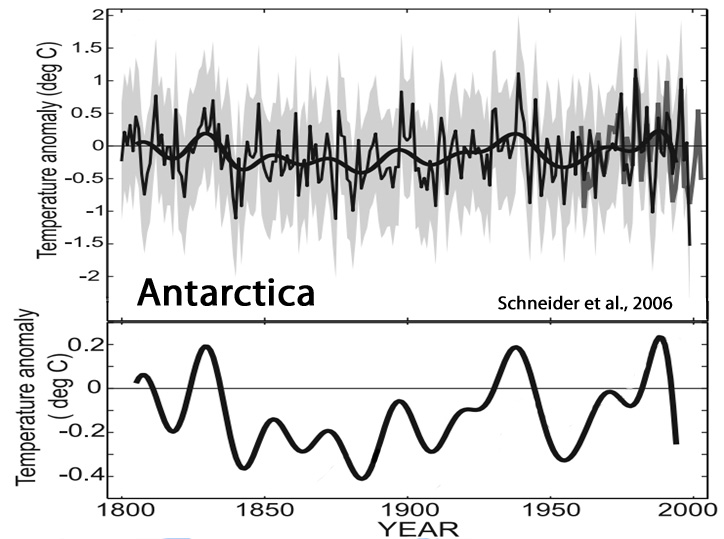
Antarctic temperatures in fact had been heading sharply south at the time the paper was published.
Himalayas: no warming in 300 years!
Potsdam Institute for Climate Impact Research Director Hans-Joachim Schellnhuber once embarrassed himself by claiming the massive Himalayan glaciers would melt by the year 2030. But the following chart tells us that it might take just a bit longer:
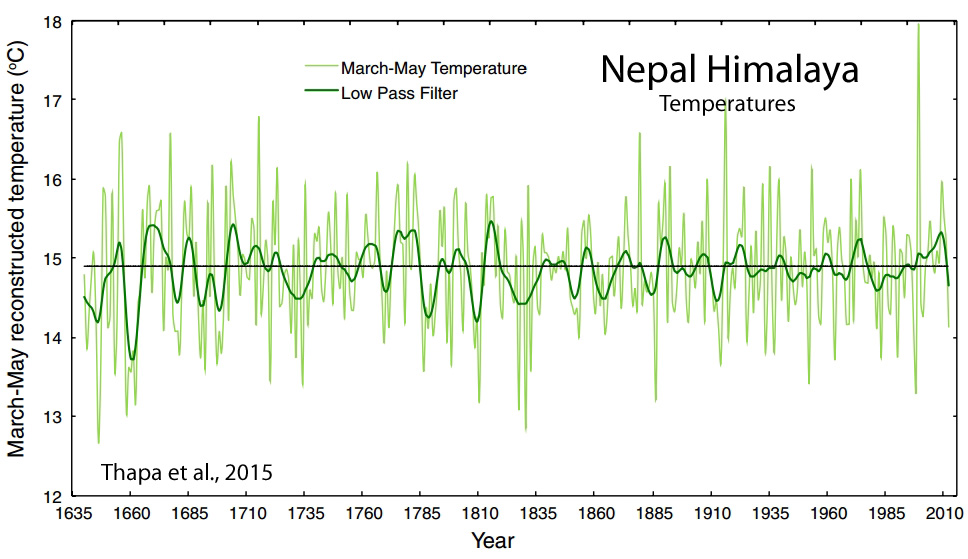
According to a study by Thapa et al, 2015, the Himalayas recently have been cooling and the temperature there now is like it was 300 years ago! Don’t worry, when the year 2030 comes around, we’ll be sure to check to see if the ice is still there. In the meantime, do your best bearing all the suspense.
And so it goes region after region. So the next time the media and climate alarmists issue panicked warnings of rapid warming and melting ice caps, we need to ask ourselves: What the hell are they raving about? Are they okay?
The following is only an abbreviated list of places that have not cooled in a long time, and Kenneth says there are hundreds more like these. Many are from the results of very recent papers. Click on the links provided for the charts.
Since 1870s – no warming
Greenland – no warming
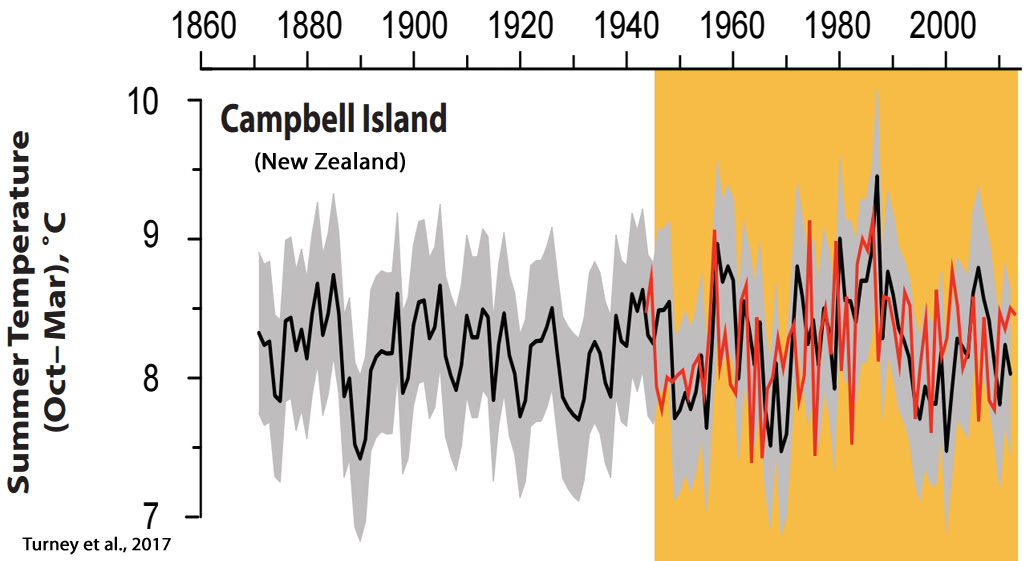
New Zealand – no warming
Antarctica – no warming
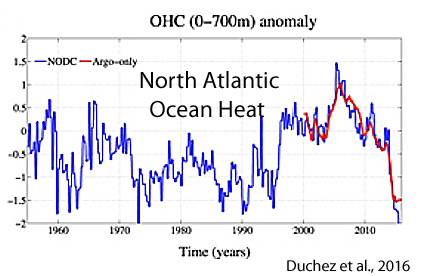
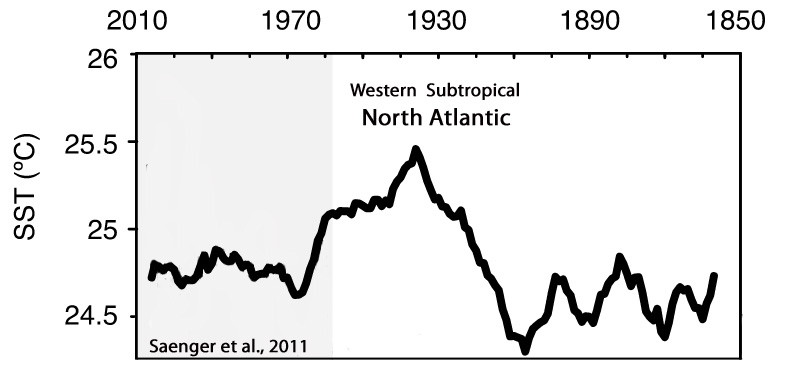
North Atlantic – no warming
Western Pacific – no warming
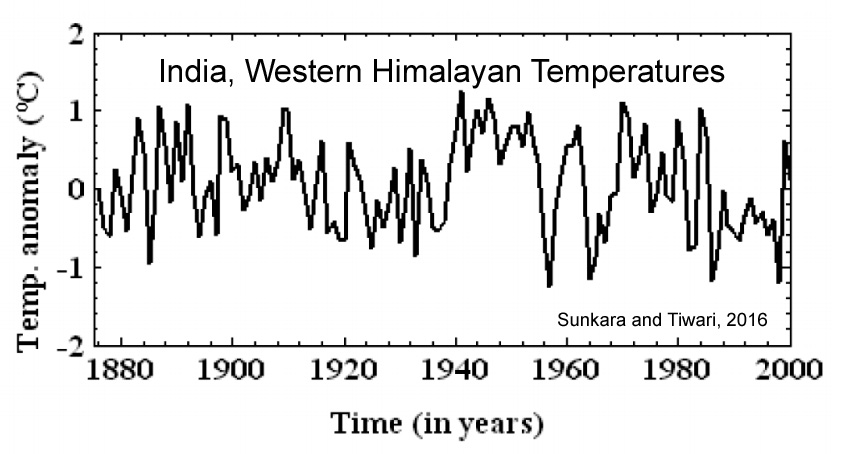
India/Western Himalaya – no warming
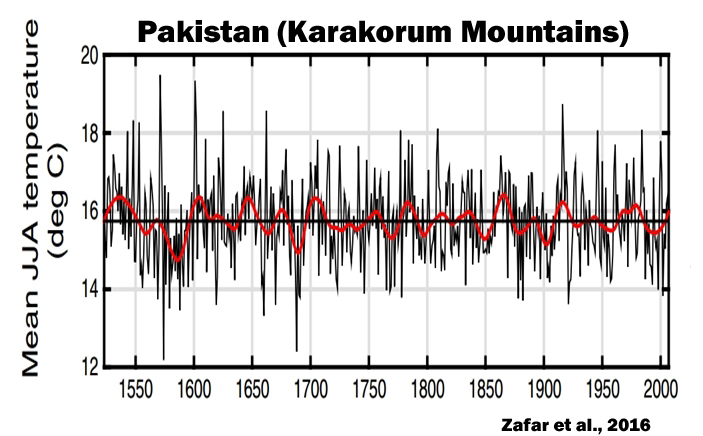
Pakistan – no warming
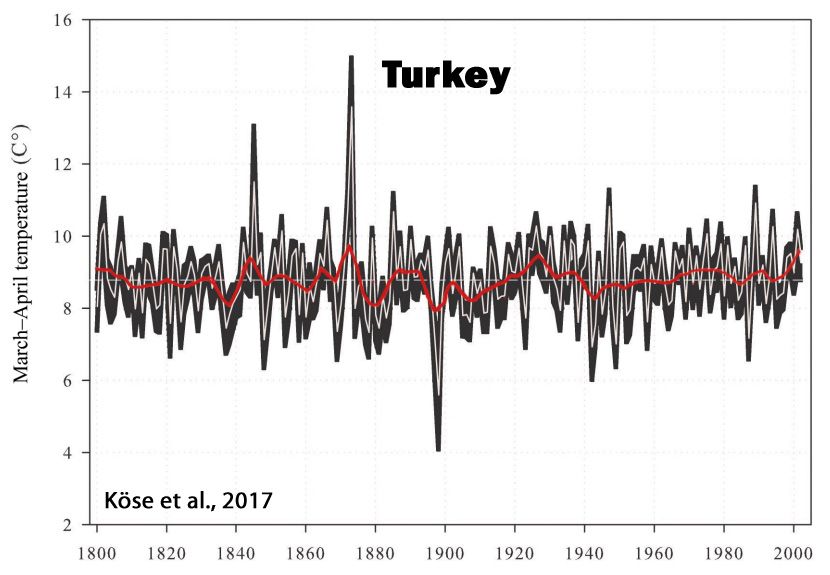
Turkey – no warming
Himalayas/Nepal – no warming
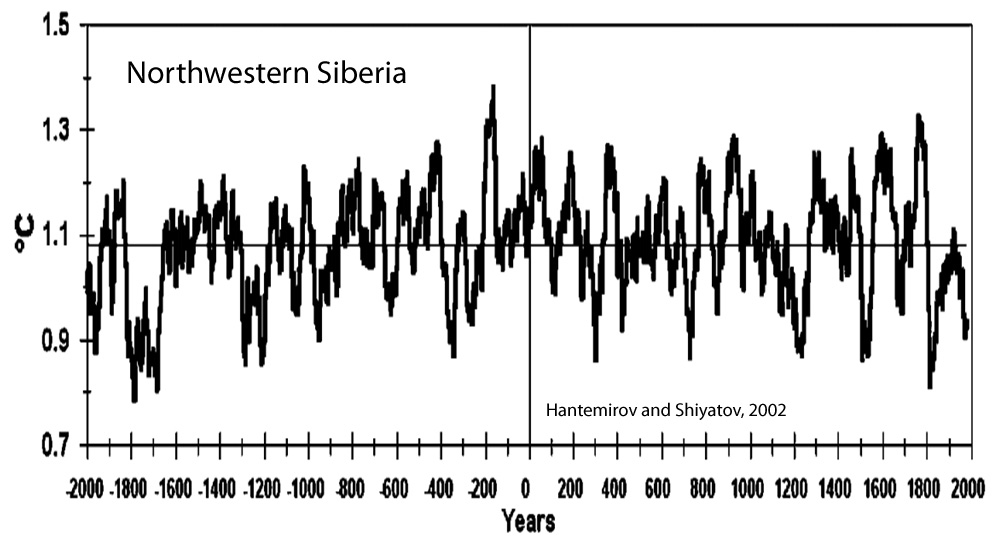
Siberia – no warming
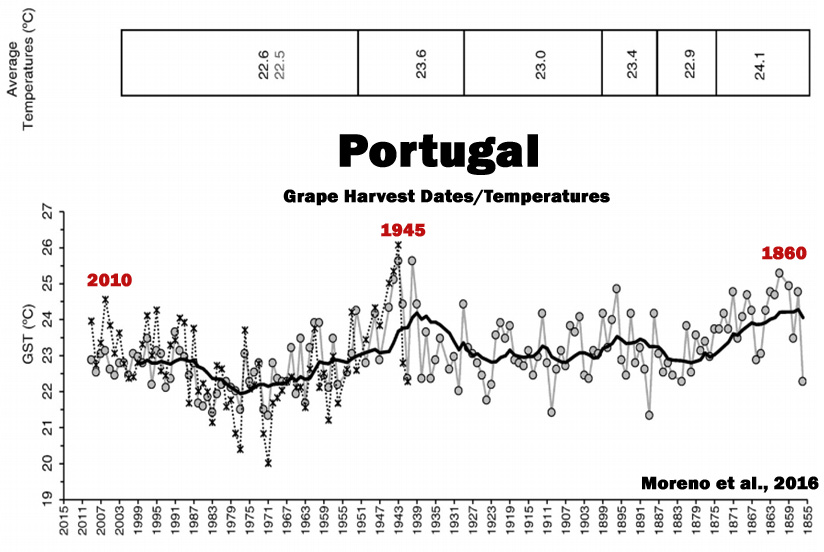
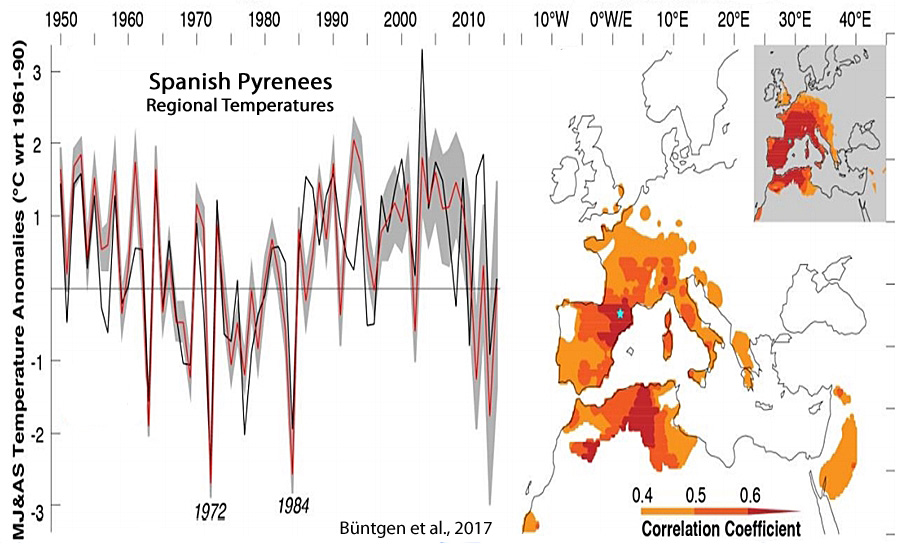
Portugal – no warming
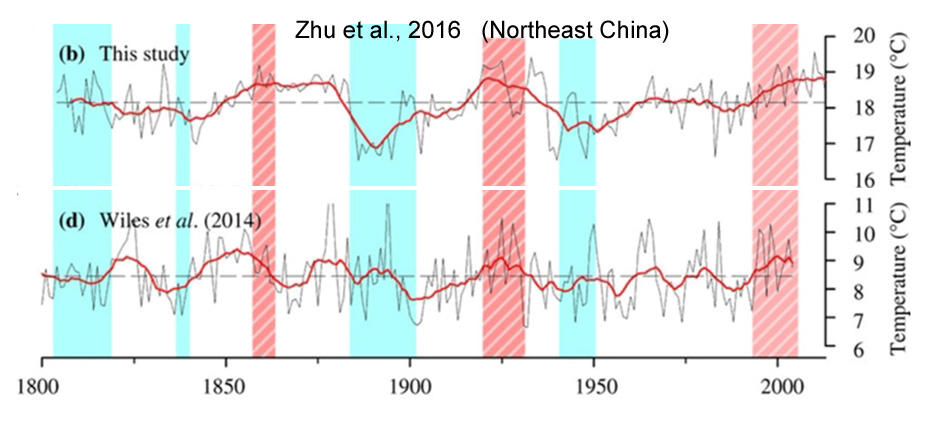
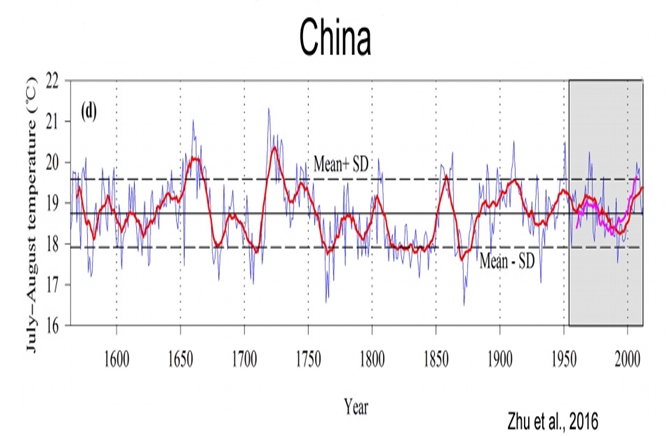
NE China – no warming
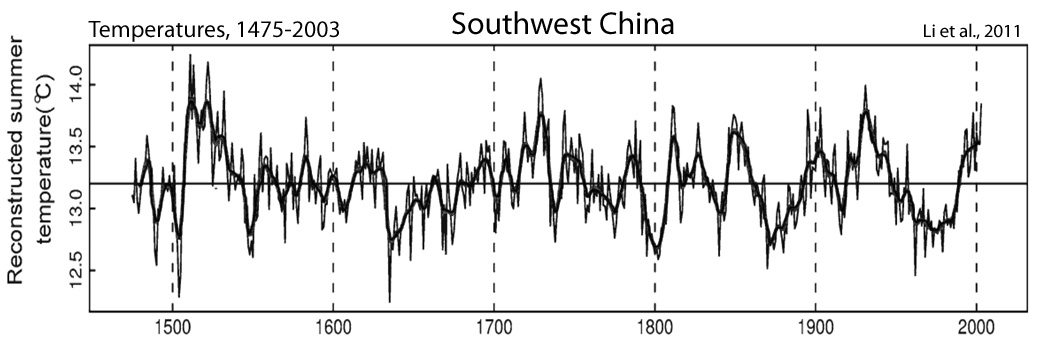
SW China – no warming
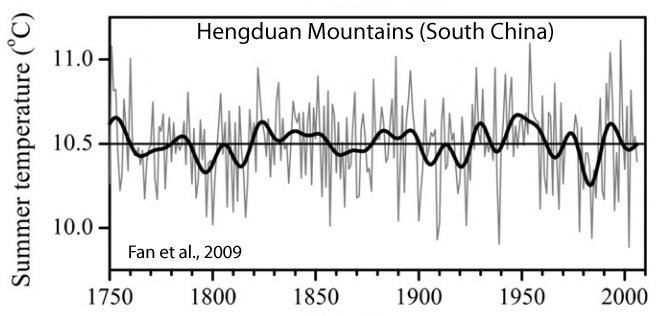
South China – no warming
West China – no warming
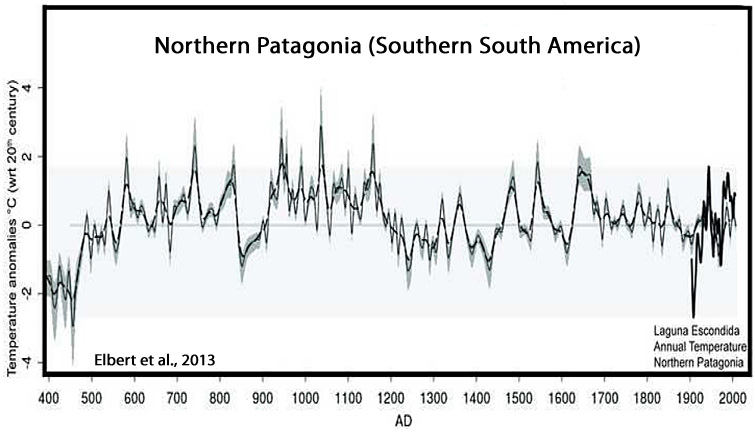
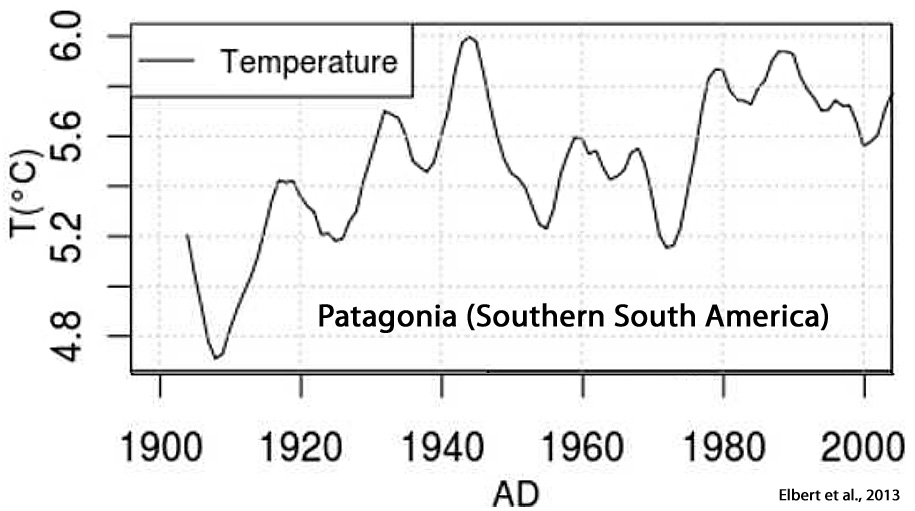
Southern South America – no warming
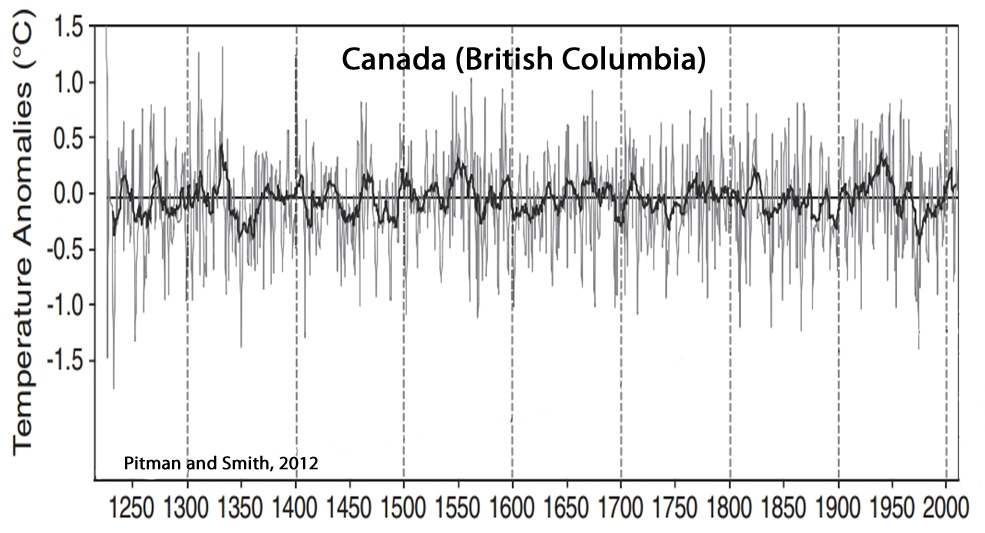
Canada (B.C.) – no warming
Canada Central – no warming
Since 1940s/50s – no warming
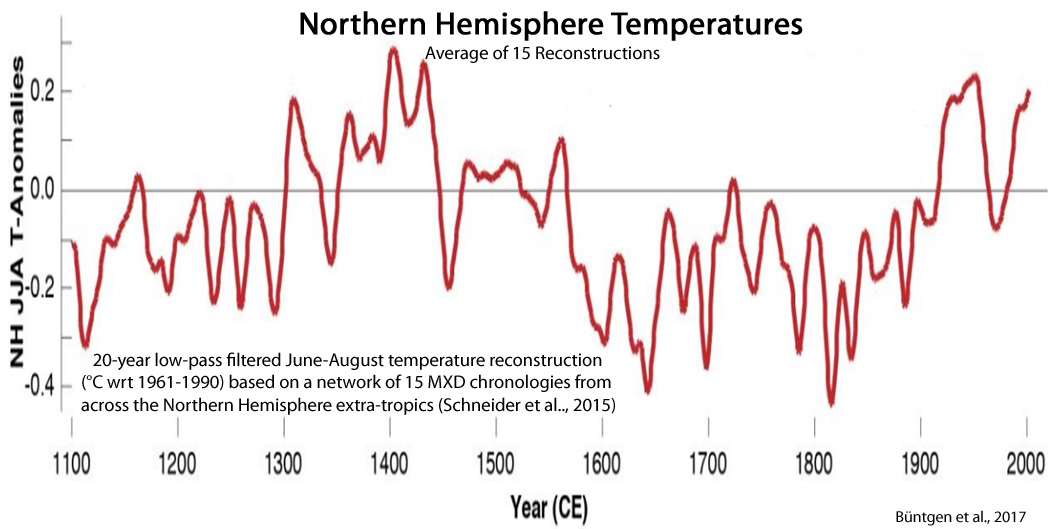
Northern Hemisphere – no warming
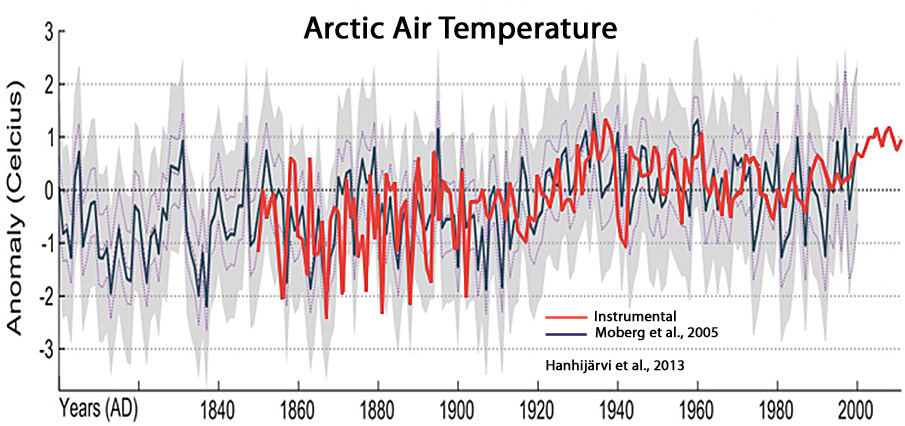
Arctic Region – no warming
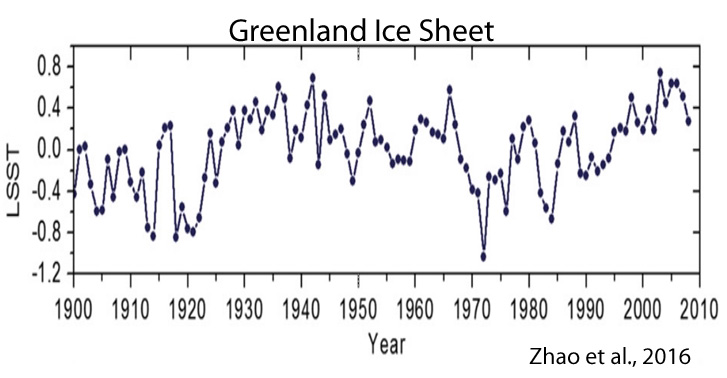
Greenland – no warming
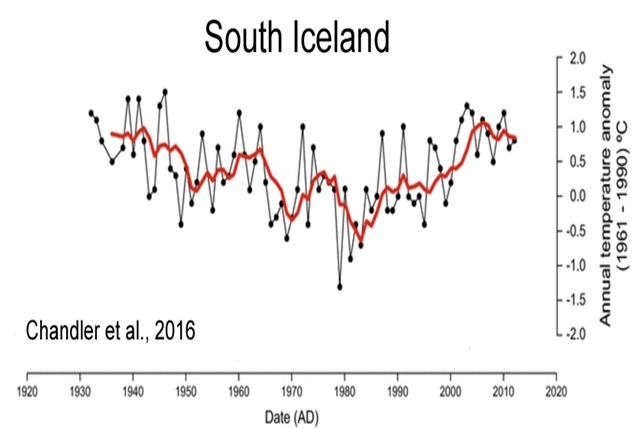
South Iceland – no warming
North Iceland – no warming
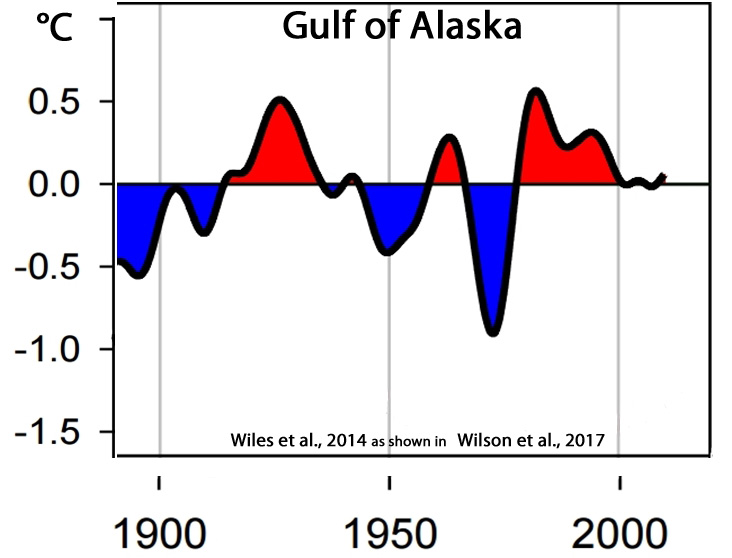
Alaska – no warming
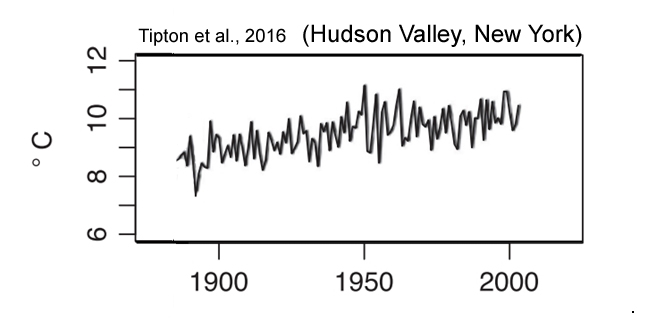
New York – no warming
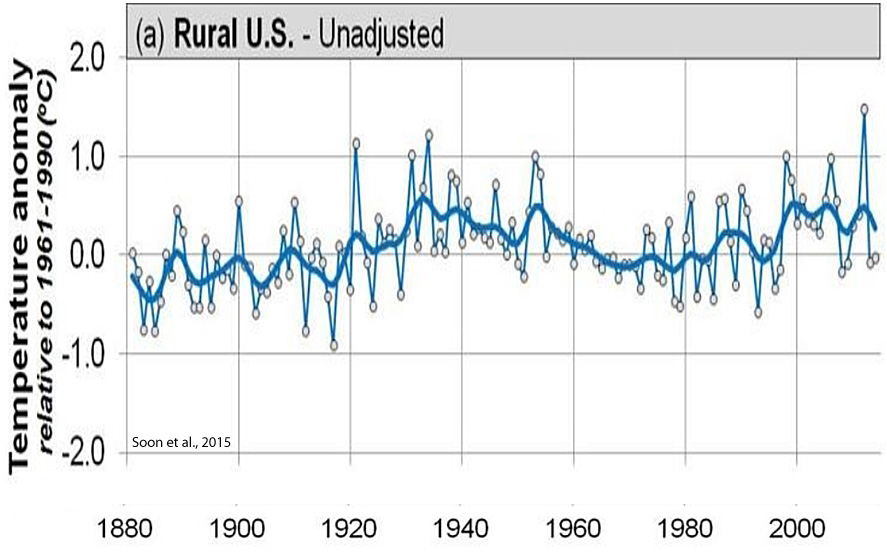
Rural U.S. – no warming
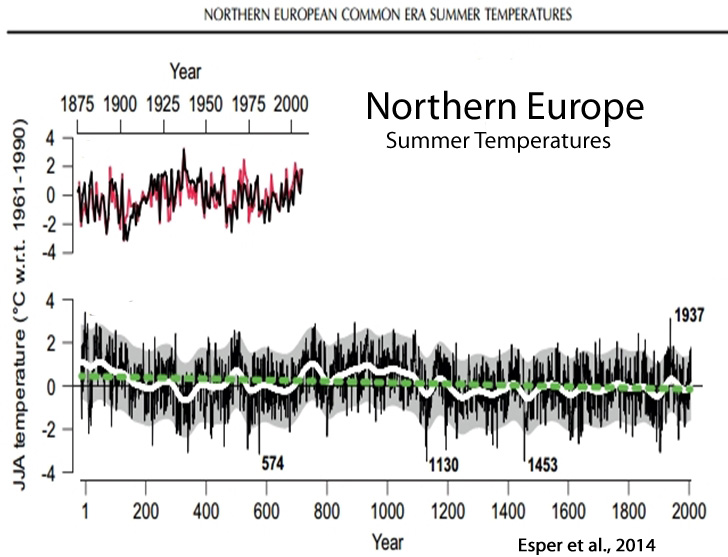
Northern Europe – no warming
Western Europe – no warming
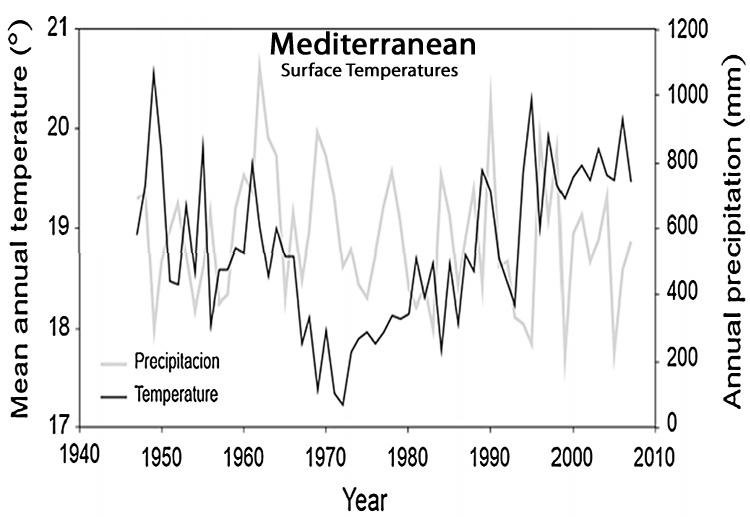
Mediterranean Region – no warming
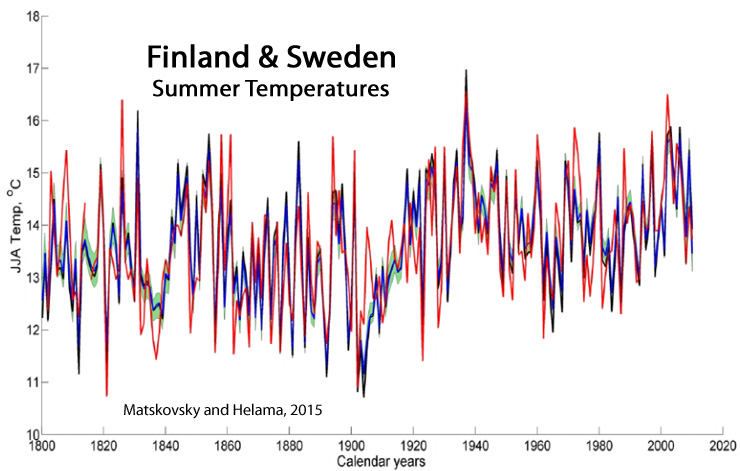
Finland and Sweden – no warming
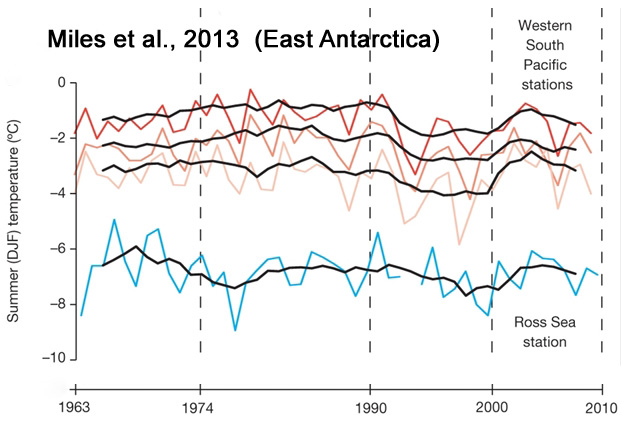
East Antarctica – no warming
North Atlantic – no warming
Western North Atlantic – no warming
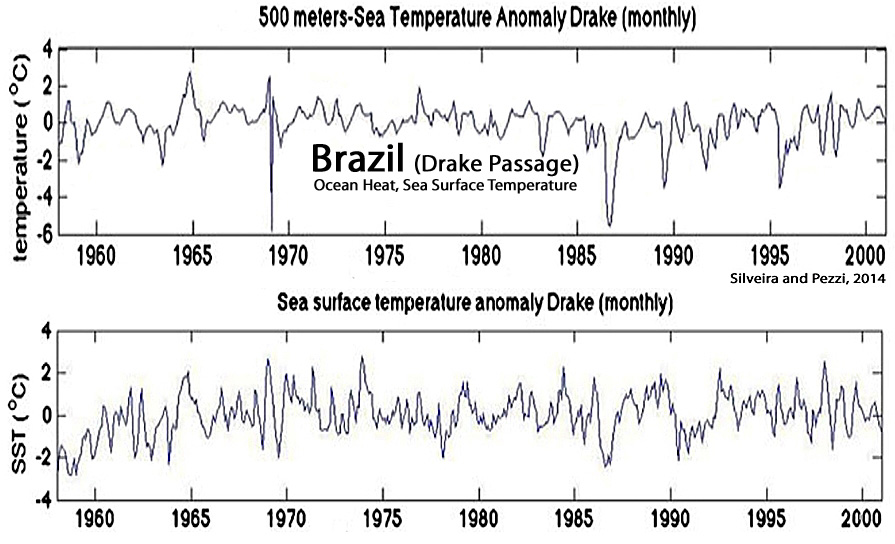
Brazil – no warming
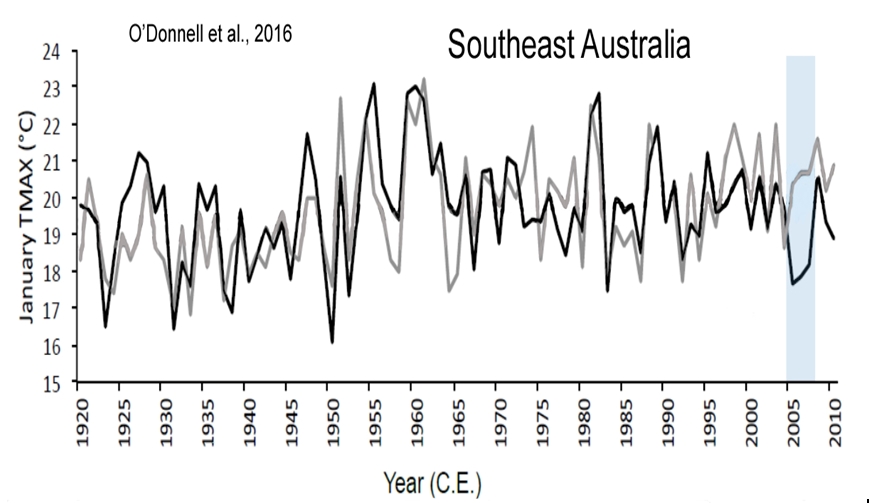
SE Australia – no warming
Southern South America – no warming
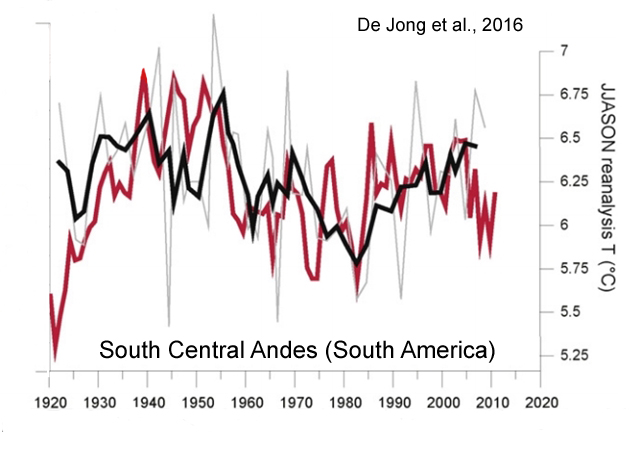
Andes Mountains – no warming
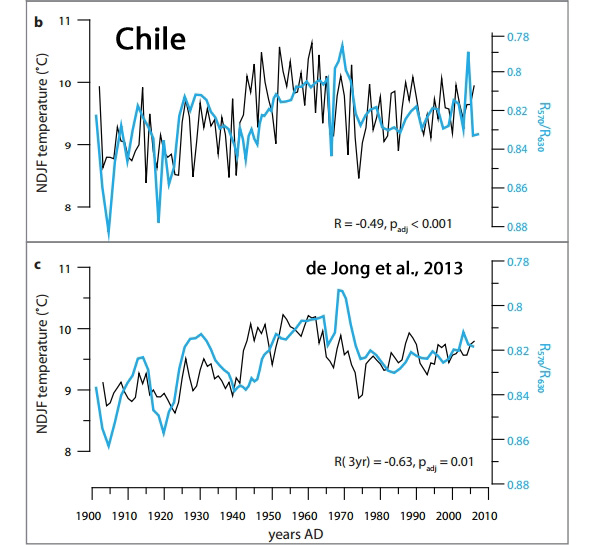
Chile – no warming
If you live there, send them to your lawmakers and ask why they are wasting so much money preventing something that isn’t even happening.
Thanks to Kenneth Richard for compiling this handy list.


That is not say that I don’t believe in global warming. I think it has warmed since 1800, but it seems to have stopped over the past 20 years. I am sure the end of the world is a long way off, and anyone who believes it’s just a few hundred years away is a total idiot and a chump. (Here I’m ignoring a geological or meteor catastrophe of course).
Pierre, this post is very interesting!
Thank you.
Thanks, Kirye. Please feel free to spread this in japan. 🙂
Sure. I’d love to. (^-^)
Hi Kirye,
Thanks for your efforts keeping track of the Japanese temperatures.
Very much appreciated. 🙂
Thank you, too.
I am so happy to hear that. (^^)
I don’t follow social media, but from what I’ve seen of yours that Pierre has posted, you you have a very good understanding of the difference between climate fantasy and reality. Keep up the excellent work!
Remember that there are cycles of warming and cooling. However, the recent warming peak was lower than the 1938 peak, which follows the trend of warming periods since the Minoan Warm Period becoming successively lower. We may have warmed since 1800, but we are not on a downward trend to another minimum similar to a Dalton or Maunder Minimum.
This is what “no warming” (for 60 years and more) looks like?
https://pbs.twimg.com/media/DWJhsQaX4AAd0y7.jpg:large
I must be confusing blue with red/orange then …
Hi Kirye,
Thanks for your efforts keeping track of the Japanese temperatures.
Much appreciated. 🙂
Poor seb, Still hooked on the Slight, but HIGHLY BENEFICIAL and TOTALLY NATURAL WARMING out of the COLDEST period in 10,000 years.
And Berkeley Earth. seriously !!!!
roflmao, One of the most RABID groups of data FABRICATORS among the AGW Collaborators. Regional Expectations and all that.
Get back to REALITY.
Start with the FACT that there is ZERO evidence that CO2 causes warming of oceans , atmosphere or of ANYTHING !!
The ONLY places that have shown any of the NATURAL WARMING have been those affected by REGIONAL factors to do with ocean oscillations and El Nino events.
Many of those places are basically the same temperature now, as they were around 1940, when the last peak in the AMO occurred.
Hi, Andy.
PBS.
Berkeley Earth.
hahahahahahaha
“…until the 1960s, surface temperature data was collected using mercury thermometers located at weather stations situated mostly in the United States, Japan, the United Kingdom and eastern Australia. Most of the rest of the planet had very few temperature sensing stations. And none of the Earth’s oceans, which constitute 70 percent of the planet’s surface area, had more than an occasional station separated from its neighbors by thousands of kilometers or miles.”
https://objectivistindividualist.blogspot.com/2018/02/overheated-claims-on-temperature.html?m=1
Talk about arguments from ignorance. There is no way they could know the earth had warmed, even if modern temps were accurate, which they aren’t because of adjustments.
Here’s how they get their “data” today. They make it up! (as you know)
https://m.youtube.com/watch?v=hepDKNVgG0M
Sure. You can trust “the science.” Wink wink. Nudge nudge.
We ask for proof, and the trolls give us activist agitprop from known liars.
https://climatechangedispatch.com/berkeley-earth-climate-fraudster-makes-another-appearance/amp/
I found this discussion of the quality of temperature data illuminating:
https://wattsupwiththat.com/2018/02/18/overheated-claims-on-global-temperature-records/
Seb. I wouldn’t believe in adjusted an homogenised data if I were you.
But there again you blindly accept anything that supports the “cause” and equally blindly reject anything that does not.
Very sad.
It’s the other way around Bitter.
More cognitive dissonance from Seb.
I will believe that AGW is causing sea levels to rise when the Pentagon announces that they are closing their military base on Diego Garcia.
No Warming and no consensus
https://youtu.be/Izn7k55bkM0
Thanks, never heard of Adapt 2030. But good video!
[…] Greenland, Antarctica And Dozens Of Areas Worldwide Have Not Seen Any Warming In 60 Years And More! […]
[…] Greenland, Antarctica And Dozens Of Areas Worldwide Have Not Seen Any Warming In 60 Years And More! […]
P Gosselin 18
This article has me questioning the process of getting a “global temperature ” again. Is it possible that the process of homogenizing temps has nearly uniformly raised the local temperatures to show warming when looking at localized areas shows no warming? I have read Wallace’s paper that dismisses the surface temperature data sets as not realistic. Has anyone tried to synthesize these no warming papers onto world or continental maps?
Thanks for bringing this info up again.
All one really needs to do is notice what’s been done to graphs of “global temperature” to see what they’ve been doing. In 1987, for example, they had a +0.5 C warming between the years 1880 and 1950…
https://notrickszone.com/wp-content/uploads/2017/02/NASA-Global-Surface-Temps-1987-0.5C-1880-1950-768×751.jpg
Today, they’ve eliminated that 0.5 C of warming. They is no longer any warming shown between those two data points…
https://notrickszone.com/wp-content/uploads/2017/02/NOAA-Data-Manipulation-No-Warming-1880-1950.jpg
They “adjust” out the temperature trends that are inconvenient to the cause. They cool the past and warm the present. In this way, they can make temperature changes look linear rather than oscillatory, as the latter undermines the cause.
That truly is an unbelievable amount of “ADJUSTMENT”.
Must have been because of CO2 😉
It also effectively minimises the supposed temperature rise on the 1987 chart which could not possibly be due to human CO2 emissions:
http://cdiac.ess-dive.lbl.gov/trends/emis/graphics/global.total.jpg
If you don’t understand the adjustments, just call them fake. As if displaying one’s lack of understanding has ever convinced anyone of a weird conspiracy theory. You need to do better Kenneth! NOAA adjustment algorithms are open. Examine them, find the problem. Propose a better adjustment algorithm and we will all thank you very much!
Does SebH understand there no need for adjustments if climate scienses are using only the anomaly? If doing so no need adjustment. Adjustment only need to make absolute data comparable.
If data adjustment then why?
DMA
Your reference to Wallace’s paper — would that be this one?
https://thsresearch.files.wordpress.com/2017/05/ef-gast-data-research-report-062717.pdf
The problem with most temperature graphs up there (at least the ones I clicked on) is that they aren’t measured temperatures. It’s reconstructions and proxy data. Maybe I’ll invest the time and overlay some of those with the actual temperature data measured in that region up until today. Then it should become obvious.
New Paper: 1,407 Contiguous U.S. Temperature Stations Reveal NO WARMING TREND During 1901-2015
If I were working on a world temperature map, I would only use rural station, unadjusted, real readings. Urban readings are basically showing localized heat sinks, so should be thrown out of the global temperature dataset. I live 6 miles out of a 250,000 population city, and routinely see a drop of 1 to 4 degrees Celsius drop while driving home from the city. Any adjusted temps, rural or urban, are just synthetic imaginings of what the temperature was, no matter how sophisticated the algorithm used. You can only get the actual temp. Once…when it is measured.
In addition to adjustments, here’s another way to make it look like warming is happening, when it isn’t.
https://objectivistindividualist.blogspot.com/2018/02/overheated-claims-on-temperature.html
Long term COOLING in Antarctica
https://s19.postimg.org/nn6qmzrb7/antarcticacooling.gif
Short term cooling of Antarctica
https://s19.postimg.org/yubej7oyr/ant-ta-monthly-1979-2016-11-01.gif
Canada COOLING since 1998
https://s19.postimg.org/o1ou9ruir/canada_cooling.jpg
All this COOLING while global CO2 increases.
How “inconvenient” 😉
Interesting! This needs two responses. First where HAS there been warming, by how much and how certain are the figures?
Second this needs imaging on a global map. A visualisation could be very powerful.
RSS Satellite temperature dataset revised – go on – guess
Carbon Brief is gloating
[…] Ref.: https://notrickszone.com/2018/02/18/greenland-antarctica-and-dozens-of-areas-worldwide-have-not-seen-… […]