It is often claimed that modern day sea ice changes are “unprecedented”, alarming, and well outside the range of natural variability. Yet scientists are increasingly finding that biomarker proxies used to reconstruct both Arctic and Antarctic sea ice conditions since the Early Holocene reveal that today’s sea ice changes are not only not unusual, there is more extensive Arctic and Antarctic sea ice during recent decades than there has been for nearly all of the last 10,000 years.
Antarctic Sea Ice Extent
In the Southern Ocean surrounding Antarctica, the sea surface temperatures have been cooling since 1979.
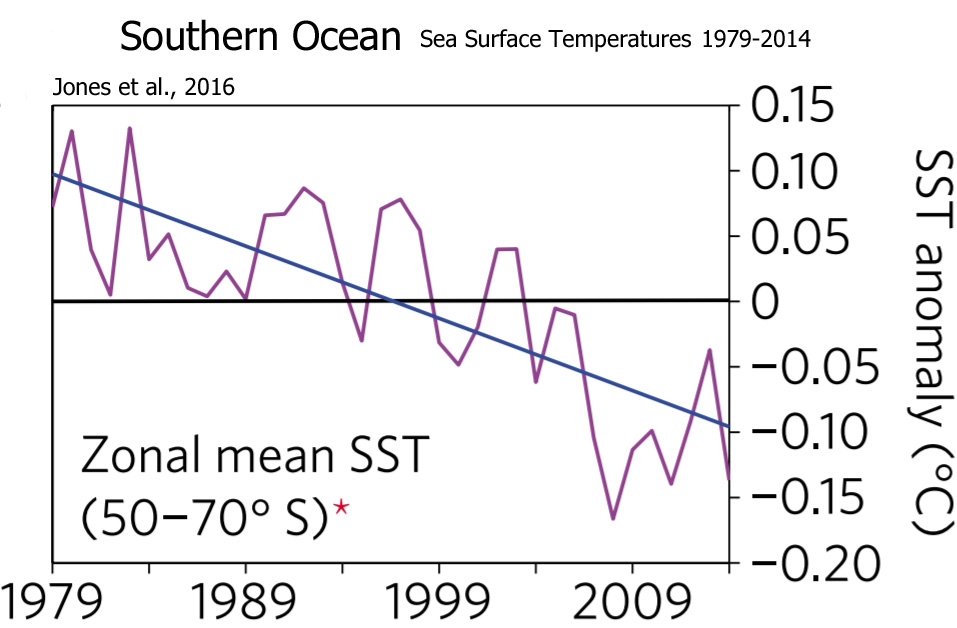
Image Source: Jones et al., 2016
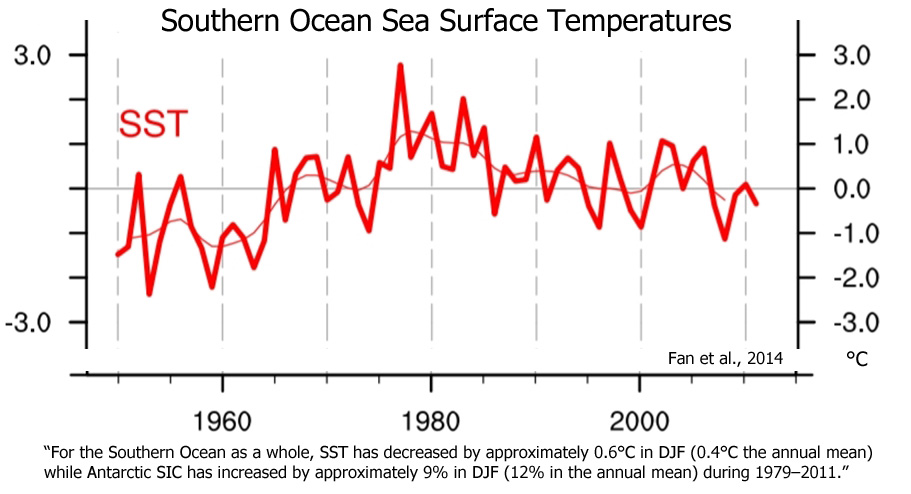
Image Source: Fan et al., 2014
Purich et al., 2018 “Observed Southern Ocean changes over recent decades include a surface freshening (Durack and Wijffels 2010; Durack et al. 2012; de Lavergne et al. 2014), surface cooling (Fan et al. 2014; Marshall et al. 2014; Armour et al. 2016; Purich et al. 2016a) and circumpolar increase in Antarctic sea ice (Cavalieri and Parkinson 2008; Comiso and Nishio 2008; Parkinson and Cavalieri 2012).”
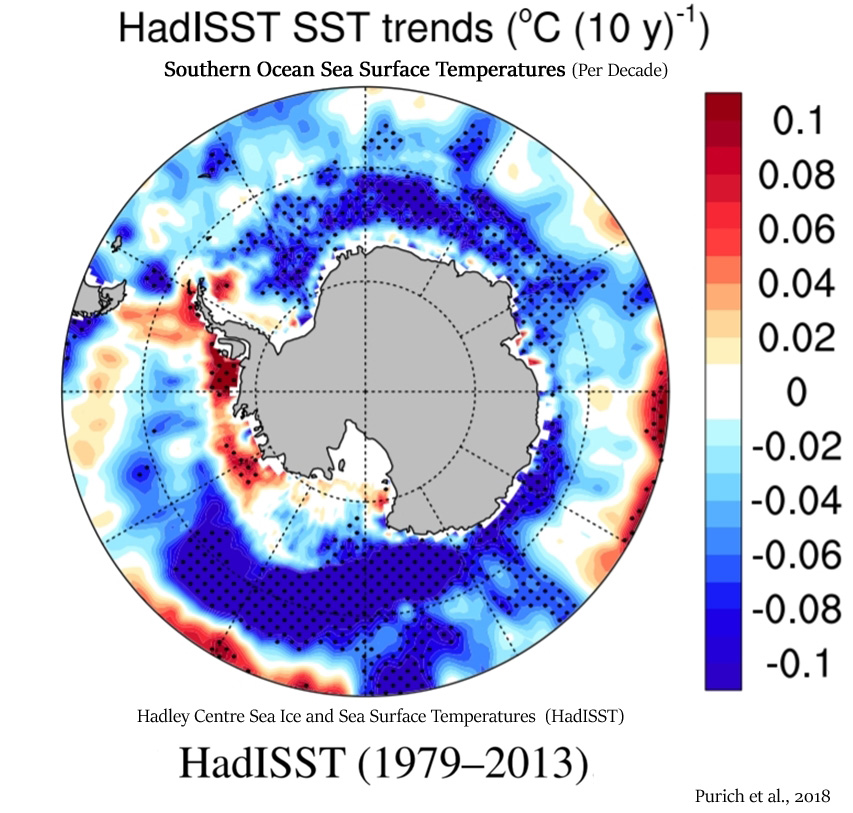
Image Source: Purich et al., 2018
The decline in Southern Ocean temperatures has coincided with an increase in Antarctic sea extent since 1979.
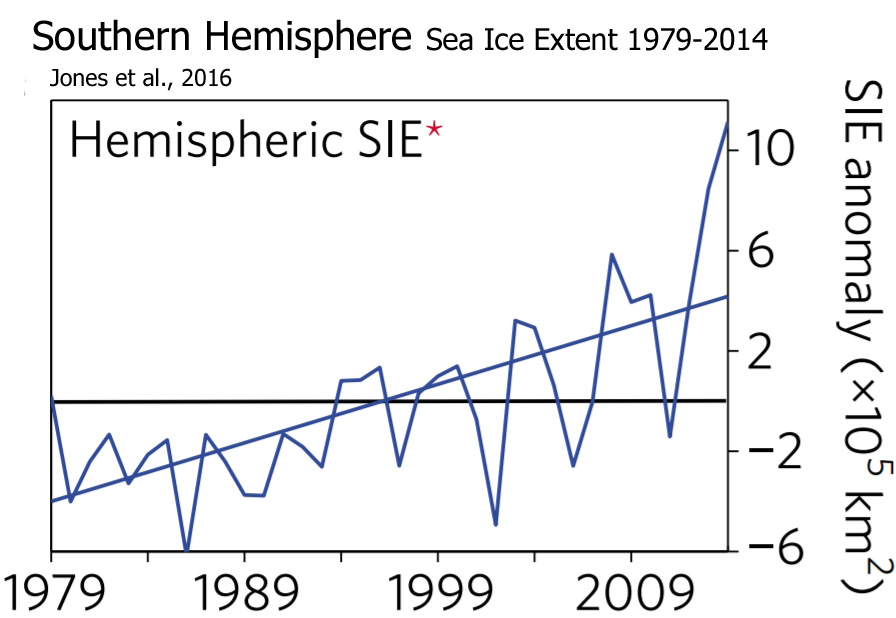
Image Source: Jones et al., 2016
Comiso et al., 2017 “The Antarctic sea ice extent has been slowly increasing contrary to expected trends due to global warming and results from coupled climate models. After a record high extent in 2012 the extent was even higher in 2014 when the magnitude exceeded 20 × 106 km2 for the first time during the satellite era. … [T]he trend in sea ice cover is strongly influenced by the trend in surface temperature [cooling].”
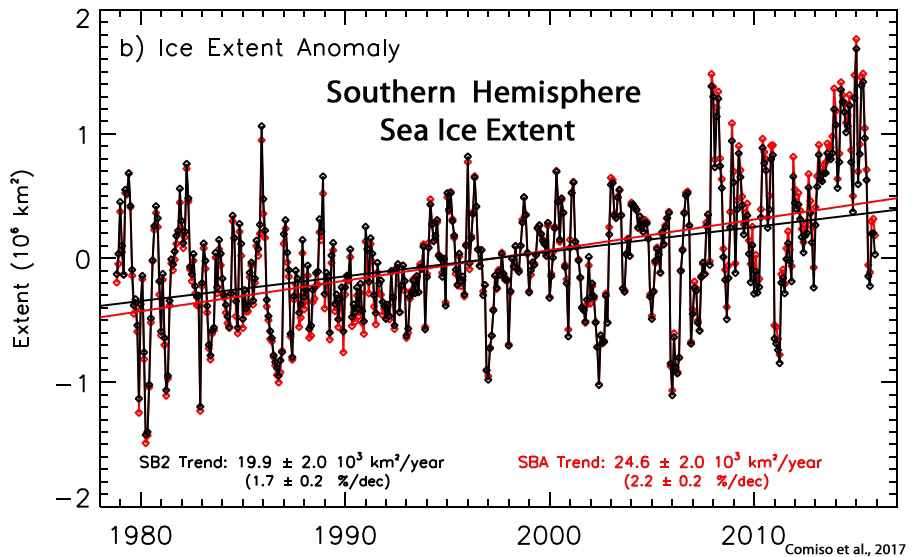
Image Source: Comiso et al., 2017
In contrast to the post-1970s cooling and sea ice advance, Antarctica warmed and sea ice declined during the 1950s to 1980s.
Antarctica warming rapidly, 1950s-1980s
IPCC (2001): “Another analysis of a 21-station data set from Antarctica by Comiso (1999) found a warming trend equivalent to 1.25°C per century for a 45-year record beginning in the 1950s but a slight cooling trend from 1979 to 1998. The slight cooling trend for this later 20-year period also was confirmed via analysis of surface temperatures over the whole continent, as inferred from satellite data.”
Fan et al., 2014: “[S]ea surface temperatures and surface air temperatures decreased during 1979–2011, consistent with the expansion of Antarctic sea ice. In contrast, the Southern Ocean and coastal Antarctica warmed during 1950–1978.”
Declining Antarctic sea ice concentrations, 1950s-1980s
Sinclair et al., 2014 “We present the first proxy record of sea-ice area (SIA) in the Ross Sea, Antarctica, from a 130 year coastal ice-core record. High-resolution deuterium excess data show prevailing stable SIA [sea ice area] from the 1880s until the 1950s, a 2–5% reduction from the mid-1950s to the early-1990s, and a 5% increase after 1993.”
Miles et al., 2013 “Despite large fluctuations between glaciers—linked to their size—three epochal patterns emerged: 63 per cent of glaciers retreated from 1974 to 1990, 72 per cent advanced from 1990 to 2000, and 58 per cent advanced from 2000 to 2010. … Indeed, several studies report increasing sea-ice concentrations in the study region from approximately 1980 to 2010, which is consistent with the predominance of glacier advance since 1990, when above-average sea-ice and fast-ice concentrations could have suppressed calving by increasing back-pressure on glacier termini. In contrast, reduced sea ice concentrations from the 1950s to the mid 1970s are consistent with glacier retreat during the 1960s and 1970s, when air temperatures were also increasing along the Pacific coast.”
Antarctic sea ice conditions were similar to today’s during 1897-1917.
Edinburgh and Day, 2016 “In stark contrast to the sharp decline in Arctic sea ice, there has been a steady increase in ice extent around Antarctica during the last three decades, especially in the Weddell and Ross seas. In general, climate models do not to capture this trend … This comparison shows that the summer sea ice edge was between 1.0 and 1.7° further north in the Weddell Sea during this period but that ice conditions were surprisingly comparable to the present day [during 1897-1917] in other sectors.”
(press release) “We know that sea ice in the Antarctic has increased slightly over the past 30 years, since satellite observations began. Scientists have been grappling to understand this trend in the context of global warming, but these new findings suggest it may not be anything new. … The new study published in The Cryosphere is the first to shed light on sea ice extent in the period prior to the 1930s, and suggests the [sea ice] levels in the early 1900s were in fact similar to today“
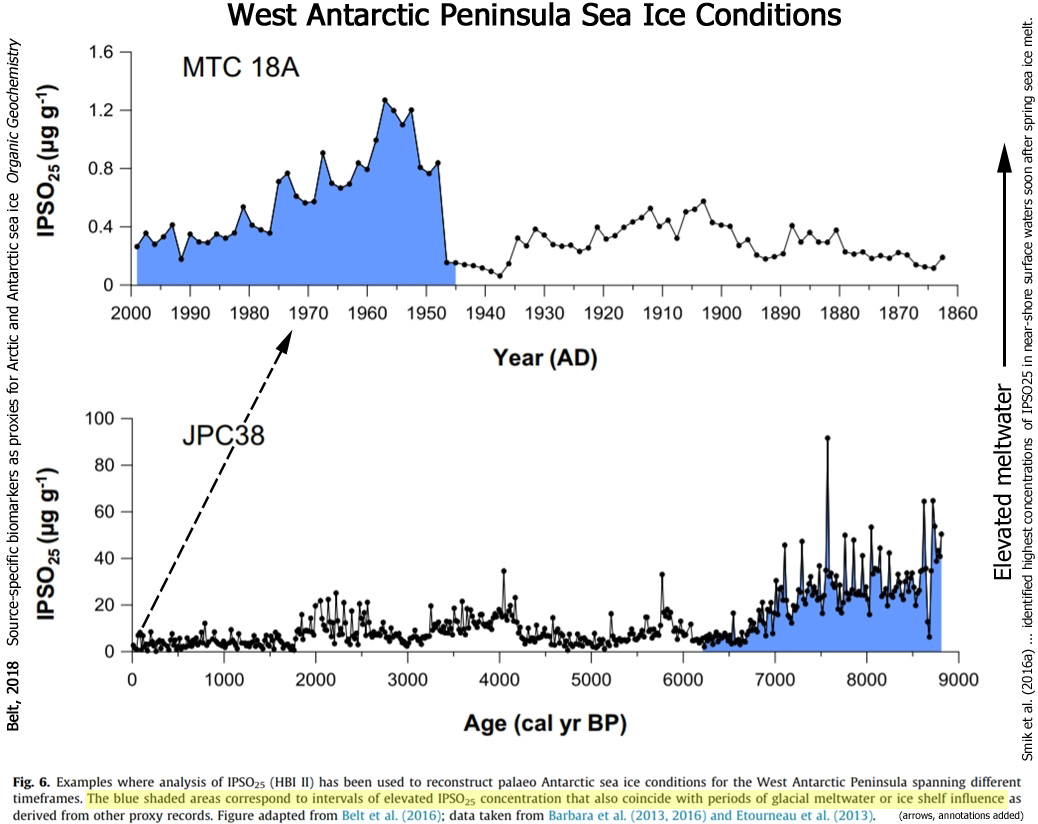
New paper finds Antarctic (Peninsula) sea ice more extensive today than possibly any time in the last 10,000 years.
Belt, 2018 “Exceptionally, Massé et al. (2011) observed a general decline in sedimentary IPSO25 concentration in a short offshore transect from East Antarctica; a trend shown subsequently to be quite general for various other Antarctic regions (Belt et al., 2016). In the latter study, it was suggested that the origin of this trend might be found in the preferred habitat of the known source of IPSO25 (B. adeliensis), which has a tendency to proliferate in platelet ice, found most commonly in near-shore locations covered by fast ice (Medlin, 1990). As such, it was hypothesised that higher concentrations of IPSO25 might be found in locations proximal to ice shelves, since their basal melt acts as the major driver for platelet ice formation (Jefferies et al., 1993). Re-examination of some palaeo sea ice records based on IPSO25 added further credibility to this suggestion (Fig. 6), and Smik et al. (2016a) also identified highest concentrations of IPSO25 in near-shore surface waters soon after spring sea ice melt.”
Arctic Sea Ice Extent
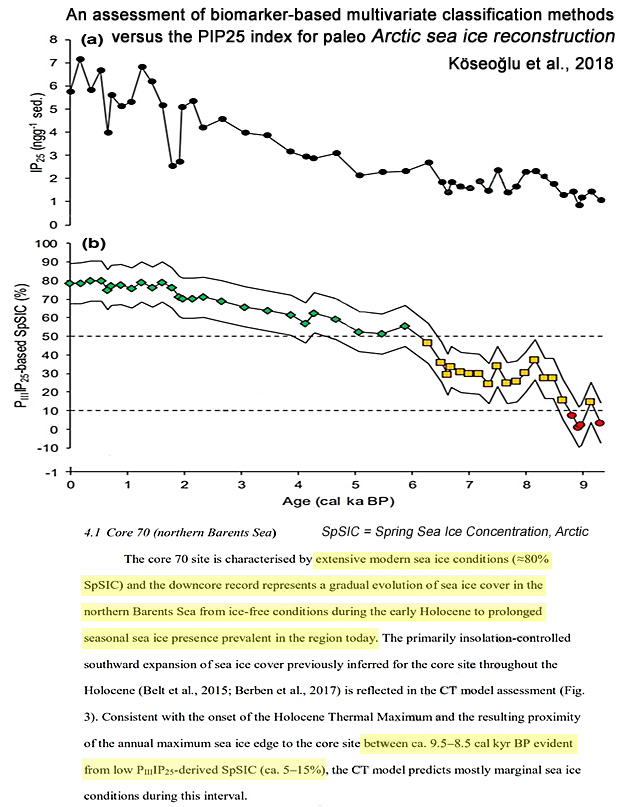
“Extensive modern sea ice conditions” during spring (80% concentrations), but “consistently low” and “marginal” (<10%) sea ice conditions from 10,500 to 1,500 years before present.
Köseoğlu et al., 2018 “The core 70 site is characterised by extensive modern sea ice conditions (≈80% SpSIC [Spring Sea Ice Concentration]) and the downcore record represents a gradual evolution of sea ice cover in the northern Barents Sea from ice-free conditions during the early Holocene to prolonged seasonal sea ice presence prevalent in the region today. The primarily insolation-controlled southward expansion of sea ice cover previously inferred for the core site throughout the Holocene (Belt et al., 2015; Berben et al., 2017) is reflected in the CT model assessment. Consistent with the onset of the Holocene Thermal Maximum and the resulting proximity of the annual maximum sea ice edge to the core site between ca. 9.5–8.5 cal kyr BP evident from low PIIIIP25-derived SpSIC (ca. 5–15%), the CT model predicts mostly marginal sea ice conditions during this interval. … From ca. 10.0–1.5 cal kyr BP, ice-free conditions characterised the core 11 site, as evidenced by consistently low SpSIC (ca. <10%) and marginal sea ice conditions predicted by the CT model, and further supported by an enhancement of AW [Arctic Water] inflow to the core site from ca. 9.8 cal kyr BP (Groot et al., 2014).”
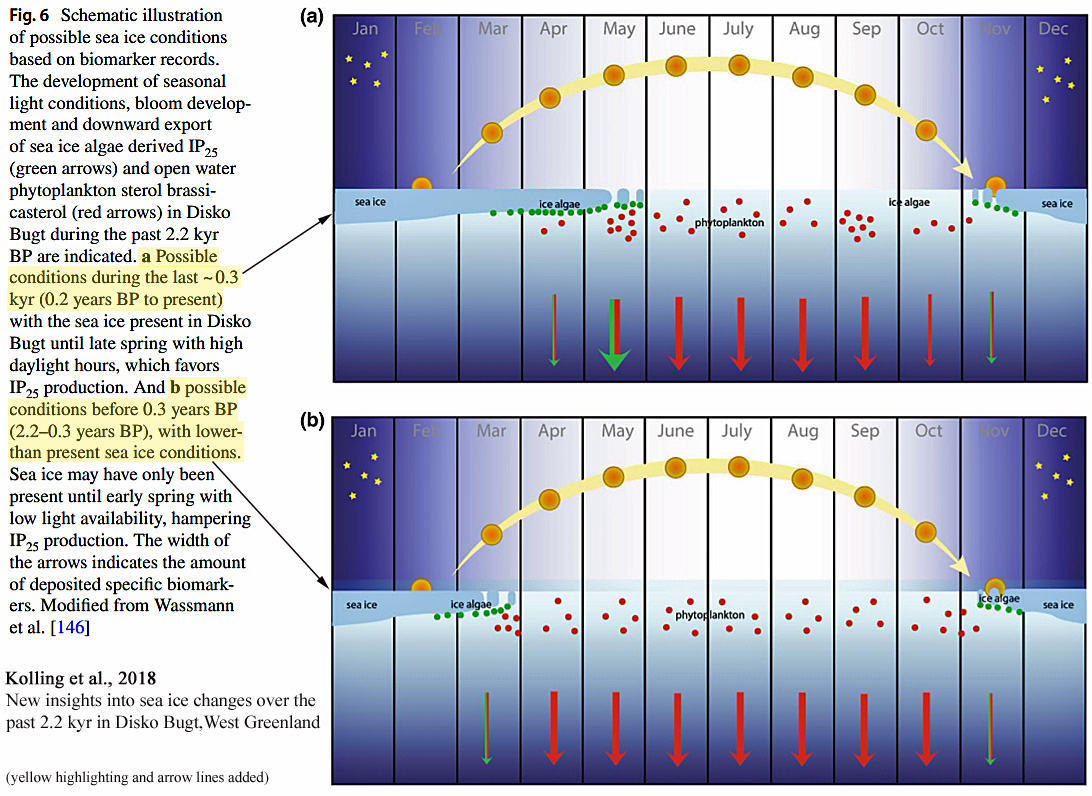
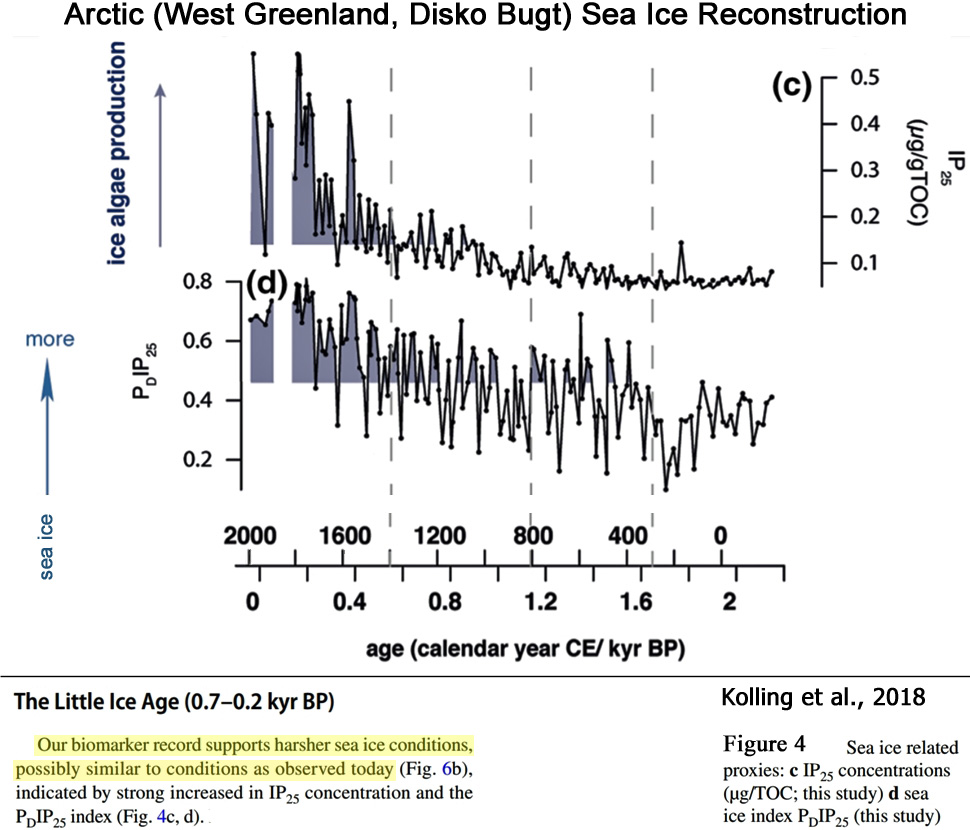
“Lower than modern” sea ice conditions between 2,200 and 1,200 years before present. Little Ice Age sea ice conditions “possible similar to conditions as observed today”.
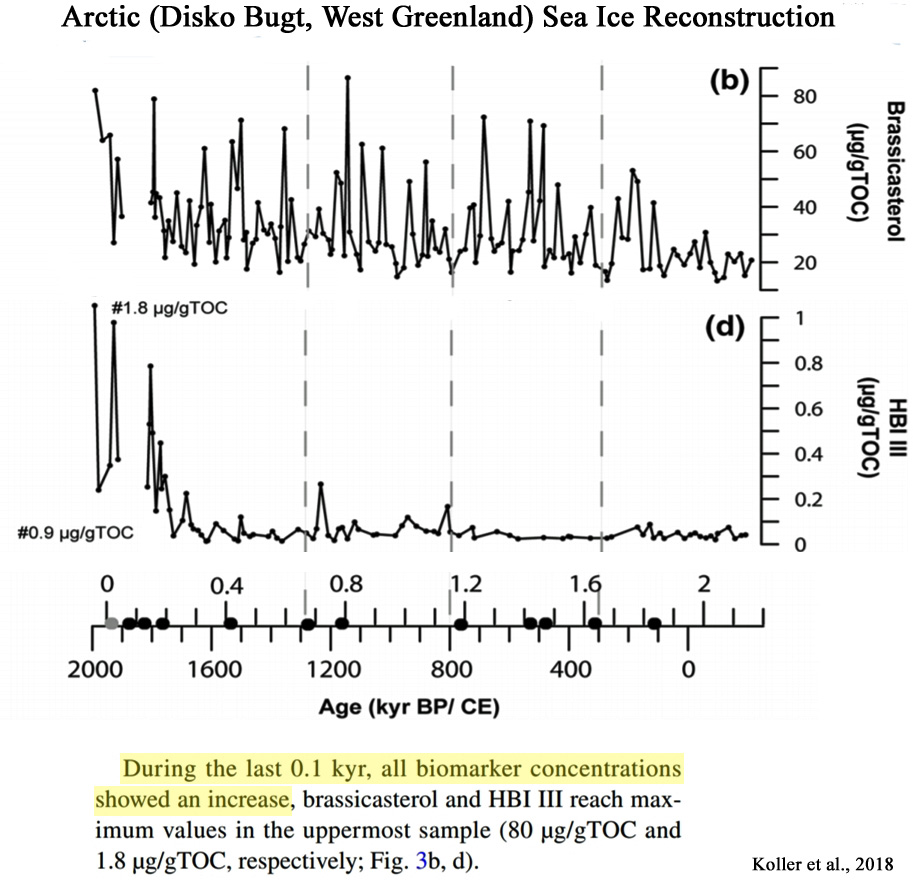
Kolling et al., 2018 “Our biomarker record indicates that Disko Bugt [West Greenland] experienced a gradual expansion of seasonal sea ice during the last 2.2 kyr. Maximum sea ice extent was reached during the Little Ice Age around 0.2 kyr BP. Superimposed on this longer term trend, we find short-term oscillations in open water primary production and terrigenous input, which may be related to the Atlantic Multidecadal Oscillation and solar activity changes as potential climatic trigger mechanisms. The period between 2.2 and 1.2 kyr BP, with lower than modern sea ice conditions in Disko Bugt (Fig. 6b), coincides with generally warm conditions over the Greenland Ice Sheet.”
“During the last 0.1 kyr, all biomarker concentrations showed an increase, brassicasterol and HBI III reach maximum values in the uppermost sample (80 µg/gTOC and 1.8 µg/gTOC, respectively; Fig. 3b, d).
“[During the Little Ice Age (0.7–0.2 kyr BP)] our biomarker record supports harsher sea ice conditions, possibly similar to conditions as observed today (Fig. 6b), indicated by strong increased in IP25 concentration and the PDIP25 index (Fig. 4c, d). … A self-amplifying system may have caused the environmental changes observed in Disko Bugt area as follows: solar triggered Arctic sea ice melt [Ruzmaikin et al., 2004] increases freshwater supply towards the North Atlantic causing a reduction in sub-polar gyre activity and AMO [Holland et al., 2001, Schmith et al., 2003] as described by Sha et al. [2016]. This may in turn cause distinct changes in WGC composition and meltwater supply from the Greenland Ice Sheet that affects phytoplankton blooms in West Greenland.
“We find that the Disko Bugt area was influenced by seasonal sea ice over the last 2.2 kyr BP. The overall sea ice trend indicates a development from a reduced sea ice cover during early spring, with sea ice algae productivity hampered by light availability to a gradual extend of the sea ice season from 1.2 kyr BP onwards. This change in sea ice extend is parallel to decreasing Northern Hemisphere atmospheric temperatures and culminates in the Little Ice Age around 0.2 kyr. We assume that modern conditions, with sea ice present until late spring and the presence of a stable ice edge at Disko Bugt, established around that time [~200 years ago].”
Other Arctic reconstructions indicate more extensive sea ice conditions exist today than most of the Holocene.
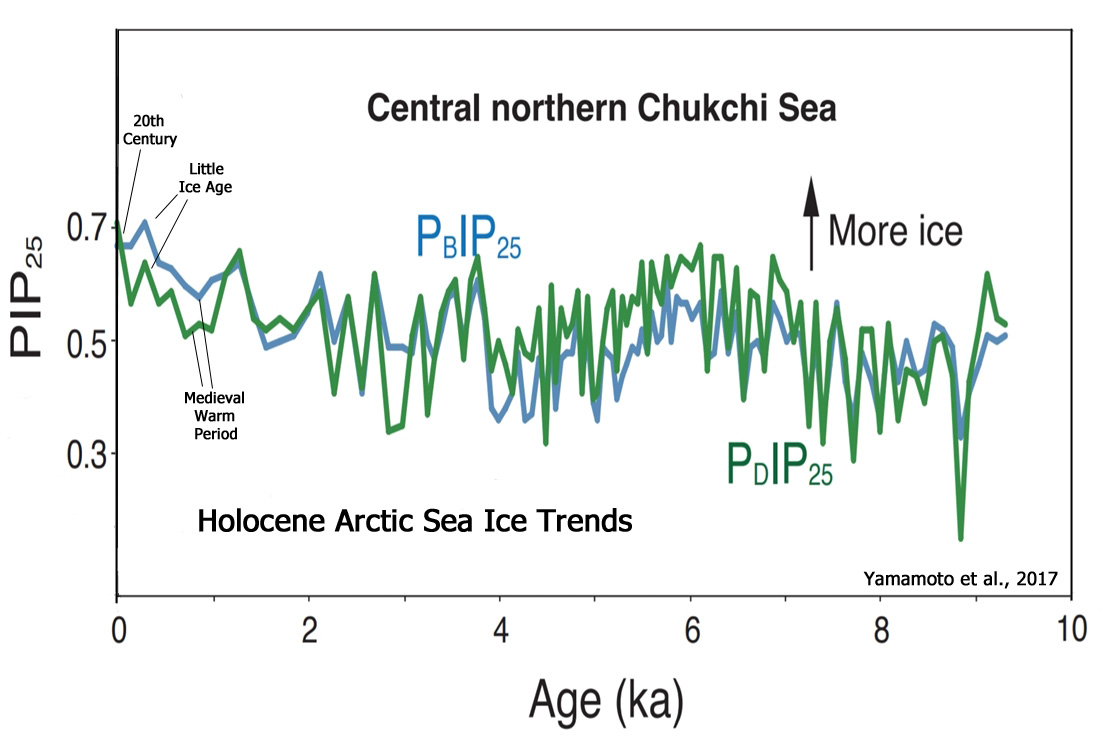
Image Source: Yamamoto et al., 2017
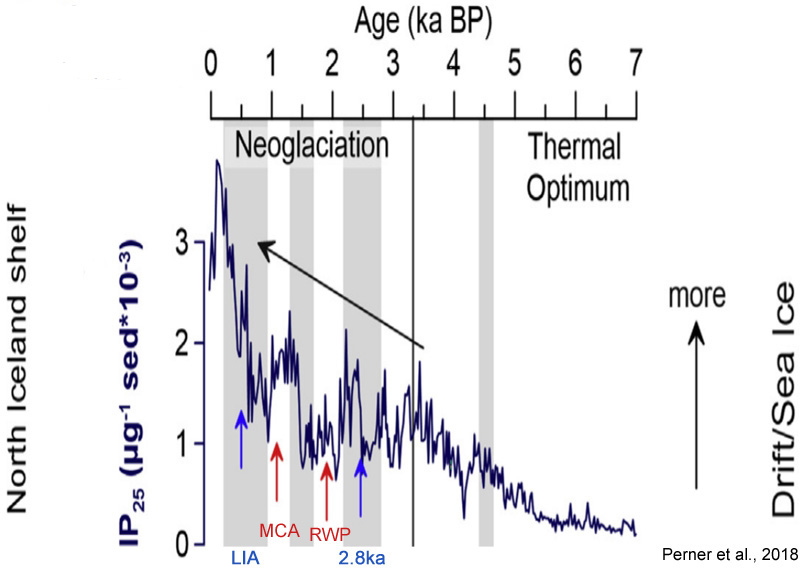
Image Source: Perner et al., 2018
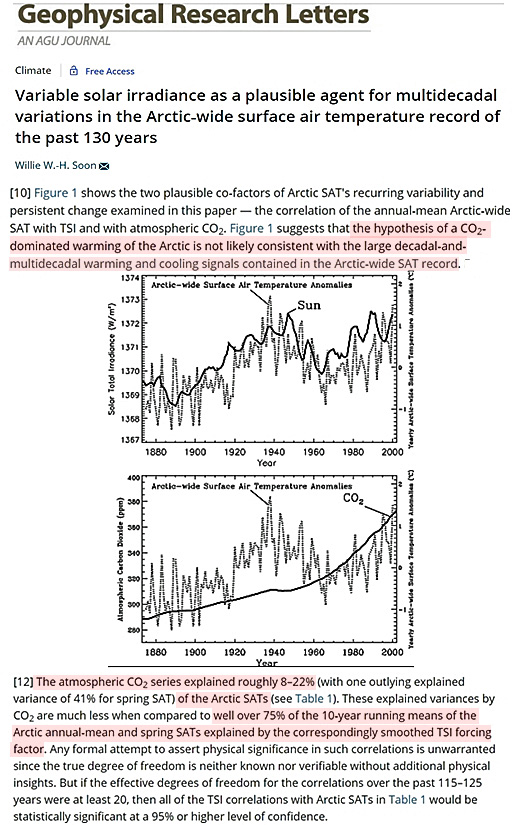
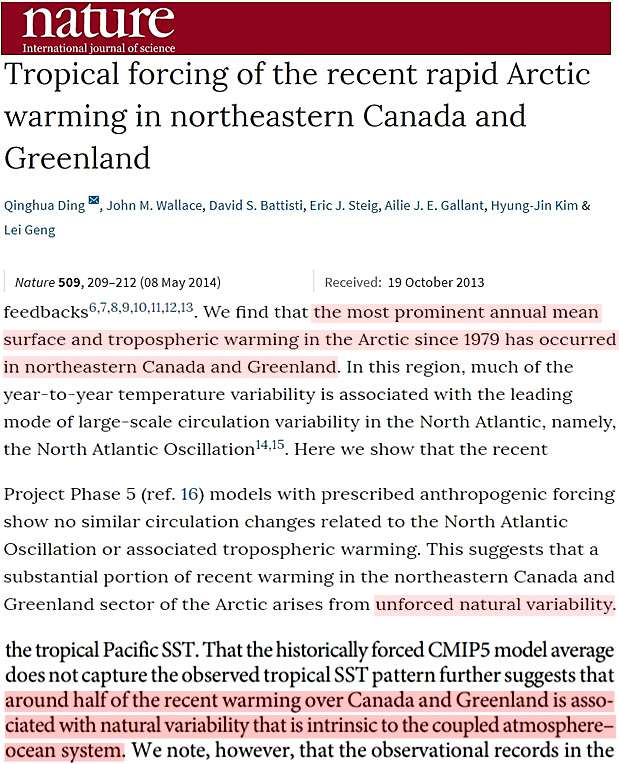
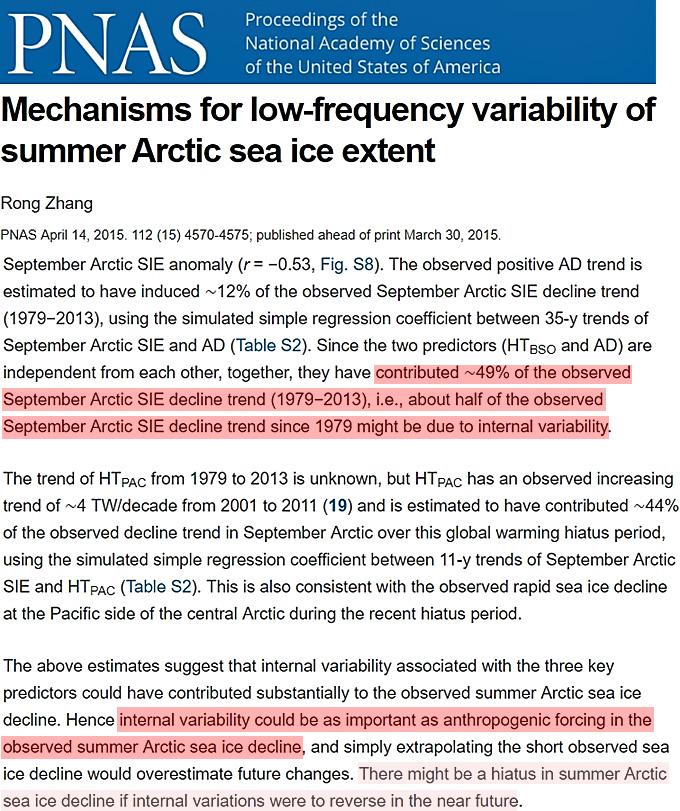
Nothing unusual or unprecedented: ‘Internal variability’ or natural cycles responsible for half of the Arctic sea ice loss since 1979.
Yu and Zhong, 2018 “The underlying physical mechanisms for the Arctic warming and accelerated sea ice retreat are not fully understood. In this study, we apply a relatively novel statistical method called Self-Organizing Maps (SOM) to examine the trend and variability of autumn Arctic sea ice in the past three decades and their relationships to large-scale atmospheric circulation changes. Our results show that the anomalous autumn the Arctic Dipole (AD) (Node 1) and the Arctic Oscillation (AO) (Node 9) could explain in a statistical sense as much as 50% of autumn sea ice decline between 1979 and 2016. The Arctic atmospheric circulation anomalies associated with anomalous sea surface temperature patterns over the North Pacific and North Atlantic influence Arctic sea ice primarily through anomalous temperature and water vapour advection and associated radiative feedback. … We investigate the potential mechanisms for the autumn arctic sea ice decline for the period 1979-2016 using the SOM method. Our results show that more than half of the autumn Arctic sea ice loss may be associated with the changes in the temperature and water vapour transport and the associated water vapour radiation feedback resulting from anomalous atmospheric circulations linked to SST anomalies over the North Pacific and North Atlantic. … [T]he results here help advance the knowledge about the relatively large contributions from the decadal-scale natural climate variability to Arctic climate change…”
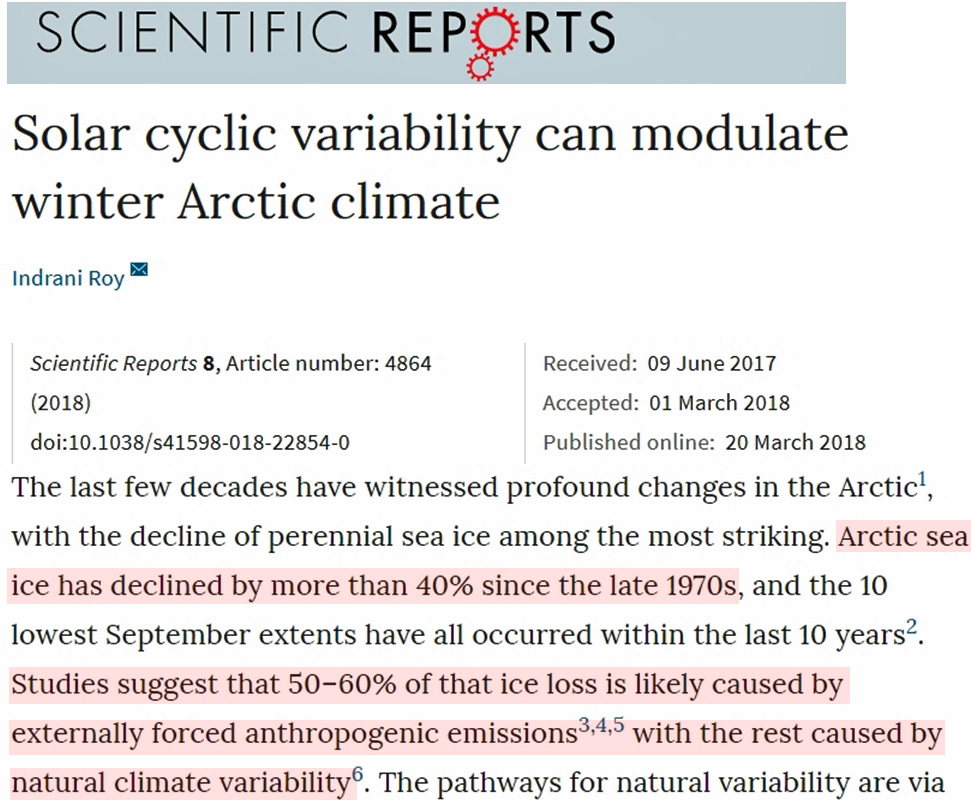
Image: https://www.nature.com/articles/s41598-018-22854-0
Image: http://www.nature.com/nature/journal/v509/n7499/full/nature13260.htm
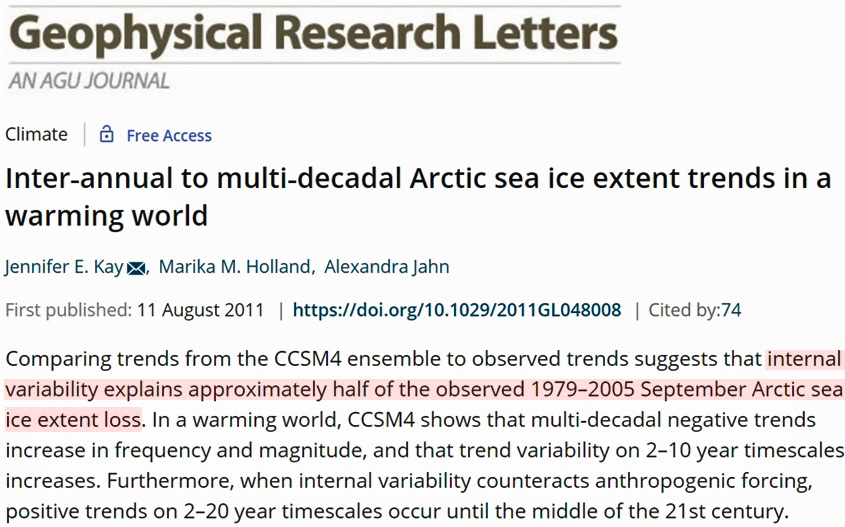
Image: https://agupubs.onlinelibrary.wiley.com/doi/abs/10.1029/2011GL048008
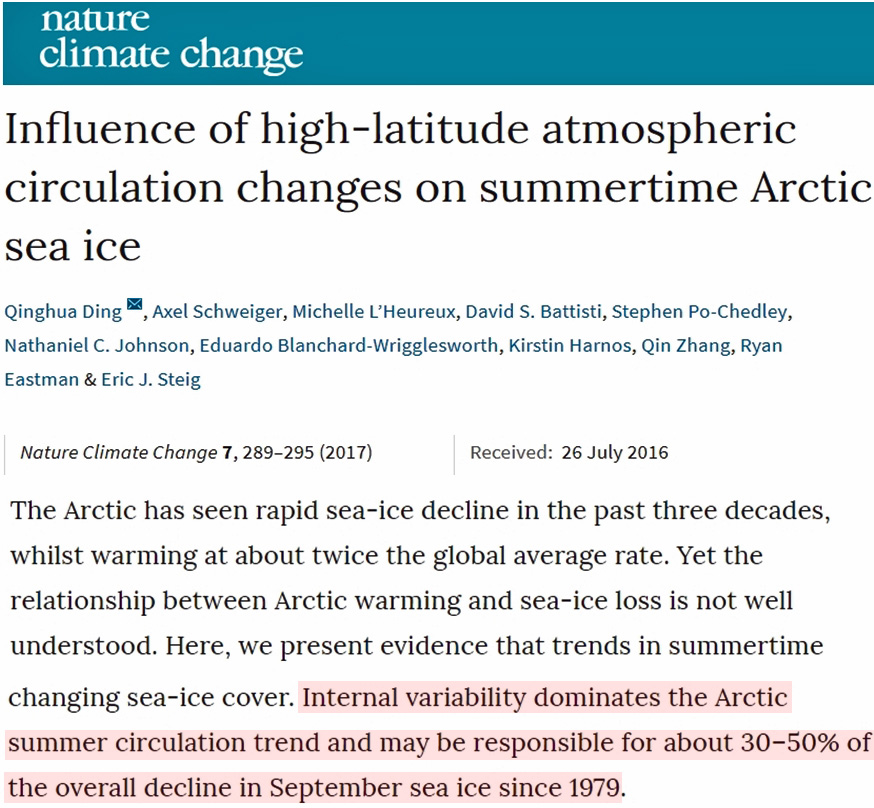
Image: https://www.nature.com/articles/nclimate3241
Image: http://www.pnas.org/content/112/15/4570.full


October 13, 2017 (just over a year ago)
“… THOUSANDS of Penguin Chicks Are Starving in Antarctica – TOO
LITTLEMUCH ICE.”https://www.thegatewaypundit.com/2017/10/brrr-thousands-penguin-chicks-starving-antarctica-much-ice/
NOTE – Before some troll complains about the source, they were just reporting what was available elsewhere.
https://www.yahoo.com/news/thousands-penguin-chicks-starve-antarctica-043725803.html
Well Kenneth, since you claim that the sea ice extent in the Arctic is stable since 2007 … let me ask you why you think the sea ice extent in Antarctica is increasing? When in fact it is now well below the 1980 values and sharply declining since 2007?
http://woodfortrees.org/plot/nsidc-seaice-s/from:1979/compress:12/plot/nsidc-seaice-s/from:2007/trend
https://nsidc.org/data/seaice_index/images/s_plot_hires.png
Why do the graphs presented here conveniently stop right before the massive decline in sea ice extent? And do you somehow recognize now why you claim of Arctic ice stability is wrong?
That’s not just my “claim”, it’s what scientists say:
Swart et al., 2015
“Arctic sea-ice extent was lost at a considerably higher rate from 2001–2007 than in the preceding decades (Fig. 1), which caught the attention of scientists and the public alike. In contrast, from 2007–2013 there was a near-zero trend in observed Arctic September sea-ice extent, in large part due to a strong uptick of the ice-pack in 2013, which has continued into 2014. By deliberately cherry-picking these periods we will demonstrate how using short-term trends can be misleading about longer-term changes, when such trends show either rapid or slow ice loss.”
And the more recent data indicates the hiatus in Arctic sea ice losses that began in 2007 identified by Swart et al. (2015) has extended through 2017:
https://notrickszone.com/wp-content/uploads/2018/04/Arctic-Sea-Ice-Pause-2007-2017.jpg
If we look at the 2007 to 2017 sea ice trends in Antarctica, we see that the last 10 years tilt slightly more upward than the overall increasing trend since 1979:
http://woodfortrees.org/plot/nsidc-seaice-s/from:1979/to/plot/nsidc-seaice-s/from:1979/to/plot/nsidc-seaice-s/from:2007/to:2017/trend/plot/nsidc-seaice-s/from:1979/to:2017/trend
If we look at the 1979 to 2018 trend versus the 2007 to 2018 trend, we see that the upward trends are identical, or in sync:
http://woodfortrees.org/plot/nsidc-seaice-s/from:1979/to/plot/nsidc-seaice-s/from:1979/to/plot/nsidc-seaice-s/from:2007/to:2018/trend/plot/nsidc-seaice-s/from:1979/to:2018/trend
The “massive decline in sea ice extent” between 2015-2018 was balanced out by the massive increase in sea ice extent during 2012-2015, with 16 first place monthly records for sea ice growth during that span.
So why do you think the sea ice extent around Antarctica has been increasing overall for the last (nearly) 40 years? What was the mechanism causing this increase considering CO2 concentrations have risen by about 70 ppm since 1979?
And why do you think it is that Arctic sea ice is more extensive now than just about any other period in the last 10,000 years? What’s the mechanism for this overall long-term increase in Arctic sea ice extent? This is the central point of the article. Care to address this question?
Fantastic reply, Kenneth. I could not have hoped for more 😉
Let’s turn that around, shall we? Same graph, but for the Arctic ice extent:
http://woodfortrees.org/plot/nsidc-seaice-n/from:1979/to/plot/nsidc-seaice-n/from:1979/to/plot/nsidc-seaice-n/from:2007/to:2017/trend/plot/nsidc-seaice-n/from:1979/to:2017/trend
What do you see? Well, besides 1.5 years missing between the end of those trend lines and today. Does it look similar? The 10-year trendline is declining somewhat faster than the overall trendline.
Again, let’s look at the same graph for the Arctic:
http://woodfortrees.org/plot/nsidc-seaice-n/from:1979/to/plot/nsidc-seaice-n/from:1979/to/plot/nsidc-seaice-n/from:2007/to:2018/trend/plot/nsidc-seaice-n/from:1979/to:2018/trend
It’s in sync.
I’d put it the other way around. The decline balanced out nearly all the increase since 1980. Antarctic sea ice extent is now lower than at any time since the 1980s: http://woodfortrees.org/plot/nsidc-seaice-s/from:1979/compress:12/plot/nsidc-seaice-s/from:2007/trend
The trend begins going downwards when beginning in 2007. Very similar to what you (and scientists named Swart) are claiming what is happening in the Arctic. A weird mind gymnastics move that now thankfully blows up in your face since you no doubt must realize that it is nonsense to say the Arctic is on a hiatus as well as it is nonsense to say Antarctica is on a hiatus/decline 🙂
I know where you are trying to get at with this, but I’ll refuse to play this time. I don’t know how many times I had to write that the distribution of the increased heat content happens not uniformly. So yeah, places can even cool despite increased overall heat content.
No, I don’t care. You guys can discuss this scientifically amongst yourselves. Bitter&twisted seems to have started posting high quality comments already.
The goal of this comment was to expose the problem with your thinking about how Arctic sea ice extent develops compared to Antarctica. You aren’t looking at both with the same pair of goggles. You see what you want to see and not what the data presents. I hope you got that now.
And the overall trend? Antarctic sea ice has been increasing since the 1970s, which is to be expected since the Southern Ocean has been cooling (after it warmed during the 1950s to 1980s). The climate models got it wrong again. They had Antarctic sea ice growing as the Southern Ocean warmed.
Together, we have opposite 40-year trends: the Arctic has been declining as the Antarctic has been increasing:
http://woodfortrees.org/plot/nsidc-seaice-s/from:1979/to:2018/plot/nsidc-seaice-n/from:1979/to:2018/plot/nsidc-seaice-n/from:1979/to:2018/trend/plot/nsidc-seaice-s/from:1979/to:2018/trend
Of course, none of this is consistent with what the models said would happen, as they are predicated on the assumption that CO2 concentration changes drive sea ice changes.
As this article shows, however, if CO2 drives sea ice changes, the observed correlation is the opposite of what you believe: CO2 increases as sea ice extent increases.
Arctic sea ice is no less extensive now than it was during the 280 ppm Little Ice Age (!) according to the scientists publishing these new papers.
And to top it off, more and more scientists are wholly disagreeing with your belief that 100% of the changes in Arctic sea ice have been driven by anthropogenic CO2 emissions. They insist that nature contributes 50% to the warming/sea ice decline. You can’t even get scientists to agree with your beliefs about the 100% attribution!
Your belief system is falling apart, SebastianH. And what do you say about that?
Pathetic. And you consider yourself a skeptic? You don’t have even the least bit of curiosity as to why (mechanism?) Arctic sea ice was far less extensive (i.e., the Arctic was ice free in the spring!) when CO2 concentrations were in the 260 ppm range?
If that was the goal, then you failed miserably. All you’ve done is expose the vacuousness of your belief that 100% of the decline in Arctic sea ice is due to anthropogenic CO2 emissions.
Previous reply got deleted? Well … repost then?
That is exactly my point. The overall trend, Kenneth! Look at the Arctic and tell me the overall trend. If you truely believe there is a hiatus [-snip, you’re trolling -PG]
The overall trend is actually that both Arctic and Antarctic sea ice extent are higher today than nearly all of the last 10,000 years…even though CO2 is much higher today. But, of course, you don’t care to address that because it doesn’t fit the narrative.
The point about the trend since 2007 stabilizing in the Arctic is this: oscillating patterns of hemispheric sea ice extent growth or decline are in the process of switching. In about 10 years, the AMO (and Arctic Oscillation) will be in cooling mode (similar to the 1950s to 1970s) and Arctic sea ice will grow; the flattened plateau in the declining trend since 2007 is indication that the cycles are about to change. Similarly, the Antarctic sea ice follow natural cycling (i.e., the SAM), and thus within about 10 years the Antarctic’s sea ice will begin declining again (like it did during the 1950s to 1980s). The decline that began in the middle of 2015 is an indication the SH is about to switch. The 2016/17 Antarctic sea ice low is a natural development associated with the SAM. But you go right on ahead and keep believing it’s 100% caused by anthropogenic CO2 anyway.
Neither of these oscillating patterns suggest a correlation with a linear increase in atmospheric CO2, of course. That’s why it’s become the “consensus” that the influence on even the Arctic sea ice decline is only partly anthropogenic, not 100% as you believe.
Um, aren’t you the one who has claimed that the only radiative energy source increasing since the 1950s is the CO2, and therefore because the CO2 has increased and the heat accumulation has increased, therefore the CO2 is the 100% cause of the heat increase? How is this not correlation = causation?
Of course none of the above will matter a jot to our mentally challenged troll.
Do not engage, or even try and humour the Russian Troll.
DNCWTRT.
“I’m a geologist. I know the Earth is not nearly as fragile as we tend to think it is. It has gone through climate change, it is going through climate change at the present time. The only question is, is there any evidence that human beings are causing that change? Right now, in my profession, there is no evidence.” “ – Harrison Schmidt, PhD Geologist, Astronaut (one of the few who’ve walked on the moon)
http://www.climatedepot.com/2018/10/17/apollo-17-moonwalker-dr-harrison-schmitt-rejects-un-climate-report-the-observations-that-we-make-as-geologists-do-not-show-any-evidence-that-human-beings-are-causing-this/
On the other hand, anonymous ethically and mentally
challengedimpaired nuisance trolls claim the opposite.Who should we believe?
hahahahahahaha, riiiiiiight.
On the other side is the whole field of climate science. I am not the other side, Yonason. I am just a guy posting on a blog conversing with other non-experts about how expertly they seem to know that we are all being the victims of a fraud.
97% of climate scientists agree that natural variability is constrained to the range of values we have recorded in the last 150 years.
[…] K. Richard, October 18, 208 in […]
[…] https://notrickszone.com/2018/10/18/new-science-arctic-and-antarctic-sea-ice-more-extensive-today-tha… […]
[…] New Science: Arctic AND Antarctic Sea Ice More Extensive Today Than Nearly All Of The Last 10,000 Ye…. By Kenneth Richard on 18. October 2018 It is often claimed that modern day sea ice changes are “unprecedented”, alarming, and well outside the range of natural variability. Yet scientists are increasingly finding that biomarker proxies used to reconstruct both Arctic and Antarctic sea ice conditions since the Early Holocene reveal that today’s sea ice changes are not only not unusual, there is more extensive Arctic and Antarctic sea ice during recent decades than there has been for nearly all of the last 10,000 years. Antarctic Sea Ice Extent In the Southern Ocean surrounding Antarctica, the sea surface temperatures have been cooling since 1979. […]
[…] paleoclimate evidence, which shows that sea ice was thinner and less extensive than today for most of the last 10,000 years, also contradicts the assumptions about modern polar bear […]
[…] paleoclimate evidence, which shows that sea ice was thinner and less extensive than today for most of the last 10,000 years, also contradicts the assumptions about modern polar bear […]
[…] Read more at notrickszone.com […]