Modern Climate Warming Is Not
Dangerous, Unprecedented, Globally Pervasive
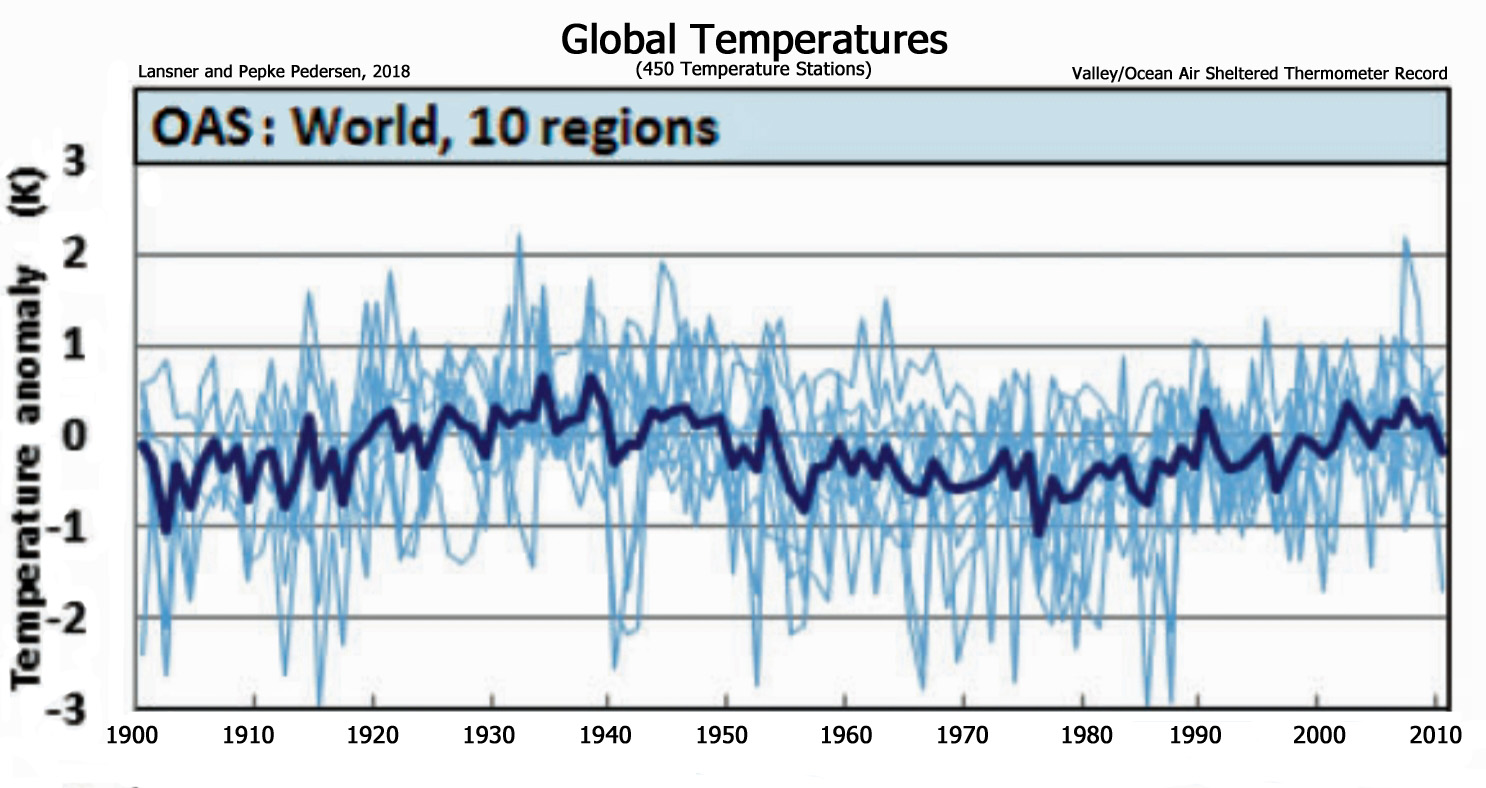
Image Source: Lansner and Pepke Pedersen, 2018
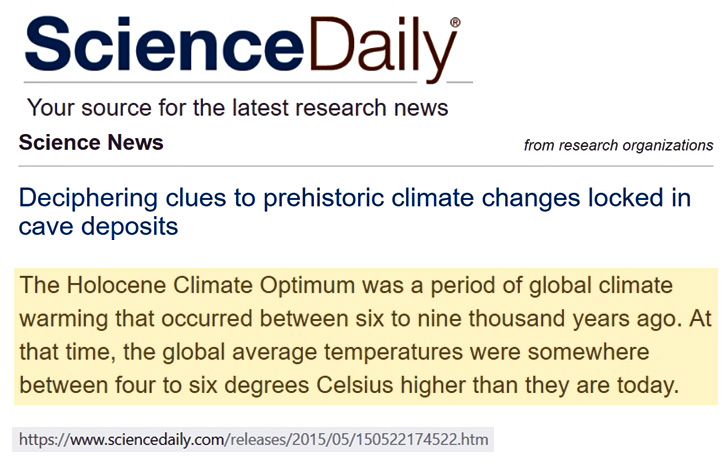
Image Source: ScienceDaily.com
The Hockey Stick Fails
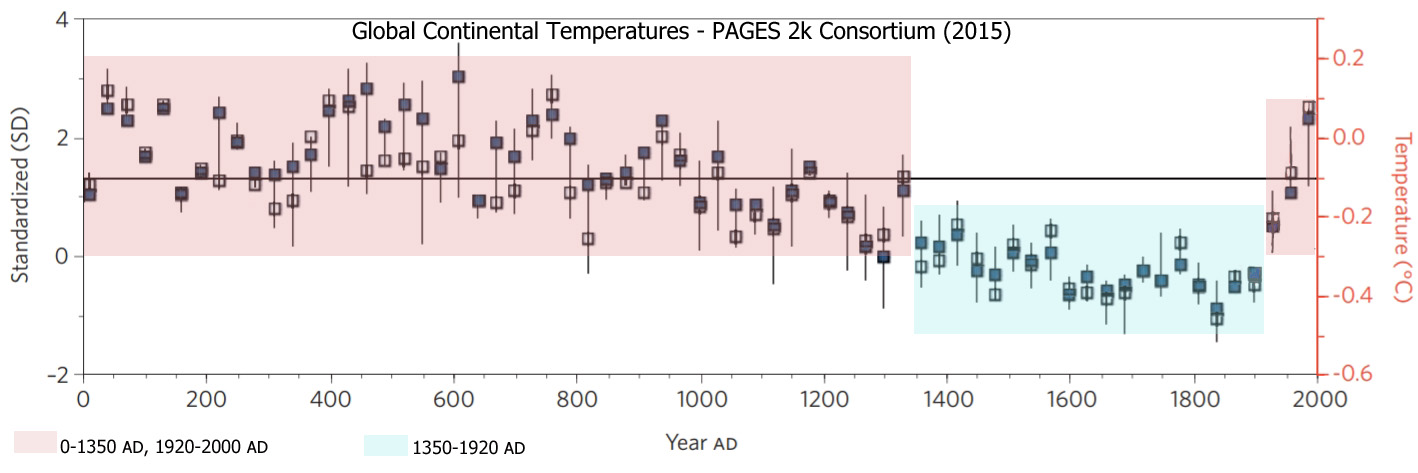
The PAGES 2k Consortium (2013) attempted to compile an unprecedented-looking hockey-stick-shaped Holocene reconstruction. Instead, it has withered under scrutiny.
Analysis of the PAGES 2k data clearly shows that 20th century warmth is merely a partial return to the normal temperatures that characterized most of the Late Holocene. The only aspect of the last two millennia that is climatically anomalous may be the centuries of Little Ice Age cooling.
A valiant effort by Marcott et al. (2013) to recast 73 previously-published non-hockey stick Holocene reconstructions as supporting an unprecedented 20th century “uptick” was debunked by Marcott’s own 2011 doctoral thesis.
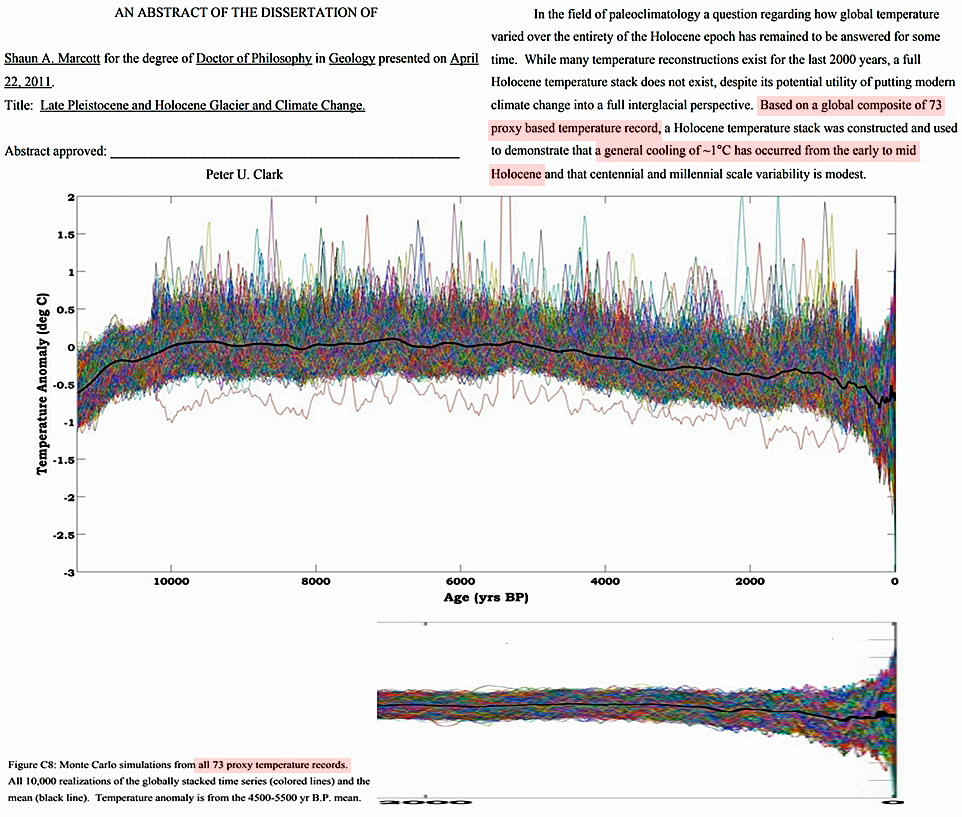
The non-statistically robust and non-globally representative temperature graph concocted by Marcott and colleagues also does not stand up to even the most rudimentary peer analysis.
Not only that, but they were long ago exposed for having substituted their own dates rather than using published results.
The Explosive Growth of the Non-Hockey Stick
In the last 25 months, 265 peer-reviewed scientific papers have been published containing documented evidence (i.e., graphs primarily) that undermine the popularized conception of a slowly-cooling Earth followed by a dramatic hockey-stick-shaped recent uptick, or an especially unusual global-scale warming during modern times.
253 Non-Global Warming Papers (2017 & 2018)
Indeed, some regions of the Earth have been warming in recent decades or at some point in the last 150 years. Some regions have been cooling for decades at a time.
And many regions have shown no significant net changes or trends in either direction relative to the last few decades to hundreds to thousands of years.
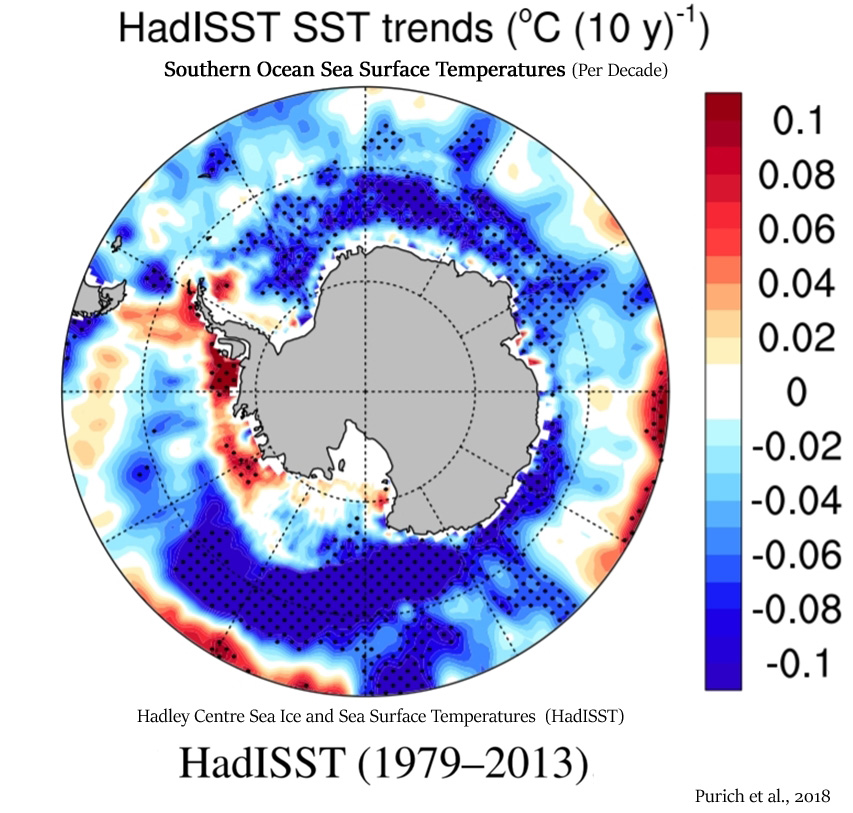
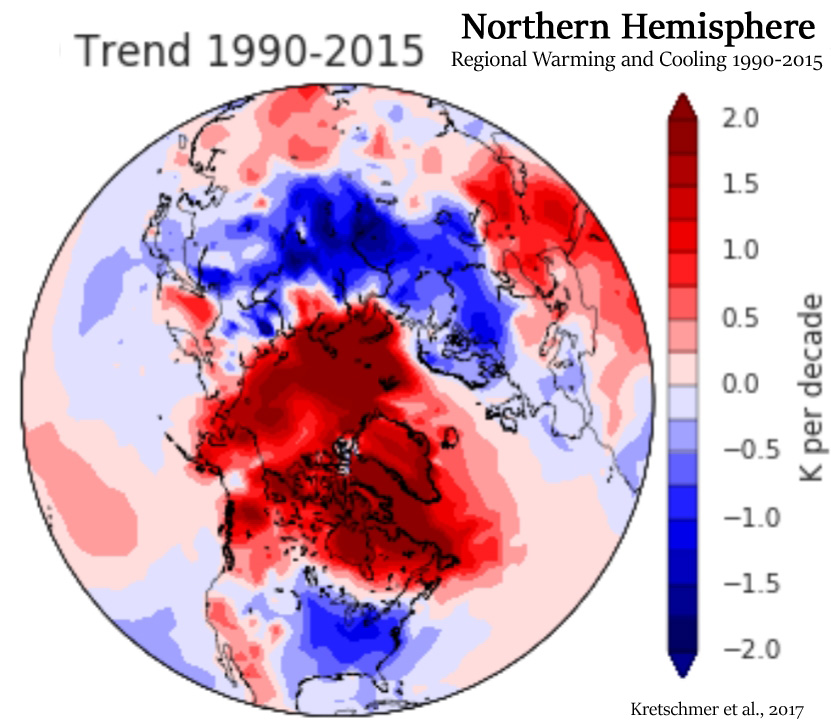
Image Source: Purich et al., 2018, Kretschmer et al., 2017
“The mean slope implies a change over 20 years [1994-2013] of 0.0213 ± 0.0014 °C”
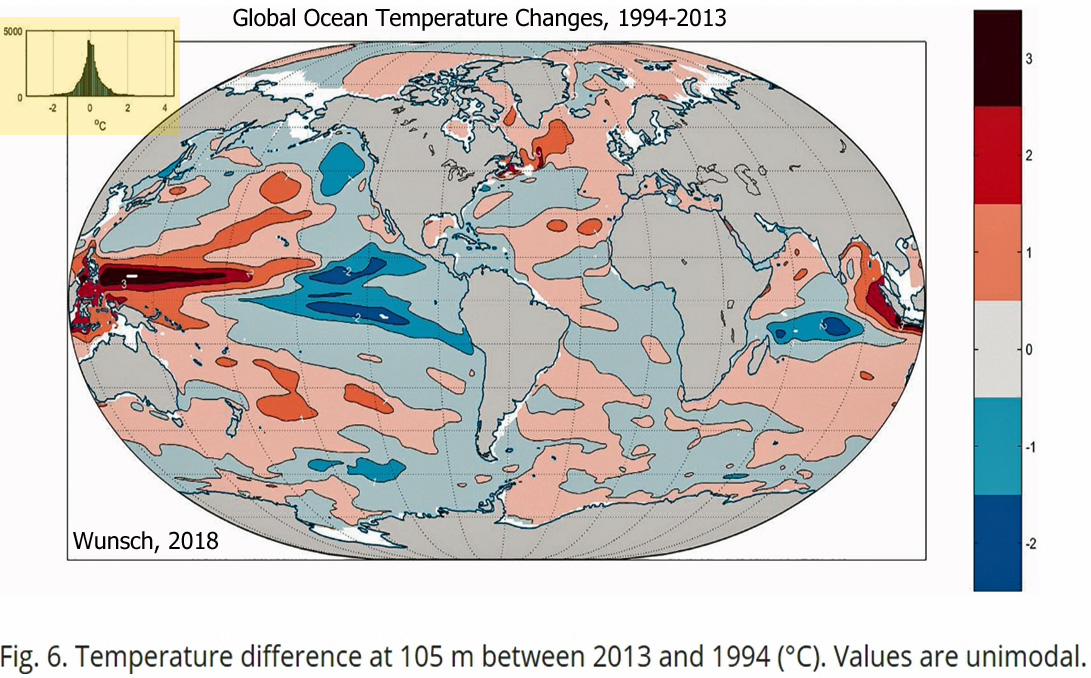
Image Source: Wunsch, 2018
Succinctly, then, scientists publishing in peer-reviewed journals have increasingly provided documentation that there is nothing historically unprecedented or remarkable about today’s climate when viewed in the context of long-term natural variability.
The compilation of non-global warming evidence continues in 2019. Thirteen papers have been added to the list thus far this year.
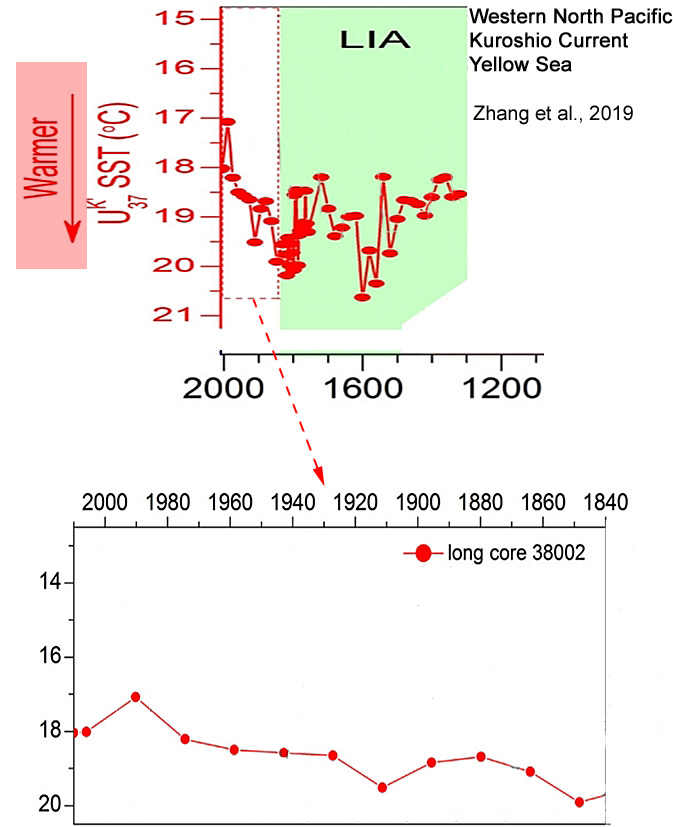
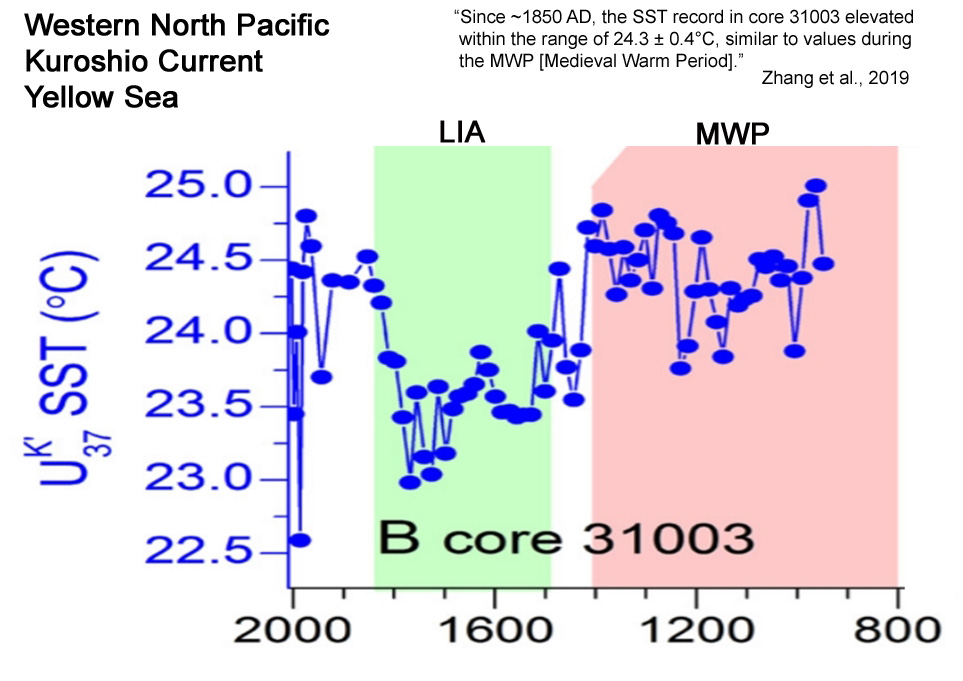
“In core 31003, the SST record shows a distinctly anti-phase relationship with that of core 38002 over the last millennium. For instance, from the MWP to LIA, SST values increased from ∼17.0 ± 0.3°C to ∼19.1 ± 0.6°C in the northern core 38002 but decreased from ∼24.3 ± 0.4°C to ∼23.5 ± 0.3°C in the southern coastal core 31003. Since ∼1850 AD, the SST record in core 31003 elevated within the range of 24.3 ± 0.4°C, similar to values during the MWP, but decreased gradually to ∼18.0°C in core 38002, in line with the SST trends at two additional locations from the YSWC [Yellow Sea Warm Current] pathway as reported by He et al. (2014).”
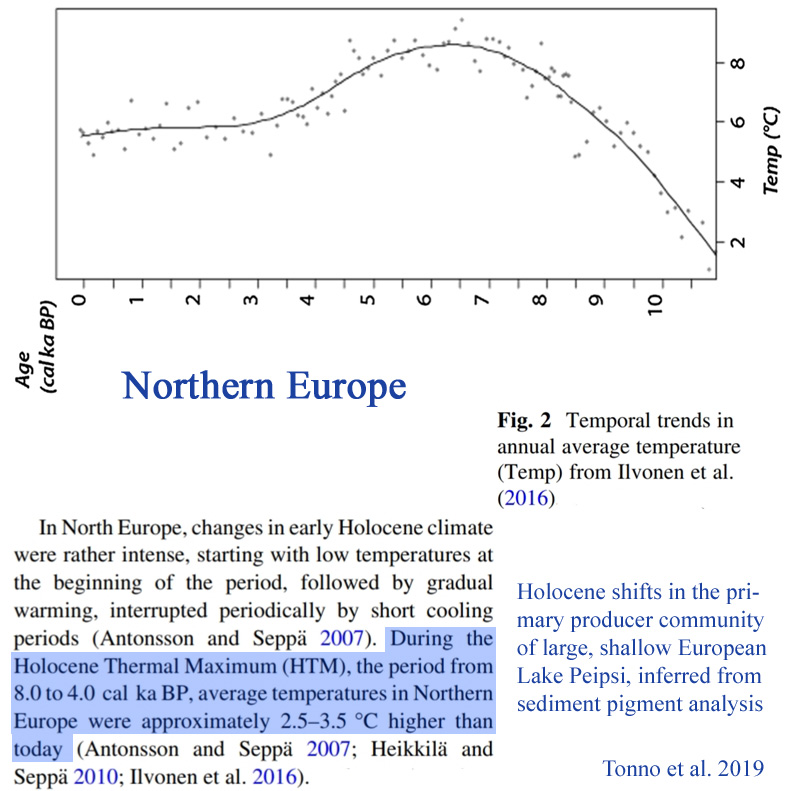
“In North Europe, changes in early Holocene climate were rather intense, starting with low temperatures at the beginning of the period, followed by gradual warming, interrupted periodically by short cooling periods (Antonsson and Seppa¨ 2007). During the Holocene Thermal Maximum (HTM), the period from 8.0 to 4.0 cal ka BP, average temperatures in Northern Europe were approximately 2.5–3.5 C higher than today (Antonsson and Seppa¨ 2007; Heikkila¨ and Seppa¨ 2010; Ilvonen et al. 2016).”
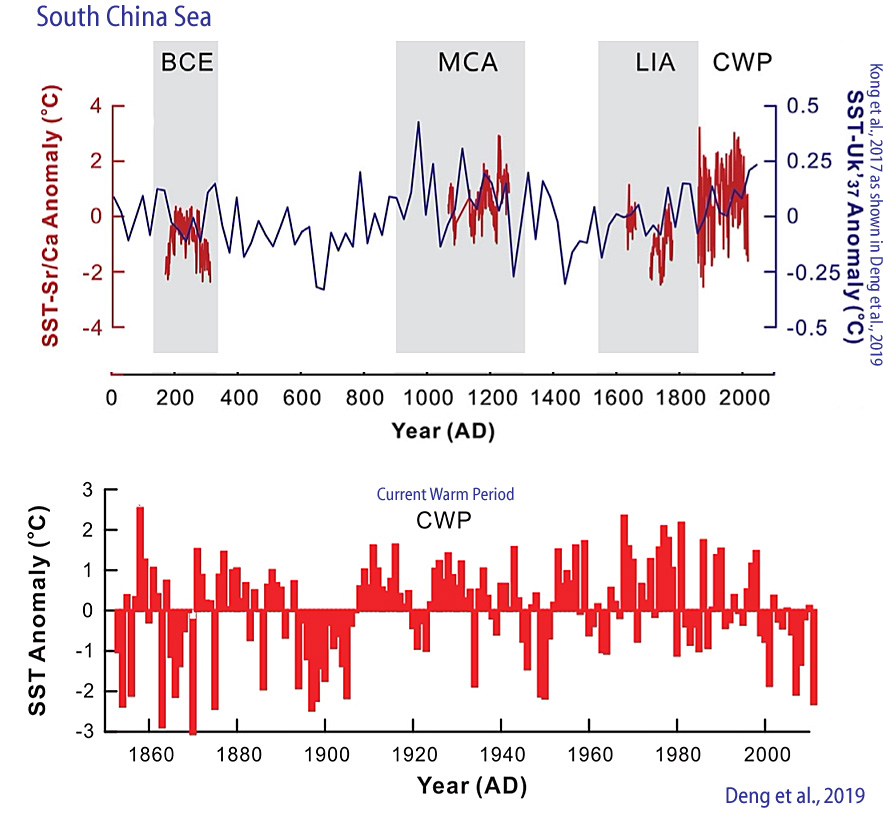
“Recent SST records based on longchain alkenones imply that the MCA [Medieval Climate Anomaly] was slightly warmer than the CWP [Current Warm Period] in the northern SCS [South China Sea] (Kong et al., 2017). … [I]t still should be noted that the SST record reconstructed from a Tridacna gigas Sr/Ca profile by Yan et al. (2015a) suggested that the annual average SST was approximately 0.89°C higher during the MCA [Medieval Climate Anomaly] than that of the CWP [Current Warm Period].”
“Diatom-based transfer functions for salinity, precipitation and temperature were developed using a training set that included data from 40 sites along central Mexico. … Maximum last glacial cooling of ∼5°C is reconstructed, a relatively wet deglacial and a warmer (+3.5°C) early Holocene. … The early Holocene marked a change towards high lake salinities and the highest positive temperature anomalies (+3.5°C) during a peak in summer insolation.”
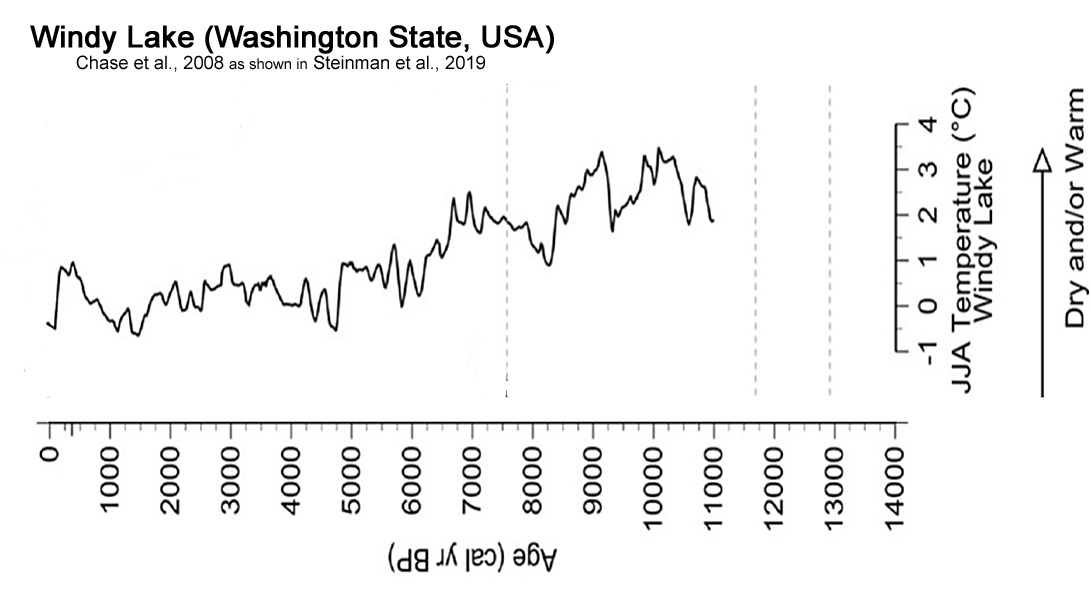
“The early Holocene d18O [hydroclimate] maximum in the Castor Lake record at 9630 (9110-10,100) yr BP is likely in part a result of higher summer insolation, which produced higher temperatures and greater evaporation during the warm season. Additionally, atmospheric circulation in the early Holocene was substantially different from the modern configuration (Bartlein et al., 2014), and precipitation amounts were likely lower, due to the presence of the residual Laurentide and Cordilleran Ice Sheets (Dyke, 2004), which affected air mass trajectories and the seasonal distribution and amount of precipitation on a hemispheric scale. … A chironomid based climate reconstruction from Windy Lake, south-central British Columbia, supports the assertion that greater summer insolation produced warmer summer temperatures at this time (Chase et al., 2008).”
Lozhkin et al., 2019 (SW Beringia)
“Mixed Larix-Betula forest was established at the Tanon site by ∼6600 14C BP (∼7500 cal BP). This forest included Betula platyphylla, a species common in moderate zones of the Russian Far East (e.g., B. platyphylla-Larix forests of central Kamchatka). The importance of Betula in the Middle Holocene assemblage is unusual, as tree Betula is not a common element in the modern coastal forest. The abundance of B. platyphylla macrofossils particularly suggests warmer than present summers and an extended growing period. This inference is supported by a regional climate model that indicates a narrow coastal region where the growing season was longer and summer temperatures were 2-4 °C warmer than today. Variations in Betula pollen percentages at other sites in northern Priokhot’ye are suggestive that this Middle Holocene forest was widespread along the coast.”
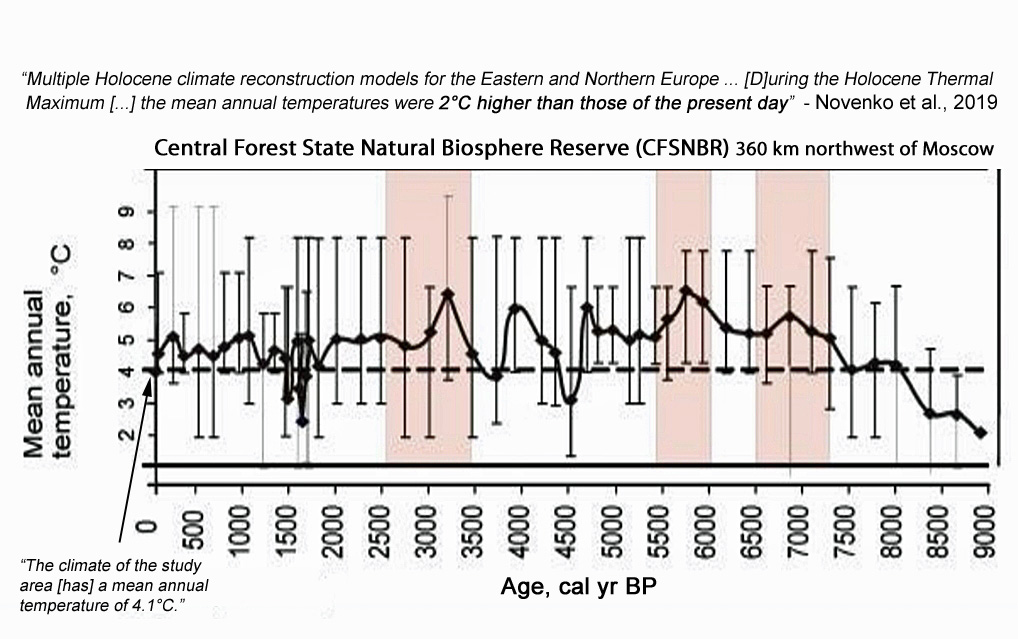
“[D]uring the Holocene Thermal Maximum when the mean annual temperatures were 2°С higher than those of the present day [6,9,10,11]. Roughly 5.7–5.5 ka BP, the Holocene Thermal Maximum was followed by gradual climatic cooling that included several warming and cooling phases with temperature fluctuations ranging between 2 and 3°С. …The CFSNBR [Central Forest State Natural Biosphere Reserve] is situated roughly 360 km northwest of Moscow (the Tver region, 56º35’ N, 32º55’ E) in an ecological zone transitioning from taiga to broadleaf forests. The vegetation of the CFSNBR is primary southern taiga forests, and it has been undisturbed by any human activities for at least 86 years. The climate of the study area is temperate and moderately continental with a mean annual temperature of 4.1°C and annual precipitation of roughly 700 mm [4].”
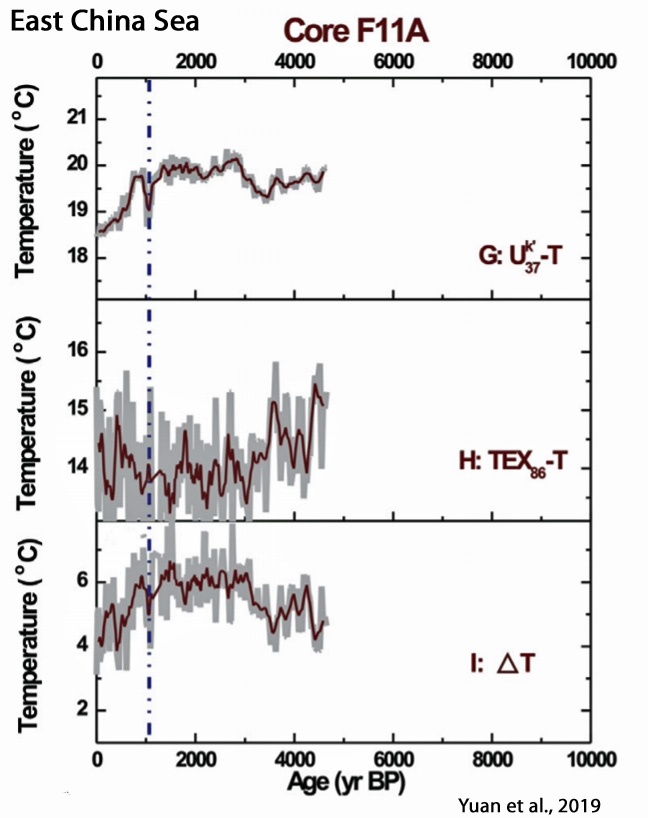
“During the early Holocene (10.0–6.0 ka), the modern-type circulation system was not established, which resulted in strong water column stratification; and the higher sea surface temperature (SST) might be associated with the Holocene Thermal Maximum (HTM). The interval of 6.0 to 1.0/2.0 ka displayed a weaker stratification caused by the intrusion of the Yellow Sea Warm Current (YSWC) and the initiation of the circulation system. A decreasing SST trend was related to the formation of the cold eddy generated by the circulation system in the ECS. During 1.0/2.0 to 0 ka, temperatures were characterized by much weaker stratification and an abrupt decrease of SST caused by the enhanced circulation system and stronger cold eddy, respectively.”
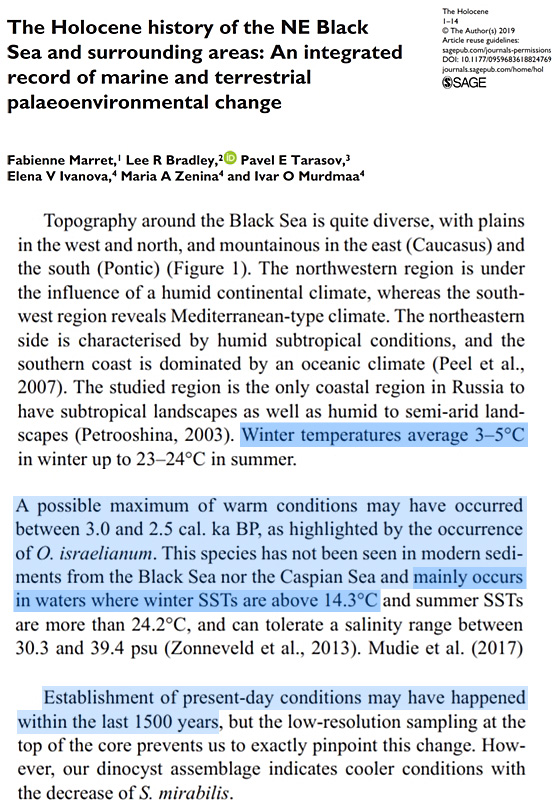
“The studied region is the only coastal region in Russia to have subtropical landscapes as well as humid to semi-arid landscapes (Petrooshina, 2003). Winter temperatures average 3–5°C in winter up to 23–24°C in summer. … A possible maximum of warm conditions may have occurred between 3.0 and 2.5 cal. ka BP, as highlighted by the occurrence of O. israelianum. This species has not been seen in modern sediments from the Black Sea nor the Caspian Sea and mainly occurs in waters where winter SSTs are above 14.3°C and summer SSTs are more than 24.2° C … Establishment of present-day conditions may have happened within the last 1500 years, but the low-resolution sampling at the top of the core prevents us to exactly pinpoint this change. However, our dinocyst assemblage indicates cooler conditions [today] with the decrease of S. mirabilis.”
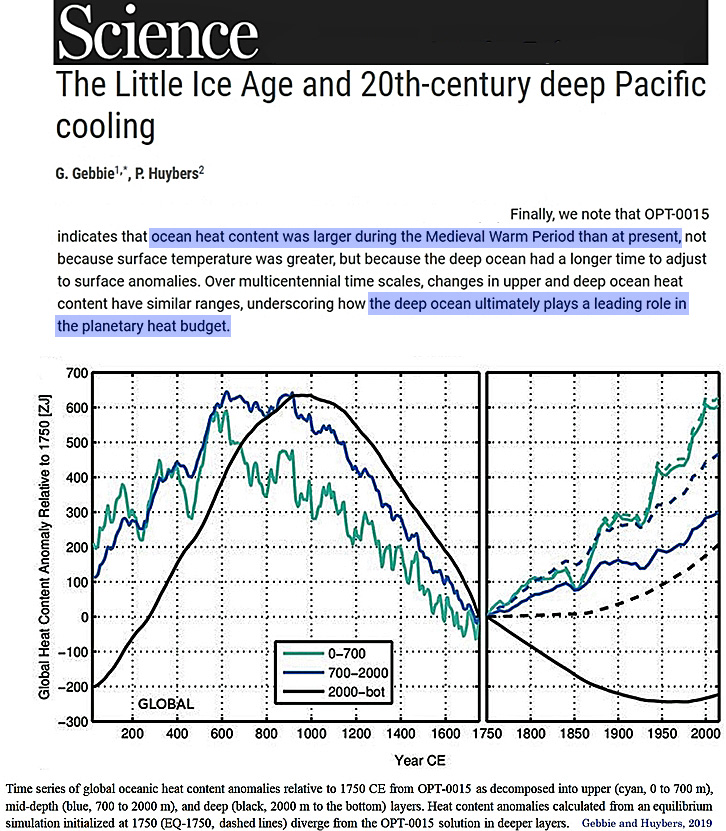
“The ongoing deep Pacific is cooling, which revises Earth’s overall heat budget since 1750 downward by 35%. … In the deep Pacific, we find basin-wide cooling ranging from 0.02° to 0.08°C at depths between 1600 and 2800 m that is also statistically significant. The basic pattern of Atlantic warming and deep-Pacific cooling diagnosed from the observations is consistent with our model results, although the observations indicate stronger cooling trends in the Pacific. …. At depths below 2000 m, the Atlantic warms at an average rate of 0.1°C over the past century, whereas the deep Pacific cools by 0.02°C over the past century. … These basin-wide average trends are used to relax the assumption of globally uniform changes in surface conditions and to constrain regional temperature histories for 14 distinct regions over the Common Era by a control theory method. The result, referred to as OPT-0015, fits the observed vertical structure of Pacific cooling and Atlantic warming. Global surface changes still explain the basic Atlantic-Pacific difference in OPT-0015, but greater Southern Ocean cooling between 600 and 1600 CE leads to greater rates of cooling in the deep Pacific over recent centuries. … OPT-0015 indicates that the upper 2000 m of the ocean has been gaining heat since the 1700s, but that one-fourth of this heat uptake was mined from the deeper ocean. This upper-lower distinction is most pronounced in the Pacific since 1750, where cooling below 2000 m offsets more than one-third of the heat gain above 2000 m. … Finally, we note that OPT-0015 indicates that ocean heat content was larger during the Medieval Warm Period than at present, not because surface temperature was greater, but because the deep ocean had a longer time to adjust to surface anomalies. Over multicentennial time scales, changes in upper and deep ocean heat content have similar ranges, underscoring how the deep ocean ultimately plays a leading role in the planetary heat budget.”
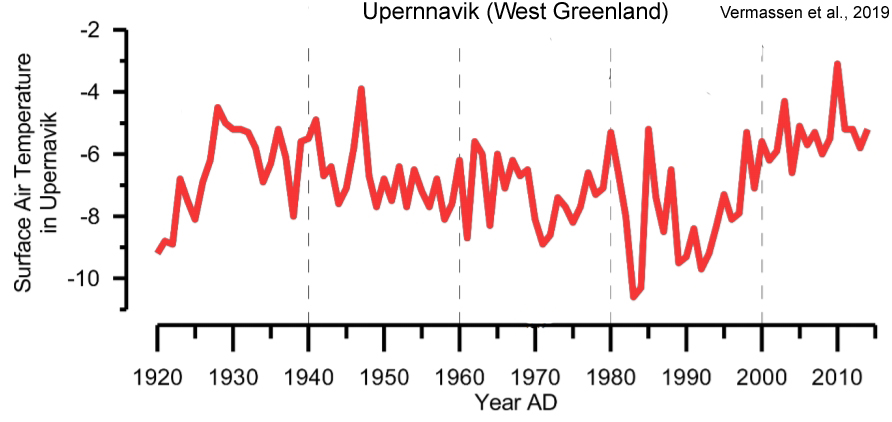
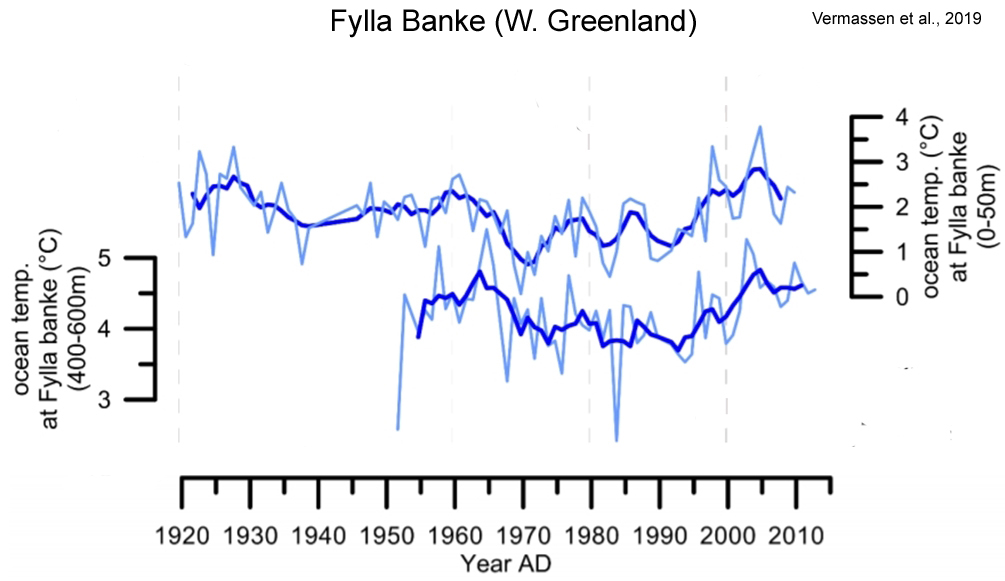
“[O]ur study shows that while warming of ocean waters in Upernavik fjord likely contributed to the retreat phases during the 1930s and early 2000s, ocean warming is not a prerequisite for retreat of Upernavik Isstrøm. … This is important since it implies that the future potential oceanic forcing of Upernavik Isstrøm will depend on changes related to circulation in the North Atlantic (i.e. the AMO). Since the meridional overturning circulation strength and associated heat transport is currently declining, (Frajka-Williams et al., 2017), this may lead to cooling bottom waters during the next decade in Upernavik Fjord and most likely also other fjords in West-Greenland.”
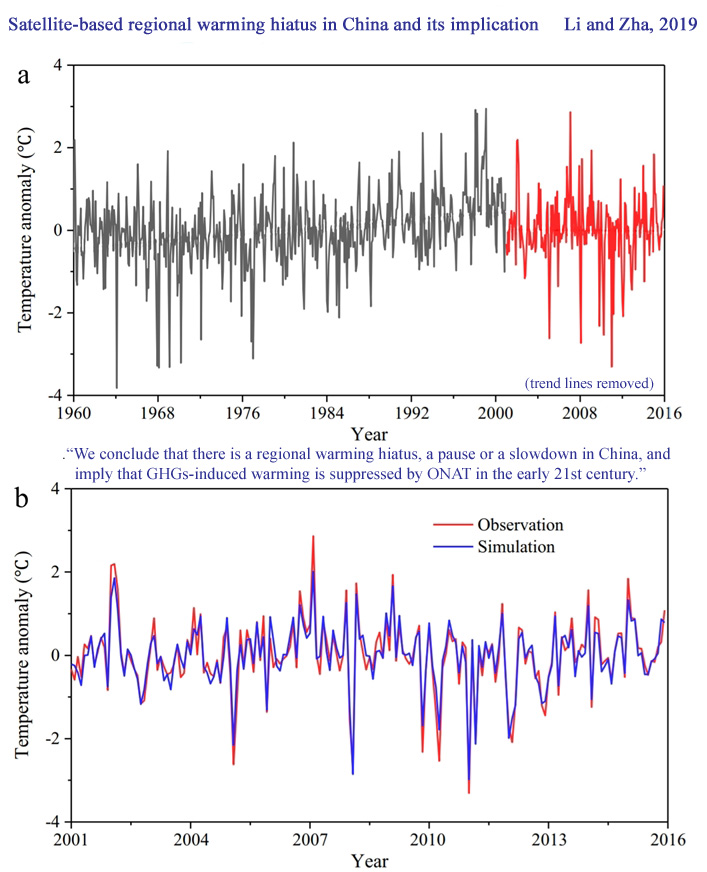
“Global warming ‘stalled’ or ‘paused’ for the period 1998–2012, as claimed by the Intergovernmental Panel on Climate Change (IPCC) Fifth Assessment Report (AR5) (IPCC, 2013). However, the early drafts of IPCC AR5 have no detailed explanation for this “hiatus” since 111 of 114 climate models in the CMIP5 earth system model did not verify this phenomenon. … In 2017, after a wave of scientific publications and public debate, the climate models as reported in IPCC remain debates, including definitions of “hiatus” and datasets (Medhaug et al., 2017)…. The slowdown in global warming since 1998, often termed the global warming hiatus. Reconciling the “hiatus” is a main focus in the 2013 climate change conference. Accurately characterizing the spatiotemporal trends in surface air temperature (SAT) is helps to better understand the “hiatus” during the period. This article presents a satellite-based regional warming simulation to diagnose the “hiatus” for 2001–2015 in China. Results show that the rapid warming is mainly in western and southern China, such as Yunnan (mean ± standard deviation: 0.39 ± 0.26 °C (10 yr)−1 ), Tibet (0.22 ± 0.25 °C (10 yr)−1), Taiwan (0.21 ± 0.25 °C (10 yr)−1), and Sichuan (0.19± 0.25 °C (10 yr)−1). On the contrary, there is a cooling trend by 0.29 ± 0.26 °C (10 yr)−1 in northern China during the recent 15 yr, where a warming rate about 0.38 ± 0.11 °C (10 yr)−1 happened for 1960–2000. Overall, satellite simulation shows that the warming rate is reduced to −0.02 °C (10 yr)−1. The changes in underlying surface, Earth’s orbit, solar radiation and atmospheric counter radiation (USEOSRACR) cause China’s temperature rise about 0.02 °C (10 yr)−1. A combination of greenhouse gases (GHGs) and other natural forcing (ONAT, predominately volcanic activity, and atmosphere and ocean circulation) explain another part of temperature trend by approximately −0.04 °C (10 yr)−1. We conclude that there is a regional warming hiatus, a pause or a slowdown in China, and imply that GHGs-induced warming is suppressed by ONAT in the early 21st century.”
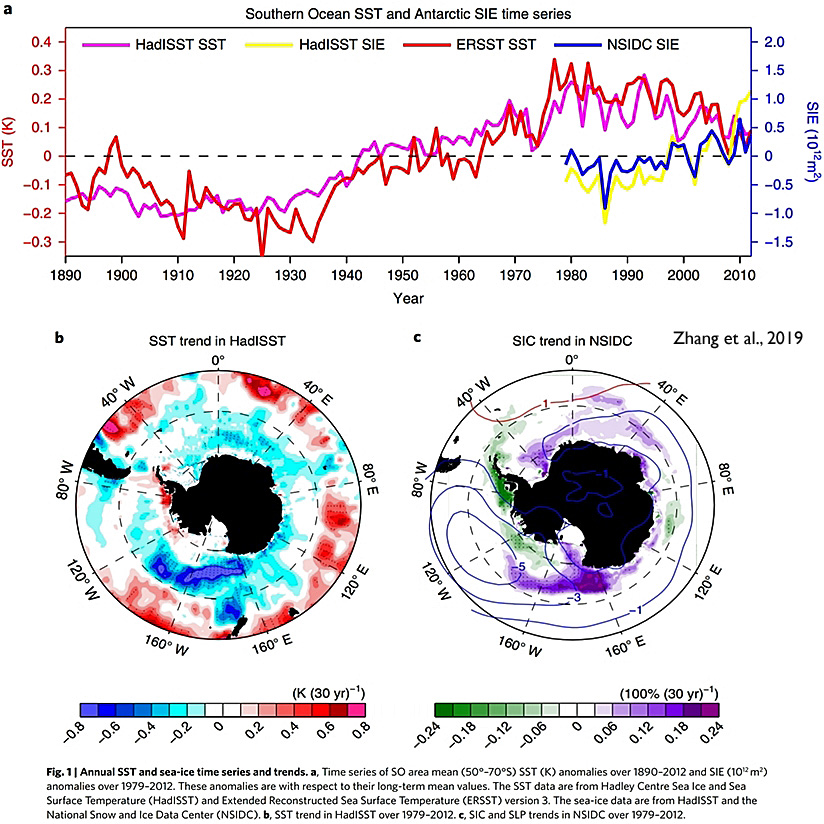
“Observed Southern Ocean surface cooling and sea-ice expansion over the past several decades are inconsistent with many historical simulations from climate models. Here we show that natural multidecadal variability involving Southern Ocean convection may have contributed strongly to the observed temperature and sea-ice trends.”


Three cheers for Kenneth Richard and all his patient and informative gathering and summarising, here on this blog, of recent scientific work reflecting a calmer, more analytic, more objective approach to our understanding of climate variation.
Is that the new theme that skeptics are supposed to use when talking about past temperatures and how they compare to the modern temperature record?
And I guess you hope this is just an episode and from now on temperature will be stable or even cooling because some scientist wrote that down somewhere?
If looking at temperature graph from some regions gives you that impressions, fine. Did you know that the place where I live was once below an ocean? Until that happens again, I’d say anything can be classified as being unremarkable … right?
The remarkable part is that it’s human caused. Some scientists even go so far that this human intervention even might have interrupted the usual ice age cycle. Don’t you think that something like that would be remarkable?
Oh, and if this continues you would still think there is no problem ahead of us?
https://www.reddit.com/r/dataisbeautiful/comments/acitut/global_temperature_1850_to_2018_compared_to/
Seb, now you’ve commented (weakly) and had your say on this article. Don’t expect to use this asa platform for you sound off and that all your comments will be published. Thank you for your comment on this article. We will of course consider its merits.
Thank-you Pierre and Kenneth for publishing another uplifting piece.
Reality can be such a hard task master, especially when trying to analyze natural process and all the inevitable complication that involves.
Showing these paper clear to much of the unrealistic, dire, and depressive cAGW dross from the picture.
Well done.
What’s human caused? The ocean warming in the last 2 centuries that is so insignificant it’s “below the detection limit“? The 0.34 of a centimeter addition to sea levels from Antarctica ice melt since 1958? The no-net-warming-in-80-years Arctic? The no-continent-scale-warming-in-the-last-century for Antarctica? The Greenland ice sheet melt that is so insignificant it’s not even detectable? The no-net-warming since the 1930s across the globe not affected by urban heat island and non-climatic influences? The coastal area across the world that has been stable or growing in recent decades because sea level rise is so insignificant it cannot keep up with natural geological processes? And on and on…
We’ve been waiting for you to tell us what is so unusual and remarkable about modern times climatically that we can link it to human causes. But it just doesn’t seem like anything has happened that falls outside the range of what occurs naturally. After all, natural climate change involves hemispheric-scale warming of several degrees in a few decades, not about 0.05 C per decade of warming over the course of centuries.
If what continues? Another 500 years of normal?
High CO2/planet greening/enhanced crop yield/fewer hurricanes and droughts is NOT more of a problem than a Little Ice Age climate, which is accompanied by more drought, hurricanes, planet browning, shorter growing seasons and dangerously low crop yields.
Not sure why some people would think that LIA conditions are desirable, that is unless they have a woefully inadequate knowledge of history.
Sorry Kenneth, I am not allowed to reply to your comment and explain you why your imagination has gone wild again and how linking to a human cause works (or doesn’t) when looking at regional changes.
Have a fun day as apparently I have to let you guys post nonsense replies mentioning my name or as a reply to my comments and leave them unanswered. And you know what happens when not answering comments … You don’t look skeptic-like. Well, I don’t want to look like one of you guys so that’s a win I guess.
Pierre, sorry … had to get a bit sarcastic there. This is ridiculous.
Yes, because your explanation that utilizes the logic…
CO2 increased during 1950 to present. Ocean heat content increased during 1950 to present. Therefore, the CO2 increase is the 100% cause of the increase in ocean heat content from 1950 to present.
…was going to be persuasive this time around.
If it’s not possible to obtain a human signal amid the noise of heating an cooling depending on the region, then it’s also not possible to obtain a human signal globally. The globe is a compilation of regions. Large regions of the globe are, and have been, cooling. Large regions of the globe are, and have been, warming. Mixing them together and claiming the globe is warming because, on net, the regions where it’s warming has slightly more heat amplitudes than the regions with heat losses is not consistent with an alleged human signature.
Similarly, if the Antarctic Peninsula has warmed by 1.0 C and East Antarctica has cooled by -0.8 C since 1979, it would not be correct to say that Antarctica has warmed. Nor would the Antarctic Peninsula be representative of the human signal while East Antarctica represents natural variability. Natural variability can be behind both the cooling and the warming. The AGW notion that if it warms in a region it’s human-caused, and if it cools in another it’s natural variability or merely heat redistribution is nothing more than ad hoc speculation and confirmation bias.
http://journals.ametsoc.org/doi/abs/10.1175/JCLI-D-11-00148.1
“Global satellite observations show the sea surface temperature (SST) increasing since the 1970s in all ocean basins, while the net air–sea heat flux Q decreases. Over the period 1984–2006 the global changes are 0.28°C in SST and −9.1 W m−2 in Q, giving an effective air–sea coupling coefficient of −32 W m−2 °C−1 …[D]iminished ocean cooling due to vertical ocean processes played an important role in sustaining the observed positive trend in global SST from 1984 through 2006, despite the decrease in global surface heat flux. A similar situation is found in the individual basins, though magnitudes differ. A conclusion is that natural variability, rather than long-term climate change, dominates the SST and heat flux changes over this 23-yr period.”
—
Chilingar et al., 2014
“In the Earth atmosphere, methane gradually converts into carbon dioxide which, according to the conventional anthropogenic theory of global warming, is the main driver of global climate change. The authors investigated the greenhouse effect of methane and carbon dioxide in the atmosphere using their tested adiabatic model, which relates the global temperature of troposphere to the atmospheric pressure and solar activity. This model allows one to analyze the global temperature changes due to variations in mass and chemical composition of the atmosphere. Even significant releases of anthropogenic carbon dioxide and methane into the atmosphere do not change average parameters of the Earth’s heat regime and have no essential effect on the Earth’s climate. Thus, petroleum production and other anthropogenic activities resulting in accumulation of additional amounts of methane and carbon dioxide in the atmosphere have practically no effect on the Earth’s climate.”
–
http://link.springer.com/article/10.1007%2Fs00254-006-0261-x
“The current global warming is most likely a combined effect of increased solar and tectonic activities and cannot be attributed to the increased anthropogenic impact on the atmosphere. Humans may be responsible for less than 0.01 C (of approximately 0.56C (1F) total average atmospheric heating during the last century) (Khilyuk and Chilingar 2003, 2004). … Any attempts to mitigate undesirable climatic changes using restrictive regulations are condemned to failure, because the global natural forces are at least 4–5 orders of magnitude greater than available human controls.”
Yes,
Hahahaha! Call that science?
Interesting that unlike the modeled world, when people actually get to looking at the climate parameters of the world — NOTHING UNUSUAL has happened, or IS happening.
Wow, that must hurt the cAGW crowd and their modeled madness of ever increasing atmospheric global temperatures heading to +20° or more, SST (Zhang et al., 2019), Pacific ocean’s heat content is lowering, and even rapid species extinctions are so few that they are not even reported! 🙂
For the true believer in in cAGW IT’S WORSE THAN THEY THOUGHT so many of their imaginative hobgoblins of a dire future just are not happening as these papers here show.
Natural order prevails, man has not damned the planet to hell, and CO2’s much advertised effects are yet (after ~40 years of waiting) to show up in any meaningful way. Our burning of fossil fuel is just helping to green the world and nothing else significantly dire is happening, so maybe it’s time to drop the pretense and drop the UN-IPCC stupidity.
Meanwhile back in the fantasy computer models land of cAGW, and it’s paid advocate commenting on these pages, nothing of substance is said, such is the overwhelming effect of ‘265 Papers Published Since 2017 Subvert The Claim That Post-1850s Warmth Has Been Unusual, Global’.
Typical! Probably does understand the topic, so just more sneers and tries to distract of topic.
It is a cruel irony that Marcott et al. (2013) attempt to recast 73 previously-published non-hockey stick Holocene reconstructions as supporting an unprecedented 20th century “uptick”, only to be debunked by Marcott’s own prior work. That’s almost equivalent to Lysenkoism defeated by Trofim Lysenko’s own crops. 🙂
Yup, as I’ve written before: It was quiet. All TOO quiet! Nothing is happening, and it’s not happening faster than it never happened before! QUICK! We’ve got to DO something!!!
“The remarkable part is that it’s human caused. etc., etc.”
Since 1950, there has been no consistent change in the earth’s temperature. The slightly warmer temperature today is transient, the result of brief episodes of warming in only a couple of years. It has no connection to CO2, which, in contrast to temperature, has increased steadily.
https://youtu.be/rohF6K2avtY (16:00)
The only time during the 20th century when global temperature changed consistently over consecutive years was during the 1920s and 1930s – when CO2 was smaller than 300 ppm – about what the IPCC claims existed before the industrial era.
Another Salby video. Thanks. I don’t have that one.
Thank-you Philip,
a replacement for the video with the awful sound.
SebastianH,
Your distraction from the main tenet of this post —
“Some scientists even go so far that this human intervention even might have interrupted the usual ice age cycle.”
Is not even worth wasting time over. As any ‘scientist’ who said such a thing is just willfully being depressingly alarmist, propably try for grant money.
No scientists can accurately define ‘the usual ice age cycle’. No scientist can show the variations from what should be the next ice age’s natural pattern of events. And no scientist can show conclusive evidence than the variation from the natural are caused by human actions.
It’s much like the usual tabloid headline of “Scientists say … bunkum, baloney and send more money or you’ll die.” 🙂
Have to reply here since this is interesting. Are you saying that you can’t infer the future from just analysing past periodicity and calculating a continuation of those? Because that’s how skeptic scientists do predictions. Kenneth posts papers like that all the time 🙂
SebastianH,
try again.
It is 3 statements that are linked together, if you keep reading all of them every 10 minutes ± 2.85 minutes with variably chaotic, quasi-cyclic repetition rate, you may see the answer.
Again we see another EMPTY, fact-free post from seb.
There is NO evidence of human cause in the real and highly beneficial warming since the LIA cold anomaly.
You have NEVER presented one bit of solid evidence that there is.
(Plenty of evidence of human cause in the calculated global average by GISS et al, but that is not real, nor global)
MANY parts of the globe HAVE NOT warmed for a considerable period of time
Those are the FACTS.
Once again I’ve edited out some of the constant repetitions you keep making, and which no one at all is interested in hearing – and are in fact totally bored by. In the future Kenneth and I will simply delete such comments entirely. Please end your “zero-evidence” claims and name-calling. We’ve read them at least 500 times now.
Darn, Someone chopped out the good parts of my post 😉
You’re no fun. 🙂
Come on Spike. I’ve seen you write some really good stuff, and am positive there’s lots more in there.
Sure, you’re right about the troll, but your negative stuff (funny the first dozen or so times) is what trolls feed on. Just take
sisyphus’B&t’s afvice, DNFTT, and please give is some of your more insightful comments that are informative and enjoyable to read.Feed your friends. Don’t gratify the drech!
Quite honestly, I doubt any other blog site has been more patient.
👍 Indeed!
Climate Audit has a detailed post on PAGES2K:
https://climateaudit.org/2018/10/24/pages2k-north-american-tree-ring-proxies/
”We noted that Graybill himself had attributed the marked increase in late 19th and 20th century bristlecone growth to CO2 fertilization, not temperature…” – from link
Just as I had guessed well over a decade ago. Makes more sense that an increase of from 1.5 – 2.0 x CO2 would have more affect than a few tenths of a degree temp increase.
Kenneth,
It is interesting that you have included both Purich et al., 2018, and Kretschmer et al., 2017 papers.
Ariaan Purich paper ‘Impacts of Broad-Scale Surface Freshening of the Southern Ocean in a Coupled Climate Model’ is largely concerned with improvement in the CMIP5 models, however I’m amused by the opening comment —
This graphically exposes the lie that the models work with ‘settled science’ as it is obvious from this point most models require some changes.
Marlene Kretschmer’s paper ‘More-Persistent Weak Stratospheric Polar Vortex States Linked to Cold Extremes’ which is mainly about models and their improvements. However they do compare model products to reality 🙂
And very pertinent to current winter weather, and the hows, whys and unknowns of the interplay between the stratosphere and troposphere. They use the European weather model (ECMWF) for the basic data input. Subsequently it is all about tuning the models, and comparing them to the observation from the last 4 decades.
They end their conclusions with —
It’s heartwarming to see that some modelers are working this way, it’s a crying shame that most of the CMIP5 modelers are so reluctant to verify their models’ products against what really happens on this planet.
I find it interesting that in electronics SPICE models (for designing and making electronic circuits) dominate and in the main, work exceptionally well. With each and every component’s parameters rigorously characterize, basic electronic theory is mathematically incorporated checked and verified, and devices come from the manufactures fully SPICE characterized. That is not to say they are perfect, there are many example where when SPICE designed circuits are manufactured amplifiers oscillate, oscillator don’t, high frequency circuits produce more noise than signal — such are the normal failing of computer modeling and design.
But I do remember the early days, when the computer models would often crash, basic electronic theory was poorly incorporated, and few components characteristic were properly known. Most computer modeling programs were just too unstable for the real world modeling and designing.
I certainly feel the same about those CMIP5 climate models, it is very early days. They are unrealistic both in their operation on basic climate parameters and their output. For many parameters are not fully known and characterized (not enough field work!); how parameters act/react with other parameters (some insight is here https://agupubs.onlinelibrary.wiley.com/doi/full/10.1002/2017MS001067), and what is the optimum level of resolution for any parameter and subsequent calculations.
IMO they are NOT the technology any governments should be basing policy on as they are decades away from being usable.
“Previous studies showed that a weak stratospheric polar vortex can lead to cold-air outbreaks in the midlatitudes, but the exact relationships and mechanisms are unclear.”
Sounds like she could stand to listen to Joe Bastardi. He shows how previous weather patterns are pretty faithful indicators of what is about to happen. He has the tools, and knows how to use them. Interesting how human pattern recognition can’t be duplicate by models, …(yet?).
From what I’ve read over the years, making the climate model as good as Joe Bastardi is not likely because the models are NOT AI systems, and the current CMIP5 models can not be made so because the science (and translation into mathematical algorithms) is not complete. The models just do task specific calculations on linked processes — just specialize and complex calculators.
Current models have many short-comings but especially with the likes of water vapor, humidity, clouds, ice in clouds, precipitation etc.
The basic problem boils down to basic size of the grid being too large to get adequate resolution for what is happening, compounded by the lack of basic knowledge of how all clouds operate (more field work required).
My interpretation of what is done is currently done is to use homogenizing and interpolating methods, mixed with fluid mechanics for the dynamics.
As one paper I read recently showed, attempting to predict cloud movement and energy changes appear to be very particular to their position on the globe. Clouds over the poles seem to act and react to condition differently to clouds over the equator. Modeling clouds in the mid-latitudes offer great problems, especially the thin high altitude types.
From what I recall, for many CMIP5 models much of this is fudged around, often by adjusting other parameters such as atmospheric aerosols and particulates. I may not be fully up-to-date (yes, I know the CLUBB CMIP5 model does things differently) on this but I doubt it.
Other linked paper from Ariaan Purich et al., points out some of the deficits in the basic understanding of ocean functioning and how the CMIP5 model fail …
So the CMIP5 models are basically calculating machines, and are not ready to be AI. Which means that unlike a human (e.g. Joe Bastardi), they cannot iteratively recall past experience of a set of tasks and results (within any particular process) to self adjust it’s algorithms to give more realistic results. They just chunter along calculating with some imprecision, limited resolution from an incomplete algorithmic understanding of all the science of how the climate is and the way it progresses.
As the document I linked ( https://agupubs.onlinelibrary.wiley.com/doi/full/10.1002/2017MS001067) explains, even the very basic methodology of the order in which the processes are carried out is not standardized, or measured for overall basic efficiency, accuracy, and optimal speed for the flow of data in the models.
That is not to decry that the climate models have improved vastly over the last few years. And continue to improve. What they manage to achieve is truly amazing. But to base any governments’ policies on what these machines say about the future climate is, IMO, a gross mistake.
~~~~~~~~~~~~
You may also wish to see The Southern Ocean / Hemisphere Problem (parts 1 and 2) at https://chiefio.wordpress.com/2019/01/30/the-southern-ocean-hemisphere-problem/ for the other problems with the basic data from the weather stations, it’s a real eye-opener.
Yup. They need an AI that’s as good as a human. Ain’t gonna happen.
Thanks for the Chiefio links. He’s got some good material. Haven’t been there in a while.
While I’m here take a look at https://www.youtube.com/watch?v=_njf8jwEGRo when you have time.
It’s 1hour 37 minutes long (gulp) of a lecture from Stanford University, so get some tea/coffee & biscuits ready.
It lays out the reasons why chaotic system are not easily amenable to reductionist methods, and might not ever work correctly!
Today’s “daily update”
https://www.weatherbell.com/video/the-daily-update-575?full
One might be able to program an AI to grossly approximate some of what Bastardi does, but I don’t see anyone getting close to approximating him. 😄
But that would require the “experts” to be up to speed on what he does. Doesn’t look like that’s going to happen soon, though. They don’t even appear to be aware of it.
The place where I live was once a shallow sea with an equatorial geographic location. That was 390 million years ago, there is another 3000 meters of new lithosphere above what was once a sea.
That shallow sea is now oil and brine ten thousand feet down in the ground. People drill oil wells and get the stuff. Everybody likes oil.
Before you get to the oil there are billions of tons of coal, sixty feet down there is coal, you operate a dragline to remove the overburden, then go get the coal, haul it to the power plant, voila, electricity.
It don’t get no better, the postmodern world is as good as it gets.
https://www.youtube.com/watch?v=TCy_UOjEir0
So you are one of those calling global warming a hoax (as per your Youtube link)? Good to know …
WHO CAN YOU TRUST?
So, SebH, you are one of those saying we should believe those telling just-so stories based on manipulated and artificially contrived data?
https://climateaudit.org/2010/12/26/nasa-giss-adjusting-the-adjustments/
…and suppression of evidence to the contrary?
https://www.masterresource.org/debate-issues/lindzen-choi-special-treatment/
…and just sloppy math.
https://www.nicholaslewis.org/wp-content/uploads/2018/11/A-major-problem-with-the-Resplandy-et-al.-ocean-heat-uptake-paper.pdf
Oh, wait. We already knew that.
Skeptical readers my also be interested in this.
https://leg.mt.gov/bills/2011/Minutes/Senate/Exhibits/ens60a03.pdf
The proponents of anthropogenic-caused global warming invariably, (and ironically) DENY that the Medieval Warming Period (MWP, 1,000 years ago) was global and likely warmer than it is now. These alarmists acknowledge only that Europe experienced the MWP. (They had no choice – it’s too well documented in that region!) These “deniers” likely take this unjustifiable position because their computer models cannot explain a global, warmer MWP. Why not? Because their models require an increasing co2 level, plus depend even more on the ASSUMPTION that water vapor feedback is the actual culprit, causing 2 to 3 times the temperature increase as brought on by the increase in co2. However, co2 did not begin increasing until about the mid 1800s, long after the MWP.
The global temperature increase during the MWP could not have been influenced by co2 because there was no increase in co2 and, obviously, also no water vapor feedback. It therefore becomes plausible that our current warming (such as it is) may also be due to NATURAL climate variation. But that conflicts with Mann’s hockey stick graph, and its various adherents, all of whom claim that our current warming is mostly due to human activity which causes an increase in co2 level.
However, it’s easy to show that the MWP was indeed both global and at least as warm as now. While that proves nothing about the cause of our current warming (such as it is) it speaks loudly about the credibility of the folks who DENY that the MWP was global and at least as warm as now.
A brief meta-analysis, in effect a global study, follows, which makes use of numerous peer-reviewed studies, as well as other easily accessible data. The analysis demonstrates that the MWP was global and at least as warm as it is now.
First, the MWP trend is conclusively shown to be global by borehole temperature data. No controversial models needed, the data speaks for itself. The 6,000 boreholes scattered around the globe are not constrained to just those locations where ice core data has been used. A good discussion of the borehole data can be found at Joanne Nova’s website.
http://joannenova.com.au/2012/11/the-message-from-boreholes/
Next, the receding Alaskan Mendenhall glacier recently exposed a 1,000-year-old shattered forest, still in its original position. No trees (let alone a forest) have grown at that latitude anywhere near that site since the MWP. It was obviously significantly warmer in that part of Alaska than it is now, and Alaska is quite distant from Europe.
Finally, there have been hundreds of peer-reviewed MWP studies around the globe, with investigation results showing each site to have been warmer during the MWP than at the time of the study, and that result was reflected in earlier IPCC reports. The continuation of similar confirming research also continues to be ignored by the usual suspects.
The MWP studies were carried out around the globe by investigators and organizations representing numerous countries. It’s curious that Mann and his cohort did not give more consideration to the existing studies before presenting their conflicting “hockey stick” claim, particularly given the controversial process they employed. One of the well-known alarmists, Phil Jones, admitted publicly that if the MWP was global and as warm as now then it’s a “different ballgame”. (But apparently neither Phil nor Mann, nor other alarmists, bothered to re-examine the conflicting data.) Even today peer-reviewed studies continue to regularly show up confirming that the MWP was at least as warm as now.
The Greenland Temperature (gisp2) study (google it), for example, shows, among other things, that Greenland was warmer during the MWP than it was at the time of that study. Greenland is distant from both Europe and Alaska. There’s also a separate link: https://junkscience.com/2018/06/study-ancient-greenland-was-much-warmer-than-previously-thought/
The numerous MWP studies have been cataloged by the co2science.org website. Dr. Idso, the proprietor of that website, is a known skeptic. However, the peer-reviewed studies were independently performed by numerous researchers who not only represented many different countries but also used various temperature proxy techniques. Dr. Idso is merely operating as a librarian.
Interested readers should satisfy themselves by going to co2science.org and choosing (say) a half-dozen regions (all should be remote from Alaska, Greenland, and Europe). Focus on the subset of the MWP studies which directly address temperature. Choose at least one temperature study from each selected region. (Dr. Idso provides brief summaries but you can also review the original study.) You will find that each of the selected study sites was found to be warmer during the MWP than at the time of the study. These study results are consistent with the temperature trend exhibited by borehole data. Conversely the aggregate studies confirm the global borehole data trend.
There are also other confirming observations which include such things as antique vineyards found at latitudes where grapes cannot be grown today, old burial sites found below the perma-frost, and Viking maps of most of Greenland’s coastline. Here is a recent report, which references various studies, showing that South America experienced the MWP.
https://notrickszone.com/2018/11/03/new-study-medieval-warm-period-not-limited-to-north-atlantic-but-occurred-in-south-america-as-well/
This meta-study is an aggregate of straightforward peer-reviewed studies, any of which can be replicated and the research results do NOT require the use of controversial “models”, or dubious statistical machinations.
One of the “talking points” posed by alarmists attempting to “rebut” the global, warmer MWP is their claim that warming in all regions during the MWP must be synchronous. Obviously the MWP studies were generally performed independently, so the start and end dates covered by each MWP study will likely vary.
However, anyone foolish enough to accept that “synchronous” argument must be prepared to admit that our current warming would also not qualify as a global event. For example, many alarmists go back into the 1800s when making their claims about the total global warming temperature increase. However, that ignores a three decade GLOBAL cooling period from 1945 to 1975. Moreover that globally non-synchronous period is much more significant than just a region or two not showing a temperature increase.
There are also other good reasons to exclude consideration of temperature increases during the 1800s. There was a significant NATURAL warming beginning around 1630 (the first low temperature experienced during the Little Ice Age), according to Dr. David Evans, and that period of naturally increasing temperatures continued until about 1850, at which time co2 began increasing. But it would have taken many subsequent decades, possibly more than a century, for co2 increase after 1850, at an average 2 ppmv per year, to accrue sufficiently before having any impact on temperature measurements. Neither is there any reason to expect that the 200 years of natural and significant warming beginning in 1630 ended abruptly, after 2 centuries, merely because co2 level (a trace gas) began increasing in 1850 at a miniscule 2ppmv per year. How much, and for how long was the temperature increase after 1850 due mostly to the continuing natural climate warming beginning in 1630?
Also, related to the “synchronous” argument, any current considerations about global warming must be constrained to a starting point AFTER the cooling which ended in 1975. The global temperature began steadily increasing in 1975 and that increase basically terminated during the 1997/98 el Nino. Even the IPCC (a bureaucracy which cannot justify its mission if our current warming is NATURAL) has acknowledged a GLOBAL “hiatus” in temperature increase after 2000. This admission conflicts with the well-known fact that co2 level has steadily increased since around 1850. Where is that missing heat?
So, our current “global warming” controversy involves basically two decades, (1975 to 1998) and that warming has been followed, by almost another two decades of no further statistically significant increase in temperature. But wait … ! It turns out that even the period from 1975 to 1998 apparently does not qualify as a global warming period because there were numerous “out of synch” regions and/or countries which experienced no additional warming over durations which are included in the 1975-1998 span.
https://notrickszone.com/2018/02/18/greenland-antarctica-and-dozens-of-areas-worldwide-have-not-seen-any-warming-in-60-years-and-more/#sthash.5Hq7Xqdh.JsV4juVL.dpbs
https://wattsupwiththat.com/category/hiatus-in-global-warming/
Another alarmist attempt at rebuttal is that the MWP studies cataloged by co2science.org have been cherry-picked. (Dozens of independently peer-reviewed studies spanning several decades, all cherry-picked? And what about the borehole data? And the other supporting data? Readers can satisfy themselves by searching for credible peer-reviewed MWP temperature studies which support alarmist claims and supposedly were not cataloged by Idso at co2science.org. But, keep in mind that a few stray conflicting studies will not likely have much impact, because, as the previous link demonstrates, there are, during 1975-1998, a number of regions showing no increasing warming.
There is another question regarding the assumptions used in the alarmist computer models. The greenhouse gas theory, if applied to the open atmosphere, carries with it a critical caveat: there must also be an accompanying warmer region about 10km above the tropics.
Despite decades of radiosondes that “hot spot” has never been found, and this is not a matter of missing data. The radiosonde temperatures cover various altitudes including above 10km.
Occasionally some proponent of anthropogenic catastrophic warming claims to have found that “hot spot”. (Alarmists apparently do not otherwise bring up that subject.) But the folks making such a claim stretch their credibility beyond the breaking point by (1) ignoring the actual data, and (2) replacing the data with speculation (which is NOT evidence).
There is another issue. The alarmist computer modelers insist on including the water vapor feedback assumption when the applicability of GHG theory to the open atmosphere is itself in question (no “hot spot” detected, also satellites detect heat escaping to space). Without water vapor feedback, the potential warming threat is greatly diminished. Ironically, this is currently reflected by the widening difference between computer model projected and the subsequent actual recorded temperatures.