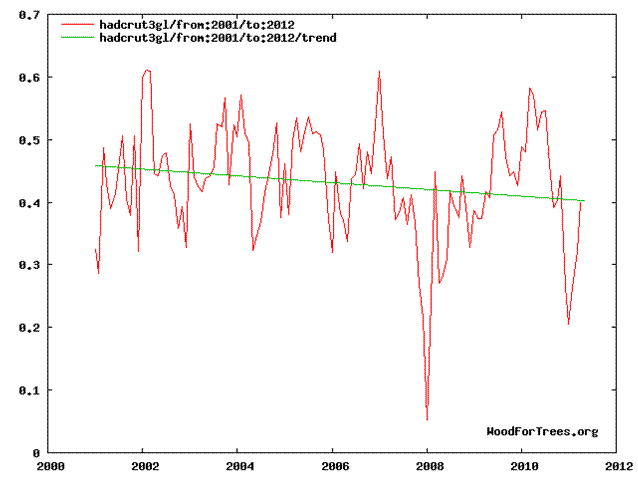
Much of the German media have been screeching and hyperventilating today about CO2 emissions reaching a record high, see FOCUS or TAZ here or Die Zeit here or Der Spiegel here, to name a few.
All the dregs are at it, making dire 100-year predictions based on silly climate models that have been proven to be wrong time and again. Warmists are gasping in panic screaming “time is running out and they we’ve got to act now!” Where’s the Valium? Take a look at the global temps:
The International Energy Agency (IEA) reports that CO2 emissions rose 1.6 billion tons in 2010, the highest since record keeping began. Total CO2 emissions last year were 30.6 billion tons globally, up 5% from the previous record set in 2008.
Face it – the record emissions are good news and are an indicator of global economic growth and vitality. That’s what normally happens when the economy grows – more energy gets consumed to do more work. Let’s hope the trend continues. Don’t worry, CO2 will not cause the temperature to go up that much. The science behind global warming and tipping points is JUNK.
Indeed the temperatures are not cooperating, and they are not about to for a couple more decades. Time to go back and redo the science.


Clouds seem to say the sun did it
http://chiefio.wordpress.com/2011/05/30/cloud-seems-to-say-the-sun-did-it/
Co2 increase at Mauna Loa seems to be slowing. Over the last 10 years the increase was 2.1 ppm per year. Over the last year it was 1.9 ppm. It certainly is not increasing.
Could be that fast increase in CO2 emission is also snapped fast by the plants and trees, so net emission is low. And since more CO2 means more plant growth, it is possible that CO2 concentration from the current 390+ ppm may not even reach 500 by the end of the century?
Too funny. Boss Malthusian Weizsäcker blasts Borlaughs Green Revolution and calls for “the discovery of frugality”; wants us to become less like Americans (who consume too much he says) and more like… the Khmer Rouge!
No, only kidding… he says… more like… the FRENCH! (because they ENJOY their food so much and consume less calories)
Now, if only the Malthusians would shut up forever after having forced me to live like the French i’d be happy with that. I can tell you that the piece of Boeuf (beef) i had last year in Lyon was de-li-cious (and huge); the same goes for the Tuna and all the rest…
http://www.fr-online.de/panorama/die-entdeckung-der-genuegsamkeit/-/1472782/8426544/-/
Let’s see – April 2010 at Mauna Loa, CO2 @ 389.79 ppm; April 2011 CO2 @ 390.49 ppm. (ftp://ftp.cmdl.noaa.gov/ccg/co2/trends/co2_mm_mlo.txt from WUWT)
Gee. All that CO2 that we’ve been belching out, and total CO2 in the atmosphere shot up by what…0.7 ppm? That’s…0.18%? Oh, we are doomed right here in River City!
Will this junk never cease?
Disgusting.
Article on Der Spiegel about the end of the Viking settlement period of Greenland.
They refer to a study by William D’Andrea et al who have analysed sea sediments in direct proximity to the settlements, proving the MWP and the LIA.
http://www.spiegel.de/wissenschaft/natur/0,1518,765774,00.html
Thanks – now my latest post!
You’re cherry picking a 10 year time frame. 10 years is not enough to show a trend.
Use some real graphs:
http://data.giss.nasa.gov/gistemp/graphs/
Neither is 100 years. And Hansen’s charts aren’t worth the ink they’re printed with.
To be real honest, we need to use 10,000 year chart:
http://www2.tu-berlin.de/~kehl/project/lv-twk/002-holozaene-optima-und-pessima.htm
Boy, that’s one heck of a correlation, aint it!
And read my latest post (about a story your leftwing media kooks are ignoring).
Bottom line is: no temperature increase in over 10 years. No model predicted that. You guys are looking more and more like complete fools with every passing day.
Might want to check this out
http://thegwpf.org/best-of-blogs/3115-1979-prediction-warming-trend-until-the-year-2000-then-cooling-.html
“1979 Prediction: Warming Trend Until The Year 2000, Then Cooling” – A prediction made in 1979
@Chris Bowman:
“You are cherry picking a 10 year time frame”
No, he’s not.
The temperature trends projected are directly connected to the ocean cycles:
http://www.climate4you.com/images/PDO%20AnnualIndexSince1900%20With7yearRunningAverage.gif
This downward trend will continue as the PDO continues it’s negative cycle and the Atlantic follows suit.
I really can’t see any cherry picking here.
What is cherry picking IMO is the fact that you warmists ignore hard facts.
Always steering around them.
Old prediction might fit current trend
http://wattsupwiththat.com/2011/06/01/old-prediction-may-fit-the-present-pattern/