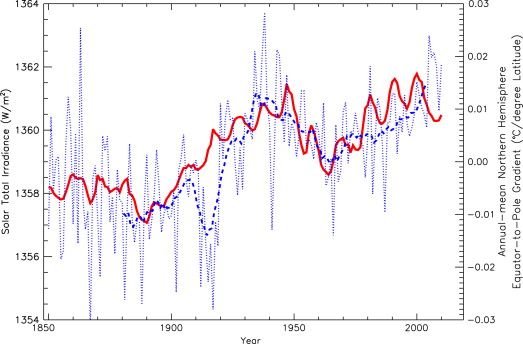
Sun reveals its full climate power: Equator-pole temperature gradient fluctuates in sync with the sun
By Prof. Fritz Vahrenholt and Dr. Sebastian Lüning
(Translated with permission by P Gosselin)
The geological factual basis is clear: Fluctuations in solar activity significantly influenced the development of the climate throughout the history of the Earth.

Figure 1: Solar activity (red) in sync with the North Pole-equator temperature gradient (blue). Chart from Soon and Legates 2013.
Today’s IPCC is clueless. With its simplistic approach, the IPCC is not able to reproduce the documented climate fluctuations of the past. The gross fundamental errors aren’t of any help at all for the most powerful computers. In the search for additional links in the sun-climate-impact, Willie Soon of the Harvard-Smithsonian Center for Astrophysics and David Legates of the College of Earth, Ocean, and Environment at the University of Delaware came across an exciting relationship. In a mutual study that appeared in the February 2013 Journal of Atmospheric and Solar-Terrestrial Physics, the scientists were able to show a relationship between solar activity fluctuations and the temperature gradient between the North Pole and the equator over a timescale of multiple decades.
This means that the craft of modelling has got lots of homework to do. Up to now the models have not been able to simulate this effect. Now they are forced to check over, sort out, supplement, and improve their formulas. It’s back to the drawing board!


Have you read it?
http://wattsupwiththat.com/2013/03/06/february-solar-data-shows-the-sun-to-still-be-slumping-but-nasa-says-twin-peaks-may-happen/
“The data from SWPC is in, and it is lethargic at best. Sunspot numbers took a hit, down to about 42, a delta of ~50 lower compared to the red prediction line.”
The winter is coming…
Not quite sure how to interpret that temperature gradient chart.
Are we to understand that there are periods not so long ago when the temperature gradient was actually negative i.e. that the temperatrure was higher at the pole than it was at the equator?
That right-hand scale must be an anomaly scale, deviation from the mean over the whole time period. I know. It doesn’t say that. But that’s the only thing that makes sense.
Don’t you mean the temperature anomaly???
The anomaly (or deviation) from the average gradient.
Let it be 25 Celsius at the equator and minus 20 Celsius at 90 North. The difference is 45 Celsius, to be divided by 90, which gives a gradient of half a degree Celsius per degree latitude. Is this OK as example? It is obvious that Ed is correct but the deviation scores are pretty small. My question is of whether the rough relationship should not be considered almost trivial. At the equator the sun is above your head and at the North pole near the horizon. The STI difference must be related with STI in a simple manner and next with the gradient. Annual deviations may have to do with clouds and oceans.
Potocznik, the craziest EU Kommissar (you remember him from his attempts at reducing tap water flow across the EU), wants to impose EU-wide extra taxes on plastic bags and allow member states to prohibit them entirely.
http://www.zeit.de/wirtschaft/2013-03/plastiktueten-muell-steuer-kommission
Difficult to say whether he just wants to make life harder for 500 mill people or whether his job is to open up the gates for the EU’s own taxation system. Probably both.
(I think I already pay an entire array of taxes on plastic bags in Germany; still, their marginal value exceeds the price.)
Wrong thread I think! Unless plastic bag numbers also drive the temperature gradient.
1, 2, 3 counting wow Svaalgard isn’t here yet! … maintains that the solar changes have nothing to do with climate!
[…] https://notrickszone.com/2013/03/07/vahrenholt-luning-todays-ipcc-is-clueless-ipcc-models-unable-to-r… […]