The Carbon Cycle, Nature or Nurture – Part 2
By Ed Caryl
In the last post, The Carbon Cycle, Nature or Nurture, sea surface temperatures were shown to have a large influence on CO2 rise in the atmosphere. This influence is so large, that changes in fossil fuel burning cannot be seen. In this article, the sea surface temperature influence will be subtracted to examine what remains in a continued search for man’s impact.
To begin that search, the first step is to annualize the sea surface temperature and the change in CO2. This results in Figure 1.
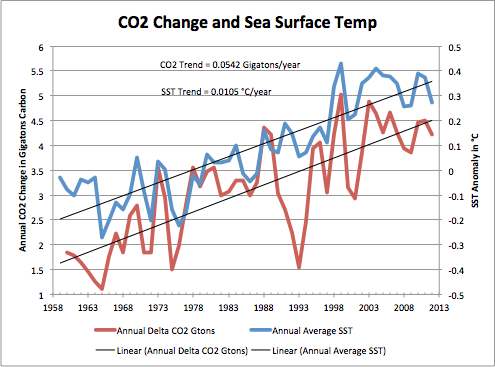
Figure 1 shows the annualized data for sea surface temperature and CO2 change.
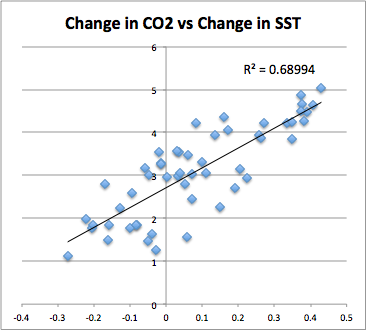
Figure 2 is a scatter diagram of annualized SST anomaly versus CO2 change. Note the R2 value near 0.69.
1960 is near the beginning of the modern rise in CO2 that concerns everyone. It is assumed for this exercise that the sea surface temperature before the CO2 rise began was 0.1°C below the temperature anomaly baseline, and that the SST trend of 0.0105°C equals the CO2 trend of 0.0542 Gigatons per year. With those values assumed, the SST influence can be subtracted, resulting in Figure 3.
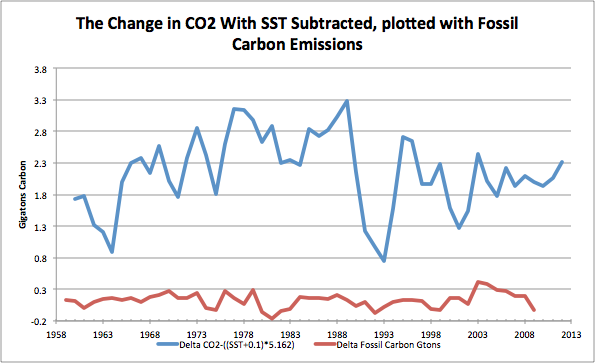
Figure 3 is the change in CO2 with SST influence subtracted.
The features on the blue trace are dominated by volcanic activity. From left to right, the negative, cooling peaks are due to Mt. Agung in 1962 to 1964, Fuego in 1971 and 1975, Mt. St. Helens in 1980, El Chichon in 1982 to 1984, Mt Pinatubo in 1991 to 1993, and a cluster of volcanoes in 2000 to 2002, dominated by Soufriere Hills and Nyamiragira. All these were large stratospheric sulphur dioxide sources. Mt Pinatubo was the largest, injecting 20 Megatons of SO2 into the atmosphere.
Oh yes, I nearly forgot. What about man’s influence?
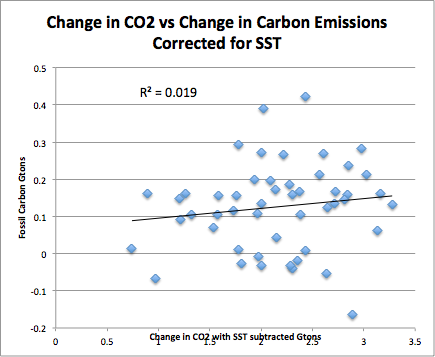
Figure 4: Man’s influence on CO2 in the atmosphere after subtracting SST. R2 = 0.019.
That near zero R2 illustrates that man’s changing carbon emissions do not appear in the overall CO2 data, especially after removing SST influence. Man’s contribution is totally absorbed in the biosphere in real-time. There is no anthropogenic signature. Any carbon emission change is invisible in SST driven change and the continuous noise provided by volcanoes. There is no persistence, no CO2 lifetime beyond the present year. Man does not add to the load. All the “green” efforts are silly, misguided, but hideously expensive exercises in futility. Nature is producing all the CO2, and when the sun stops driving sea surface temperatures, CO2 will fall again.
“The true beauty of nature is her amplitude; she exists neither for nor because of us, and possesses a staying power that all our nuclear arsenals cannot threaten (much as we can easily destroy our puny selves).”
Stephen Jay Gould, in Bully for Brontosaurus (1991), Prologue


Derivative of 12 month mean of Mauna Loa chart vs SST, since 2000.
http://www.woodfortrees.org/plot/esrl-co2/mean:12/derivative/detrend/from:2000/plot/uah/scale:0.5/from:2000
I was looking for a downswing in the CO2 derivative during the big financial crisis of 2007/2008 . If human emissions were the driver of the rise in CO2 one would have to see it very significantly in the derivative as a negative impulse, as economic activity diminished gravely in the developed world (for instance about -5 % GDP in Germany in 2008).
Nothing to be seen. Only a similarity between SST and derivative of CO2.
Solid! Although I realize that it night not apply, is there a p value available for the correlation coefficients?
Also, these data raise the issue of exactly what is causing the rise in sea surface temperatures. It is obviously not AGW but (I assume) increased irradiance from the sun. I would also assume that there would be a lag time before increased irradiance would result in a rise of SSTs. Such a correlation between increased irradiance and increased SSTs (which were shown above to correlate with the rise in CO2) would add one more piece to the puzzle AND drive one more nail into the AGW coffin.
Thanks, Pierre,
Bobw,
The r-squared value in figure 2 is 0.68994. So r=0.83 and the p value given 50 points is 0.0 for both one and two tailed distributions. The calculator is found here.
http://www.danielsoper.com/statcalc3/calc.aspx?id=44
For figure 4, r=.138 and
One-tailed probability: 0.16960954
Two-tailed probability: 0.33921907
I am looking at the irradiance problem.
Ed, your opponents could say that SST is caused by CO2 level (missing heat). In that case your Figures 3/4 become meaningless. You could have used variables that cannot have a human cause, like solar irrediance. On what basis do we know that the human contribution is a few percent? If that number were true, Dirk’s negative result becomes understandable.
Dirk’s negative result was just a repeat of my result in Part 1. Figure 4 is a further proof. There is no reflection of the changes (differential) in our emissions in the CO2 Differential. If our emissions were causing the increase in CO2, then we should see some relationship. We don’t. Subtracting SST changes still doesn’t reveal a signal. I doubt that subtracting volcanic SO2 would reveal anything, and if you could, that would only prove that volcanic SO2 does more than CO2 emissions.
I’m working on the solar irradiance relationship. (As are many others. I don’t expect a break-through.) Sunspots are not the whole answer. There is a relationship, but it is not very strong. The measured TSI record is simply too short to prove anything. The historical solar minimums happened before there was good recorded data. Without recognized good data, pointing them out to the “Climate Scientists” is pointless.
What’s the explanation for the seasonal variation of the CO2-level?
I find it also interesting that there seems to be similar but inverse varitation in the NSIDC SH sea ice index: http://www.woodfortrees.org/plot/esrl-co2/from:1997/normalise/offset:0.3/plot/nsidc-seaice-s/from:1997/normalise
Is this a coincidence or a relationship?
The CO2 seasonality is due to the land and sea hemisphere distribution. Most of the land biosphere is in the northern hemisphere and most of the ocean biosphere is in the Southern Hemisphere, so in the northern hemisphere spring and summer, the northern hemisphere land plants are taking up CO2, while the Southern Hemisphere ocean is releasing less. The seasonality is higher at Barrow, and much less at the South Pole.
Hmm, I thought that since the SH consist most of the ocean biosphere, the inverse relationship between the SH sea ice index and the CO2-level specifically signals the relationship between SH sea surface temperature and the CO2-level, thereby providing additional evidence of the role of the natural variations due to sea surface temperature on a seasonal scale.
No, the SH sea ice index is simply the result of summer and winter.
I found this information, particularly the illustration quite interesting:
http://www.esrl.noaa.gov/gmd/ccgg/globalview/co2/co2_intro.html
As you said, if you follow the CO2 level in SH there is not much of seasonal fluctuation but when it comes to the NH…
Pierre, the first link (to the post The Carbon Cycle, Nature or Nurture) does not work.