Temperature change in perspective
By Ed Hoskins, MA (Cantab) BDS (Lond)
The UK Met Office long term Central England Temperature record has kept a continuous and consistent data set since the 1660s. It appears to be reliable and to have maintained its quality. It has not been adjusted as have so many other official temperature record.
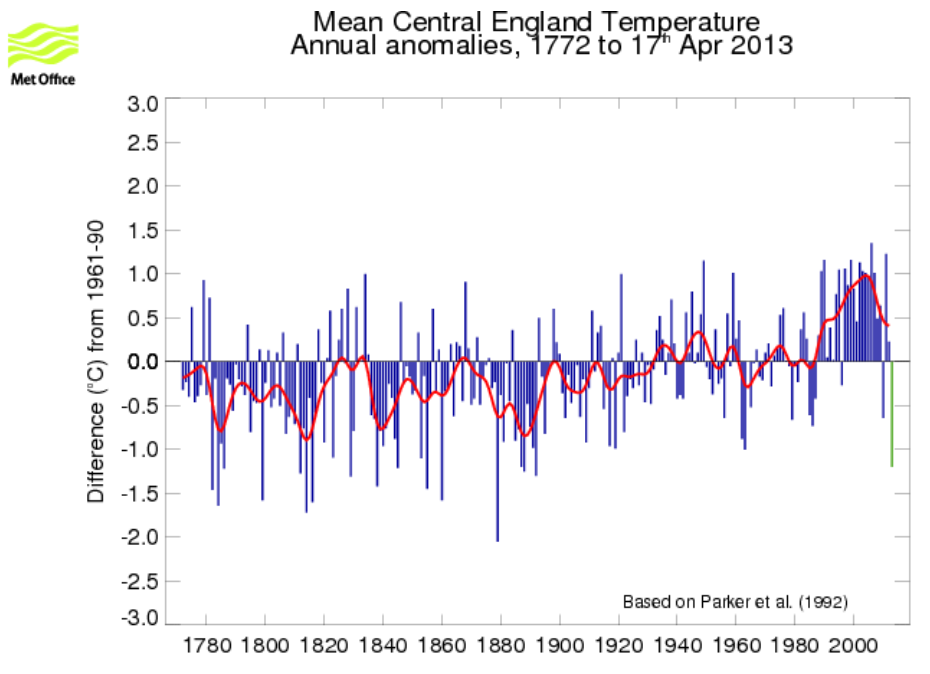
Although the CET record covers only a small part of the northern hemisphere, it has shown a consistent rise since the end of the Little Ice Age in 1850 at a rate of about +0.45°C/century or about +0.67°C in the last 150 years. This rise accords well with other temperature records.
However since the year 2000, diminishing solar activity in solar cycle 24 (moving back towards little ice age patterns) appears to be having a real effect.
So since 2000 the CET shows an annual temperature diminution at the rate of -0.49°C/decade or -0.59°C in 12 years: this negates almost the entire CET temperature rise since 1850. Although this is a very short period, the extent of the climate change that has been observed since the turn of the millennium is remarkable.
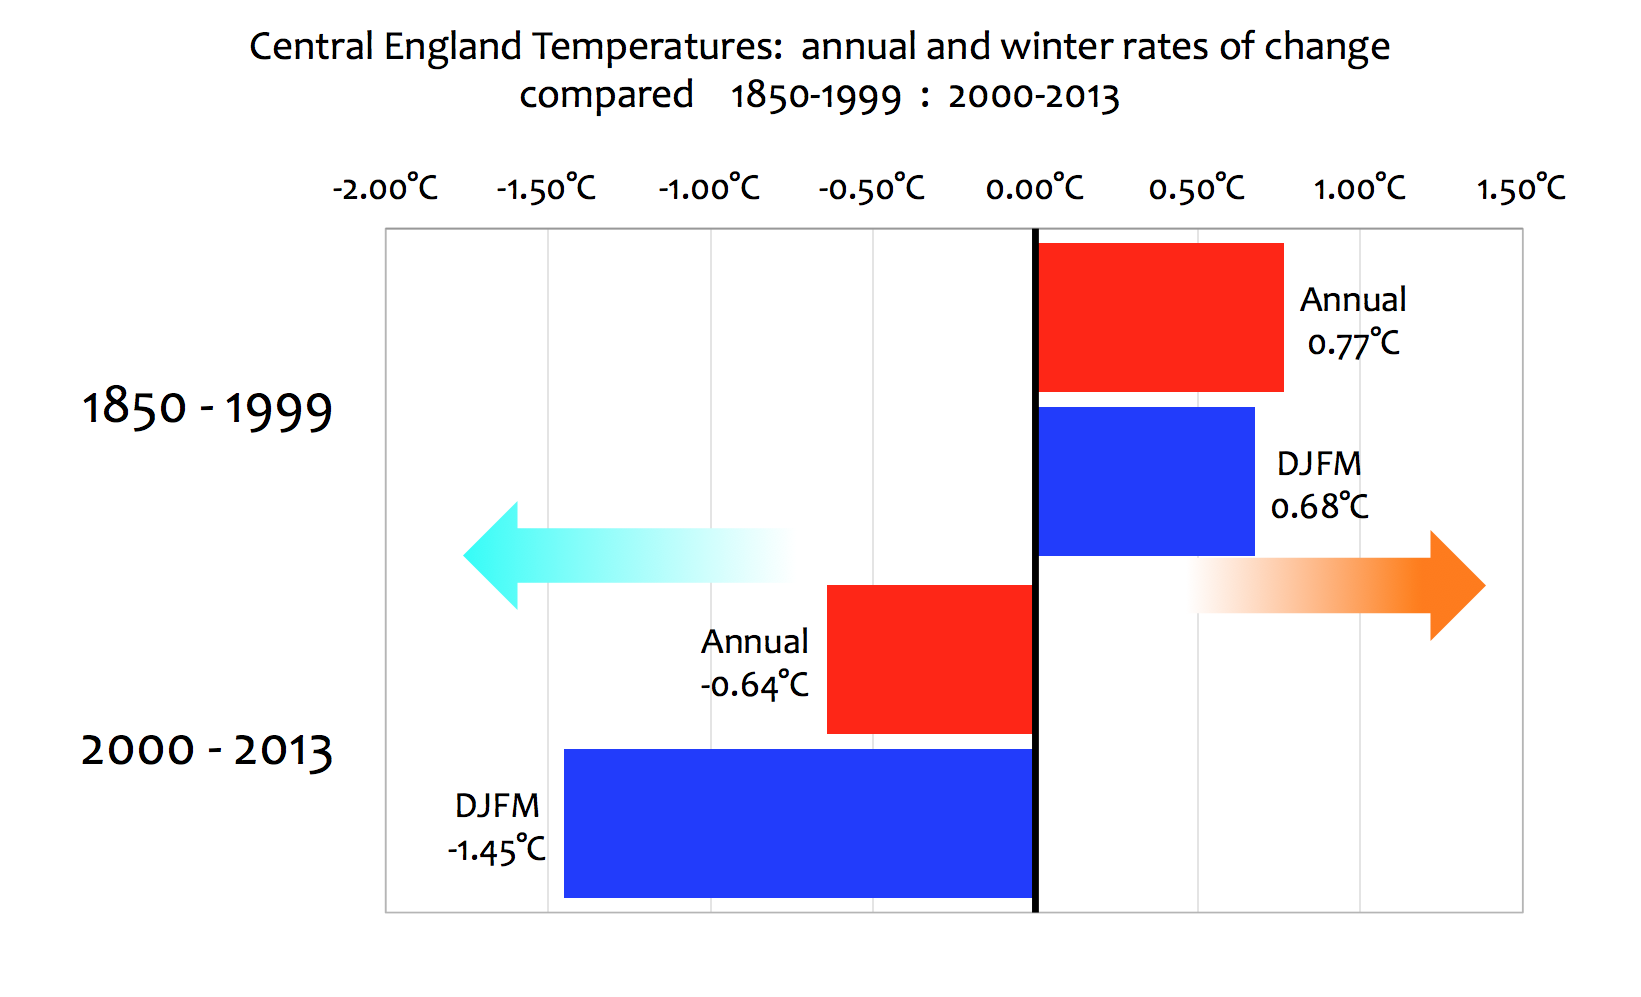
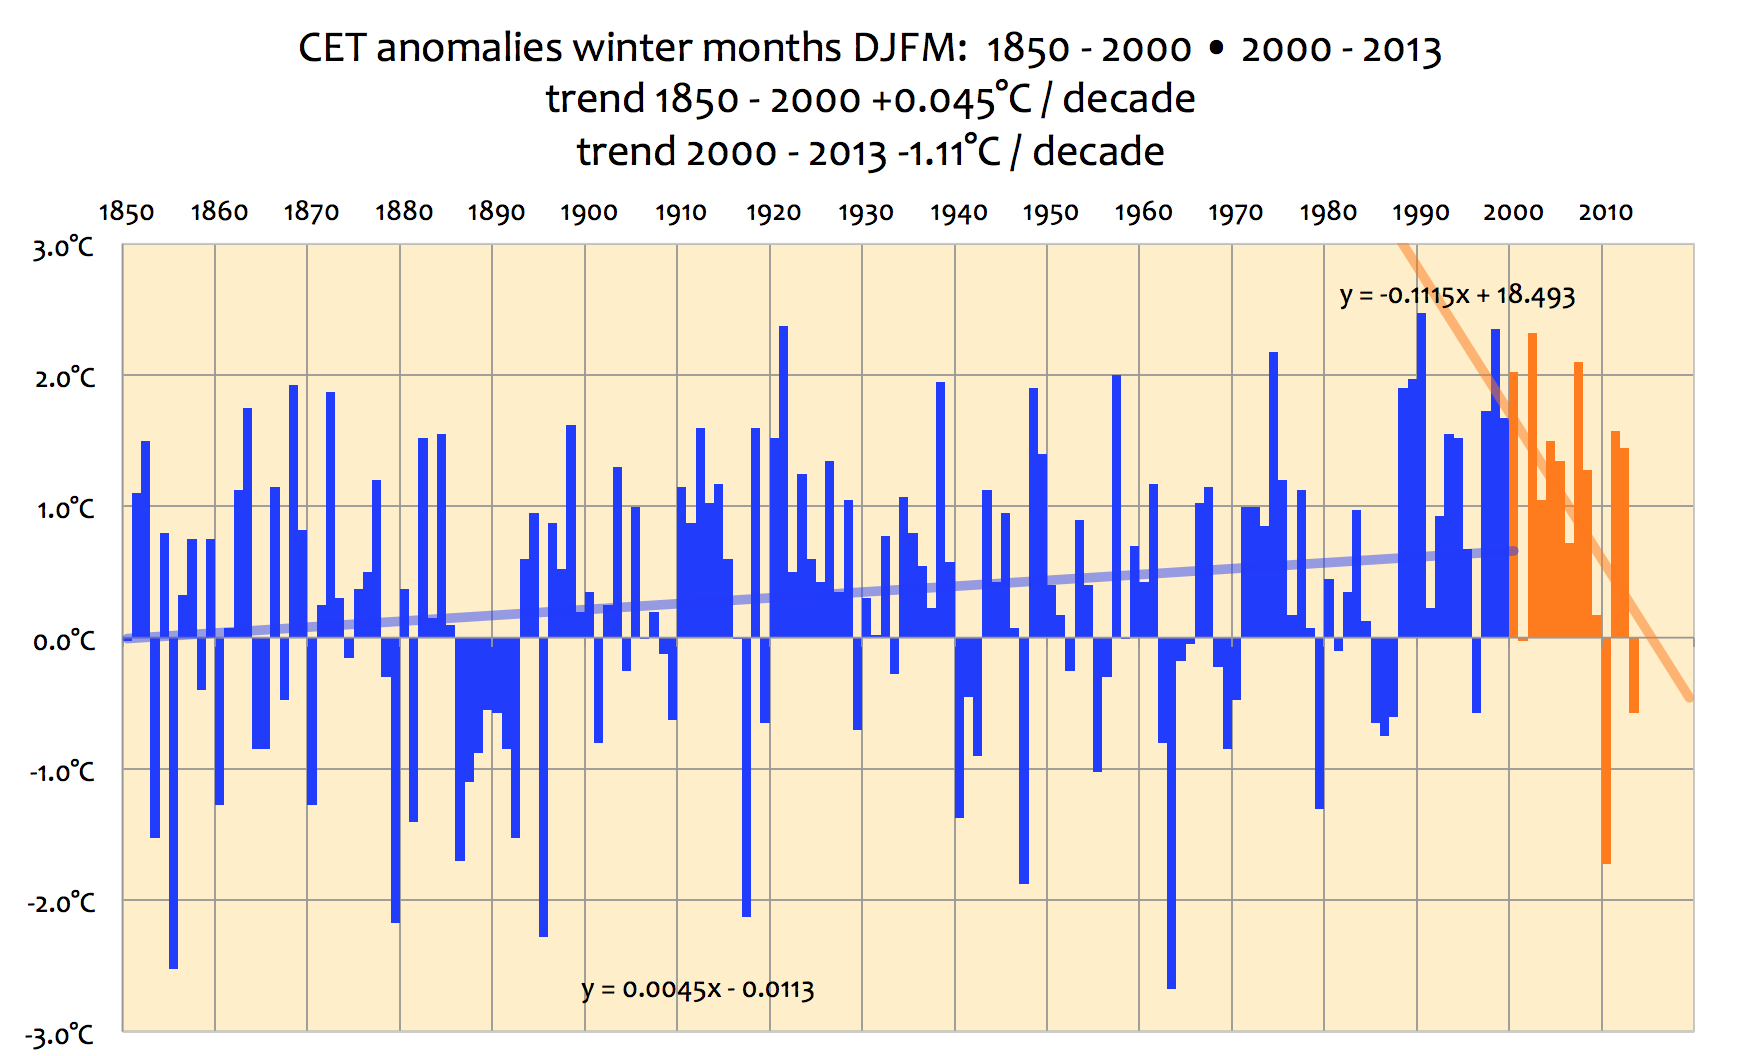
Using the March 2013 CET value, it is possible to show the winter temperature values up until March 2013 with a combination of the four months December – March for the first 13 years of this century. The diminution of the four winter months temperatures is more remarkable at a rate of -1.11°C/decade or -1.41°C in the last 13 years. This compares with a winter temperature increase rate from 1850 to the year 2000 of +0.45°C/century or +0.68°C for the whole 150 year period.
There are substantial shorter term fluctuations in temperature, and since about 1850 world temperatures have been recovering from a Little Ice Age up by about +0.7°C up until the year 2000. These fluctuations have correlated well with solar activity observable by the number of sunspots. There was a particularly active solar period from about 1970 onward coinciding well with sunspot cycles 21 – 22 – 23: it led to comparatively rapid warming.
However the current cycle 24 is very much weaker and sunspots are diminishing to the levels of the earlier Little Ice Age.
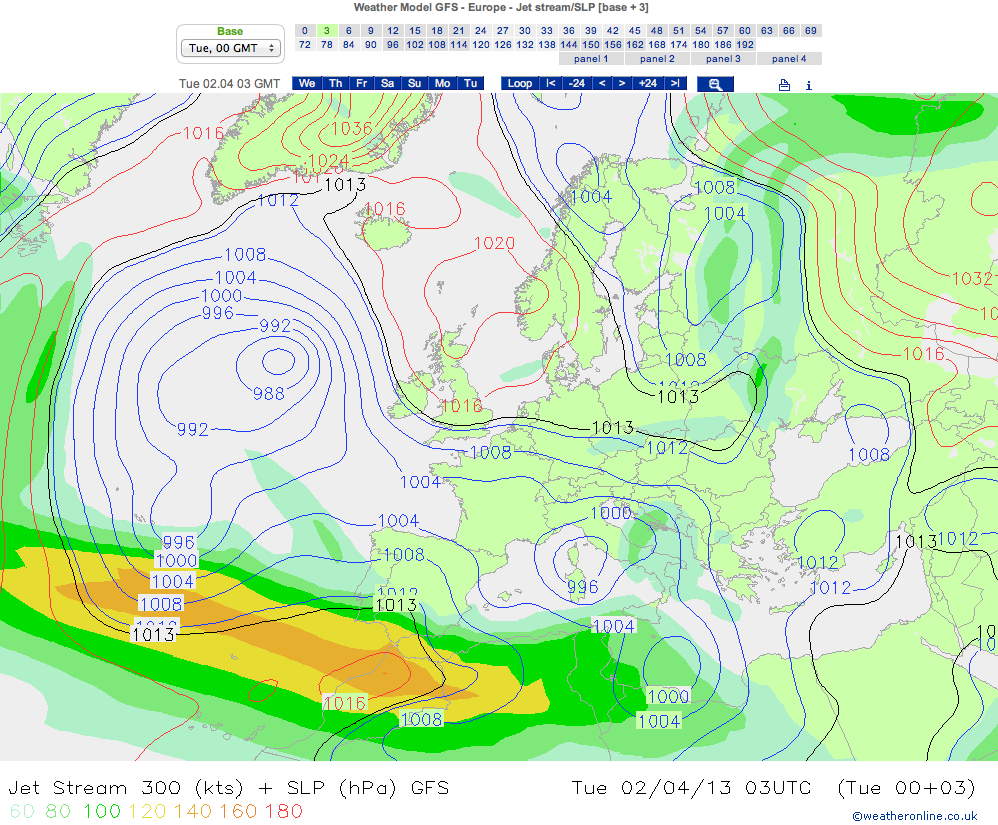
According to some [2]: “so begins a Little Ice Age”. These colder conditions lead to a southwards diversion of the Jet Stream over Europe, as could be seen on 2/4/2013 [3], when the upper atmosphere air flow was passing over Northern Africa, rather than to the North of Scotland as is normal in warmer times.
Such a jet stream pattern leads to very wet summer conditions and remarkably cold winters as have occurred in the last 5 years throughout Northern Europe and the rest of the Northern hemisphere. This adverse colder climate could well persist for decades or even hundreds of years, as it certainly did for the pervious Little Ice Age.
Humanity has thrived in our current Holocene interglacial world. The comparatively warm last 10,000 years have been responsible for the development of the whole of civilisation. The GRIP [4] Greenland ice core data, supported reinforced by several other similar long term ice core records, show this effect very clearly.
Over the past 10,000 years the current Holocene epoch has been progressively cooling since the early “climate optimum”. Overall in the 10,000 years the world has cooled gradually by about 1.0 °C. There were other well documented temperature high points during the period, including the Minoan, Roman and Medieval warm periods.
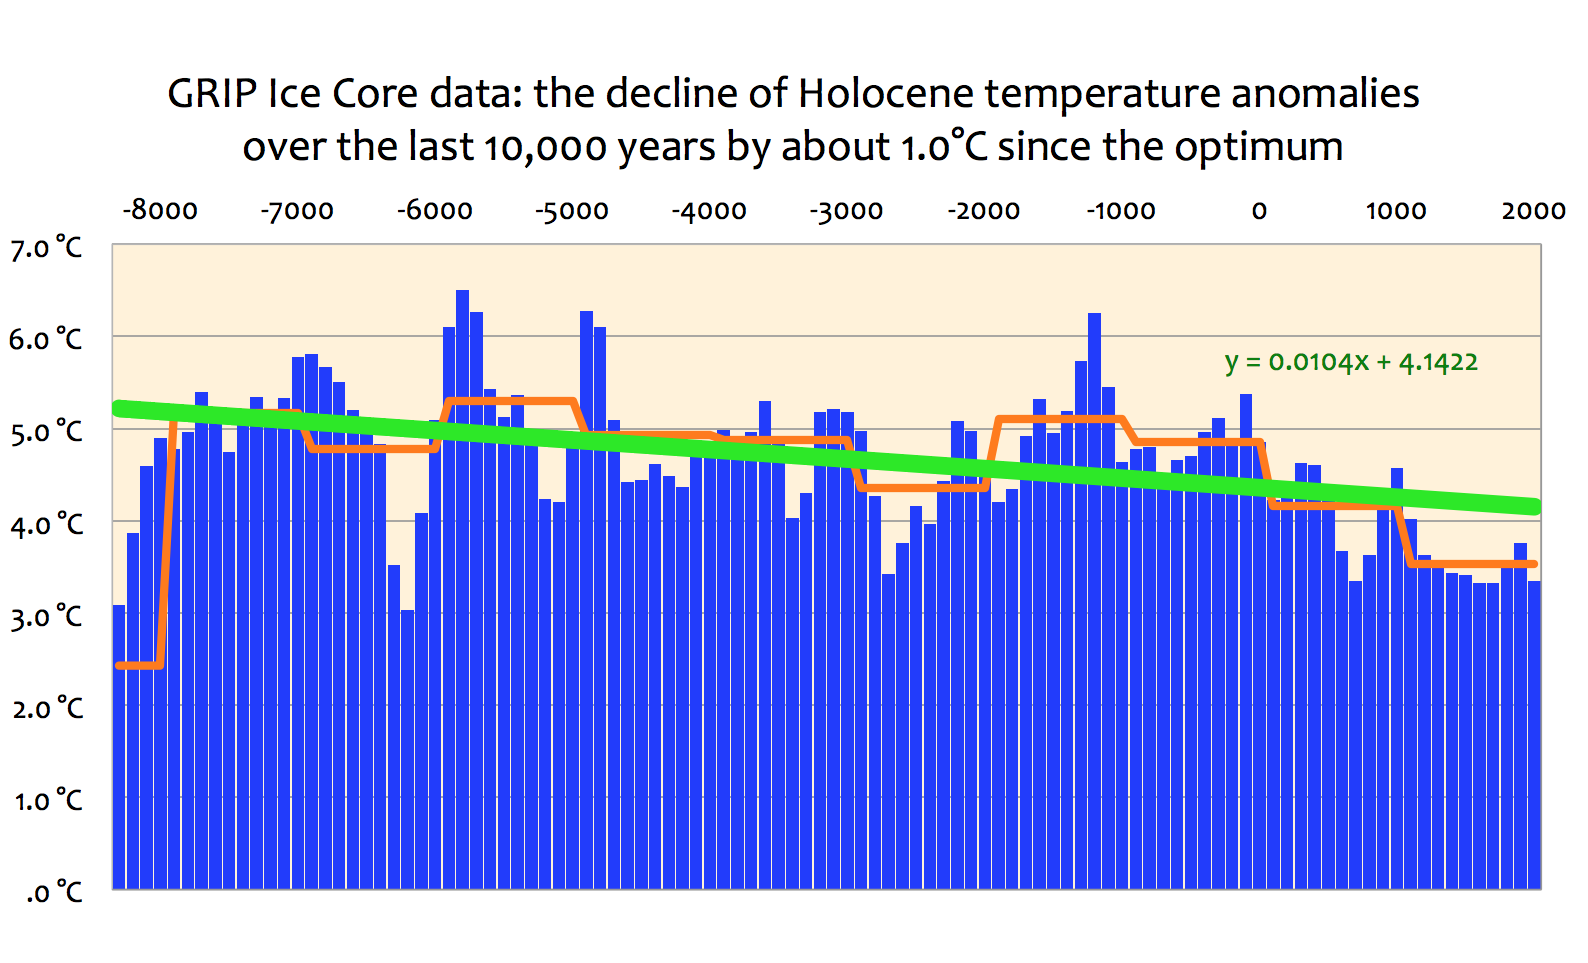
However the most recent period of 1000 – 2000 AD was the coolest millennium of the whole epoch: see John Kehr the Inconvenient Sceptic [5].
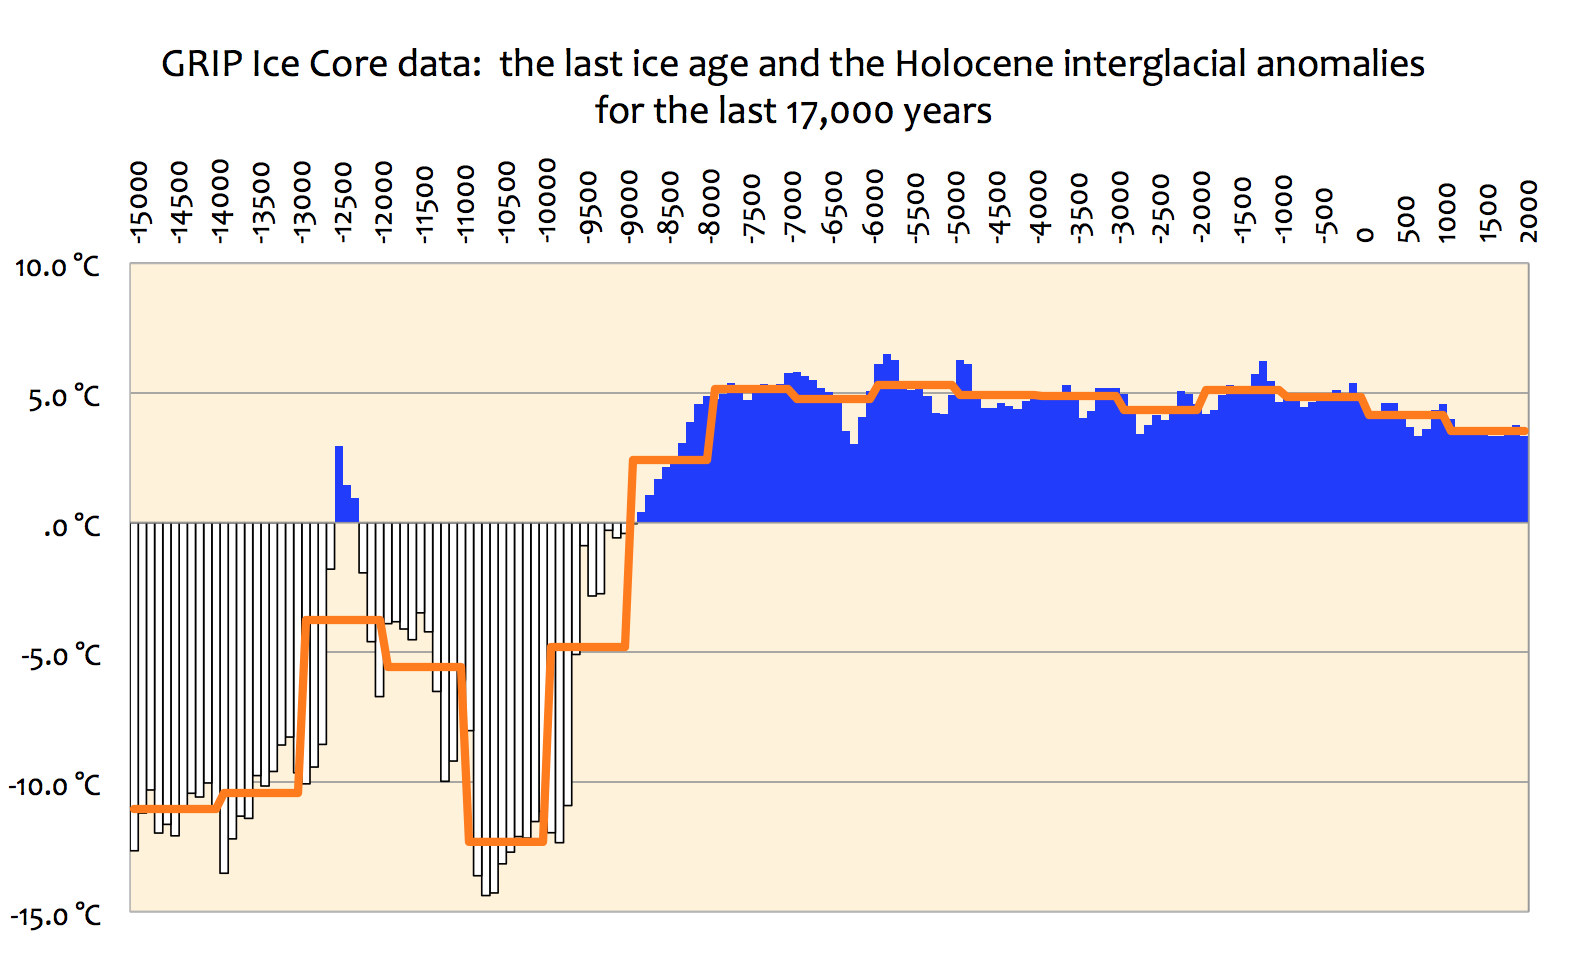
A longer term record shows that only 13,000 years ago the world was in the depths of a real ice age with temperatures about 12°C lower than at present.
So interglacial periods of about 12,000 years have been occurring regularly about every 120,000 years. They are interspersed by real 100,000 year long ice ages, when vast ice sheets cover large parts of the world.
The previous Eemian interglacial epoch was some 130,000 years ago. At its peak it was about 3°C warmer than our current Holocene interglacial: hippopotami thrived in the Rhine delta. The Eemian also lasted about 12,000 years.
The pattern repeats itself [6], there have been 5 interglacial events in the last 500,000 years.
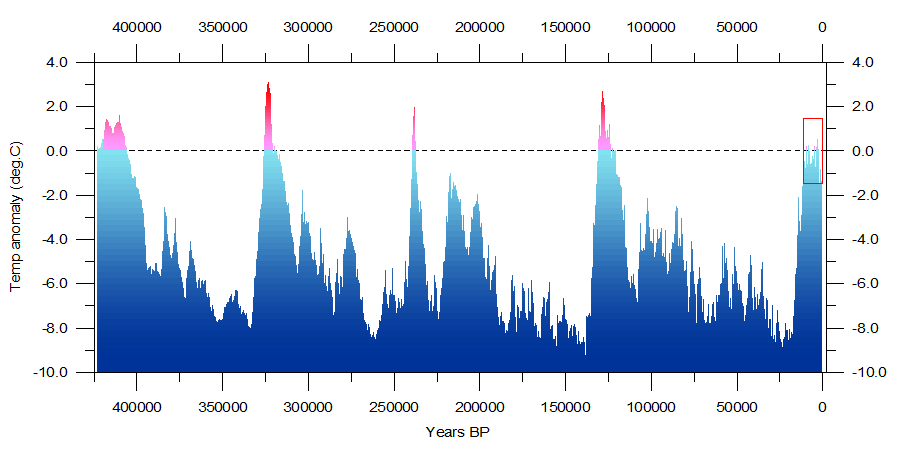
At ~10,500 years our current cooler but benign Holocene interglacial is coming towards its end and the reversion of our planet to a real ice age is foreseeable.
[1] see: www.metoffice.gov.uk/hadobs/hadcet/
[2] see: www.weatheraction.com/displayarticle.asp?a=525&c=5
[3] see: www.woeurope.eu/WMO=
[4] see: www.ncdc.noaa.gov/paleo/icecore/greenland.html
[5] see: theinconvenientskeptic.com/chapters-8-10/
[6] www.climate4you.com, geoweb.princeton.edu/Petit_et_al_1999_copy.pdf


The onset of a Little Ice Age implicit in this discussion would be bad enough, but do these data and observations strengthen the possibility of a real Ice Age?
Hope not.
Prediction are not easy but you could be right. The question would be, how fast.
I could also see a possibility of a little ice age scenario for say 100 – 200 years and then straight into a real Ice Age.
Anything is possible.
When was the last time we had a combination of a really quiet sun, negative PDO and AMO? Many scientists are expecting flat or slightly dropping temperatures over the next couple of decades, but we should not be surprised if we get a 1°C cooling, i.e. temperatures we last saw early in the 20th century. We’ll soon find out!
CET has actually been adjusted, being corrected for UHI (by Jones ;)).
There has been no net warming since 1997 with CO2 up more than 8%.The earth entered a cooling trend in about 2003 which is likely to last 30 years and perhaps for hundreds of years more. Here are the summary conclusions from my post “Global Cooling- Methods and Testable Decadal Predictions” on my blog at
http://climatesense-norpag.blogspot.com
3. Summary
1 Significant temperature drop at about 2016-17
2 Possible unusual cold snap 2021-22
3 Built in cooling trend until at least 2024
4 Temperature Hadsst3 moving average anomaly 2035 – 0.15
5 Temperature Hadsst3 moving average anomaly 2100 – 0.5
6 General Conclusion – by 2100 all the 20th century temperature rise will have been reversed,
7 By 2650 earth could possibly be back to the depths of the little ice age.
8 The effect of increasing CO2 emissions will be minor but beneficial – they may slightly ameliorate the forecast cooling and help maintain crop yields .
9 Warning !! There are some signs in the Livingston and Penn Solar data that a sudden drop to the Maunder Minimum Little Ice Age temperatures could be imminent – with a much more rapid and economically disruptive cooling than that forecast above which may turn out to be a best case scenario.
For links to the data and the peer reviewed papers supporting these forecasts check the other posts on Global Cooling and Climate on that same website.
Told you so:
“A change in global weather patterns which I noticed as long ago as 2000 whereby the jet streams moved back towards the equator from the positions they adopted during the warming spell. The observation that a global warming or cooling trend can be discerned from seasonal weather patterns seems to be unique to me.”
From here:
http://climaterealists.com/index.php?id=1396&linkbox=true&position=2
The Death Blow to Anthropogenic Global Warming by Stephen Wilde
Wednesday, June 4th 2008, 5:46 AM EDT
[…] From NoTricksZone […]
“If jet streams, on average, are further south then the high pressure systems to the north of them predominate and the globe is cooling. If, on average, they are further north then high pressure to the south of them predominates and the globe is warming.”
from here:
http://climaterealists.com/index.php?id=1458
“Weather is the key after all
Wednesday, June 18th 2008, 6:09 AM EDT ”
and as to how the sun achieves the required effect:
http://climaterealists.com/attachments/ftp/How%20The%20Sun%20Could%20Control%20Earths%20Temperature.pdf
“How The Sun Could Control Earth’s Temperature”
Monday, November 15th 2010, 8:26 AM EST
There has been no net warming since 1997 with CO2 up more than 8%.The earth entered a cooling trend in 2003 which will last for 30 years and perhaps for hundreds of years more . Here is a summary of the conclusions of my post “Global Cooling – Methods and Testable Decadal Predictions” from my blog
http://climatesense-norpag.blogspot .com.
3. Summary
1 Significant temperature drop at about 2016-17
2 Possible unusual cold snap 2021-22
3 Built in cooling trend until at least 2024
4 Temperature Hadsst3 moving average anomaly 2035 – 0.15
5 Temperature Hadsst3 moving average anomaly 2100 – 0.5
6 General Conclusion – by 2100 all the 20th century temperature rise will have been reversed,
7 By 2650 earth could possibly be back to the depths of the little ice age.
8 The effect of increasing CO2 emissions will be minor but beneficial – they may slightly ameliorate the forecast cooling and help maintain crop yields .
9 Warning !! There are some signs in the Livingston and Penn Solar data that a sudden drop to the Maunder Minimum Little Ice Age temperatures could be imminent – with a much more rapid and economically disruptive cooling than that forecast above which may turn out to be a best case scenario.
For links to the data and peer reviewd papers on which the predictions are based consult the series of posts on Global Cooling and Climate on the website linked above.
I suggest a lecture of a book by de-wiki-ed late Prof. Marcel Leroux “Global Warming – Myth Or Reality?: The Erring Ways of Climatology” (2005). Professor describes his theory of climate and weather, showing years ago the mechanisms for ENSO or PDO (he associates them with “Mobile Polar Highs” moving from poles toward tropics, and deciding about weather as well as about climate); he does not mention jet in this context. Anyway, interesting reading. He was not a fan of numerical modeling of circulation, pointing out that modelers rarely look at the real complexity of the outside world, and rather never put the reality into their models.
He indicated in the book that we were coming into cooling period, interesting, isn’t it? Before more data on cooling were recorded.
My small model of the CET is doing well. I recently updated it from 2009 to the end of 2012. At the moment the model has been running a few years in advance of the actual data but otherwise the curve over the last few years has matched the CET nicely. The first few months of this year have been very cold in the CET zone, which continues to fit the prediction.
I think it is running in advance because I use a composite PDO/AMO cycle whereas the AMO is more significant for the CET. The PDO turned early in the 2000’s but the AMO only did the same a couple of years ago.
If the next three years fit as well as the last three years then the CAGW meme will be completely dead.
O frabjous day! Al Gore was right, after all:
“Earth’s Core is Much Hotter Than Scientists Thought”
http://blogs.discovermagazine.com/d-brief/2013/04/25/earths-core-is-hotter-than-we-thought/
German Carbon fiber maker SGL carbon plunges to 2009 levels
http://www.handelsblatt.com/unternehmen/industrie/carbonfaser-hersteller-sgl-startet-mit-gewinneinbruch-ins-jahr/8127340.html
Reason is weak demand by wind turbine industry. I didn’t even know they use carbon fibers – I thought they were using glass fibre-polymer. Carbon fiber is ultra energy intensive to make. Wonder how long a wind turbine has to spin to produce the energy used in its making. Making carbon fibers is only possibly where you have extremely cheap sources of electricity… which are NOT wind turbines… as the electricity has to be reliable … and cheap…
Meanwhile, the warmest period was during the last interglacial period, which is an interval of warmer global average temperature that separates ice ages. At that time, around 130,000 years ago, it was a balmy 4.5 degrees Celsius (8.1 degrees Fahrenheit) warmer than today.
What I always find interesting is the obvious paradox that GHGs are supposed to create global warming through an unproven mechanism of backradiation involving no extra energy input BUT are supposedly also responsible for 83 % of the Earth’s radiation to space – IPCC AR4 quoting Kiehl Trenberth et al involving clouds ~13 % and GHGs ~70%.
The rest of the atmosphere – ~99% – is supposedly IR transparent and therefore emit no IR at all and thus cannot directly lose heat to space.
This has amazing similarities with the basic tenets of AGW – the Earth heats up by radiating less to space while in the majority of science things that radiate less are really cooling down !
The GHGs are responsible for global warming via an unproven mechanism of backradiation whilst also being responsible for 83 % of cooling.
It is difficult to comprehend why more GHGs will NOT cause more cooling given that the direct emissions to space from the surface through the atmospheric window is fixed at 17 % and only the amount varies with temperature of the surface and this as the fourth root of temperature so increases in W/metre sq are small.
This data is supposed to be correct according to satellites while backradiation remains a hotly contested hypothesis which smacks of perpetual motion.
What if El-Nino related releases of heat from the oceans to the atmosphere combined with lower solubility of CO2 in water is actually a mechanism resulting in global cooling after the released heat has radiated away over a period of time which is longer than the release period because of the low radiative capacity of gases ?
Liquid water contains enormous quantities of energy which it surrenders when it freezes. The oceans contain the majority of the “heat” on the Earth – the atmosphere is driven by the oceans not the other way round.
We all know this as it has been established in the basic properties of materials for a long time.
Water’s properties are simply amazing.
Specific Heat of 4 versus air of 1. Thermal conductivity of 0.6 versus air at 0.026.
Latent heat of fusion and evaporation versus none for air at ambient temperatures.
Polar molecule making it an excellent ionic solvent. It is also an almost universal solvent.
Has one of the highest densities of most liquids.
Freezes from the top down – one of the single most life giving properties of this amazing substance.
Why would anyone other than a moron or someone setting out to decieve chose CO2 as a controlling substance for climate over water ?
Over the last 400,000 years the natural upper limit of atmospheric CO2 concentrations is assumed from the ice core data to be about 300 ppm. Other studies using proxy such as plant stomata , however, indicate this may closer to the average value, at least over the last 15,000 years. Today, CO2 concentrations worldwide average about 380 ppm. Compared to former geologic periods, concentrations of CO2 in our atmosphere are still very small and may not have a statistically measurable effect on global temperatures. For example, during the Ordovician Period 460 million years ago CO2 concentrations were 4400 ppm while temperatures then were about the same as they are today.
[…] Temperature Plunge Over The Last Decade…Are We On The Brink Of A Little Ice Age? Source: Sudden European Temperature Plunge Over The Last Decade?Are We On The Brink Of A Little Ice Age? , Temperature change in perspective By Ed Hoskins, MA (Cantab) BDS (Lond) The UK Met Office […]
[…] mind you). Global sea rise is predicted to be well below average by 2100. Europe is seeing a temperature plunge. And global temps have flatlined despite rising CO2 […]