Hysterical media, politicians, activists and scientists (e.g. Mojib Latif) tried to put the blame for the German flooding earlier this month on man-made climate change. But a recent doctoral dissertation shows that flooding in Southern Germany is very strongly related to solar activity. No correlation is found with CO2.
Source: Markus Czymzik doctorate dissertation, click here.
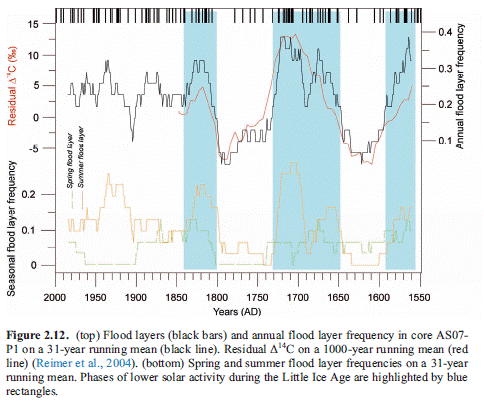
Flooding catastrophes at the Bavarian Lake Ammer occur predominantly during phases of weak solar activity
By Fritz Vahrenholt and Sebastian Lüning
(Translated, edited by P Gosselin)
How has flooding developed over the past? What factors have an impact on the development?
The simplistic assertion that “more CO2 means more flooding” simply does not hold water with respect to the complexity of the subject. Modeling studies should first start by reproducing the history of flooding in the past. There’s plenty of information available on past flooding. A series of research teams have surveyed numerous studies of calibration data.
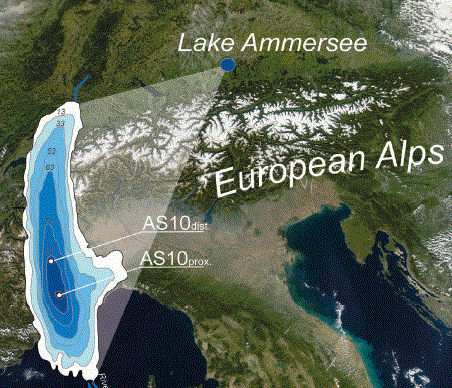
One of these studies took place at the geo-research center (GFZ) in Potsdam, Germany where Markus Czymzik determined the flooding history of Bavaria’s third largest lake, Lake Ammer, for the last 5000 years using sediment cores as part of his doctorate dissertation. The pdf file of the dissertation (English) can be downloaded at no cost. In his dissertation Czymzik explains why Lake Ammer is especially suitable for this type of study [translated from the German]:
Lake Ammer at the foot of the Alps forms an ideal archive for reconstructing flooding. Detritus material is transported by the Ammer River to the lower basin. The varved sediments allow a reliable detection and dating of microscopic flood layers. Instrumental flooding data of the Ammer and weather datasets of the Hohenpeißenberg Meteorological Observatory enable a calibration of the sediment data.”
Already in 2010 Czymzik together with colleagues had published an article in the journal of Water Resources Research (The paper is also included in the doctorate dissertation p. 10). In it the scientists present the flooding frequency development at Lake Ammer for the past 450 years. Much to their surprise an excellent correlation with solar activity is shown. Always when solar activity was weak was there increased flooding at Lake Ammer. Also in the new paper from February 2013 appearing in the Quaternary Science Reviews the scientists were again able to show this amazing relationship.

Flooding frequency of the Lake Ammer region (bottom) and solar activity (above) (from Czymizik 2012, dissertation). Phases of minimal solar activity are shown with a blue shaded background. Whenever the sun was weak (high C14 values, peak) flooding was more frequent.


Yes, it’s amazing what you find when actually looking at data!
It looks like they are using the relative abundance of carbon-14 (over the more typical carbon-12 isotope of carbon) to INFER the “phases of lower solar activity”, but no physical explanation for this inference is given here. There is no time series of “solar activity” presented, so the blue shaded regions appear to be a qualitative judgment of the widths of the carbon-14 peaks. This weakens the presentation, for the layperson or the non-specialist who nevertheless has high standards for solid, quantitative scientific evidence. Nor is a time series of CO2 shown, to justify saying there is no correlation of flooding with CO2, throughout the time period presented–indeed, while one may handwave that CO2 must have only increased since the industrial revolution, while variations in the flooding appear to have been tamped down in the last 150 years or so–thus the “lack of correlation”–one might just as easily say that man has taken increased control of the waterways, largely overriding natural variations. And unluckily (or coincidentally, or suspiciously), the carbon-14 graph stops just when the flooding is tamped down, in the mid-19th century, so we can’t tell from the material presented here just what “solar activity vs. flooding” has been since then (whether, in fact, natural variations have been supplanted by man’s designs). It is all observations in search of a science–par for the course, in “climate science”.
“…flooding in Southern Germany is very strongly related to solar activity.”
Correlation with solar activity? Imagine that!
What else could possibly be tied with solar activity? Oh, wait – I know. Nothing. That’s what the warmists keep telling us at any rate…
Re: Harry Dale Huffman
24. Juni 2013 at 15:36 | Permalink | Reply
“It looks like they are using the relative abundance of carbon-14 (over the more typical carbon-12 isotope of carbon) to INFER the “phases of lower solar activity”, but no physical explanation for this inference is given here. ”
“Here” meaning the information presented in this discussion thread, I guess, whereas the doctoral dissertation does contain the information you seek (e.. g.: p. 70 and 71), or are you suggestion that the disseration does not deliver what is being promised here?
NTZ, I am sure you are not surprised but you might be interested in the subsidies per kWhr of Solar energy produced, in 2011.
2011
18 TWHrs = 18 billion kWhrs produced
10.2 billion in solar subsidies
= 57 cents per kWhr in Subsidy. Here in the US we pay about 11-13 cents retail (except of course in Cali where it is much higher). It’s about 4 cents wholesale, or about 15x more to produce solar than traditional mix, and i am sure it is actually more than that considering backup and other etcetera’s
http://en.wikipedia.org/wiki/Solar_power_in_Germany
http://www.visajourney.com/forums/topic/401303-solar-subsidy-sinkhole/
Historical records and tests of C show (9) that during the past millennia solar activity varied considerably. In the recent thousand years these changes were characterized by the Great Maximum (AD 900 – 1300) and by the Minima of: Spoerer (AD 1420 – 1530) and Maunder (AD 1645 – 1715) (10,11). During the Great Maximum solar activity was much stronger than that observed at present in cycles 20th and 21st (a greater number of flares produces a higher level of solar cosmic radiation, this – in turn – causes greater disturbances within the terrestrial magnetic field, and hence an increased influence on the biosphere), while the two minima mentioned were much lower and more prolonged than the minimum in 1986 between the 21st and 22nd cycle.
It is simple.
Solar variations affect the global air circulation by altering stratosphere temperatures.
Active sun gives cooling stratosphere and poleward zonal jets for system warming.
Quiet sun gives warming stratosphere and equatorward meridional jets for system cooling.
That fits all known observations.
[…] https://notrickszone.com/2013/06/24/data-show-amazing-relationship-between-south-german-flooding-freq… […]
[…] Fonte: https://notrickszone.com/2013/06/24/data-show-amazing-relationship-between-south-german-flooding-freq… […]