By Ed Caryl
Henrik Svensmark wrote the book on cosmic rays, their possible effect on clouds, and thus effect on climate, as well as numerous papers on the subject. The CERN CLOUD experiment has looked for proof of the mechanism. A recent paper by Spencer and Braswell has looked at the relationship between clouds and temperature and found a nine month lag between a gap in cloudiness and El Niño temperature rises. Another pair of papers (Dragić et al) here and here, look at diurnal temperature variations within a few days of Forbush decreases. If cosmic ray variations result in cloud variation, which then result in temperature variation, then it is reasonable to examine the relationship between cosmic rays as seen in the surface neutron flux, and temperature.
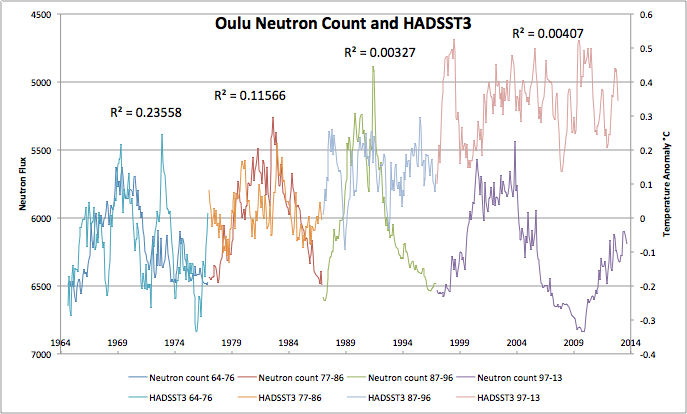
Neutron flux data was downloaded from the Oulu University Cosmic Ray Station web site. This data is available back to 1964 in several file resolutions. Here is a plot with monthly resolution compared to the HADSST3 sea-surface temperature data set.
Figure 1 is the Oulu Neutron count plotted with HASSST3. The Neutron count has been inverted so that warming is upward in both plots. Each solar cycle has been plotted in a different color and the R-squared values computed for each cycle.
The first observation is that for the first 22 years, there is a relationship between neutron flux and sea-surface temperature. But after about 1986 that relationship breaks down.
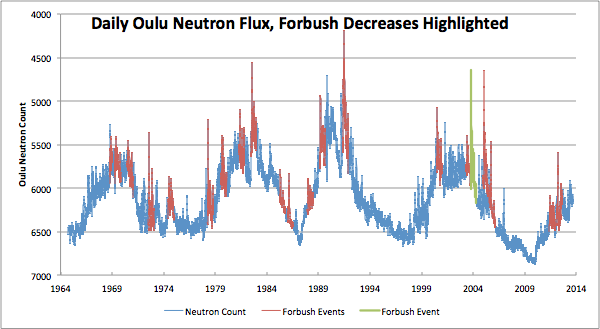
The monthly data plot in Figure 1 does not resolve Forbush decreases because they generally last but a few days. Figure 2 is a daily data plot with the Forbush decreases highlighted. Again, the plot is inverted to indicate warming in the upward direction.
Figure 2 is a plot of daily neutron count data with the Forbush Decreases highlighted in red and green. The vertical scale is inverted.
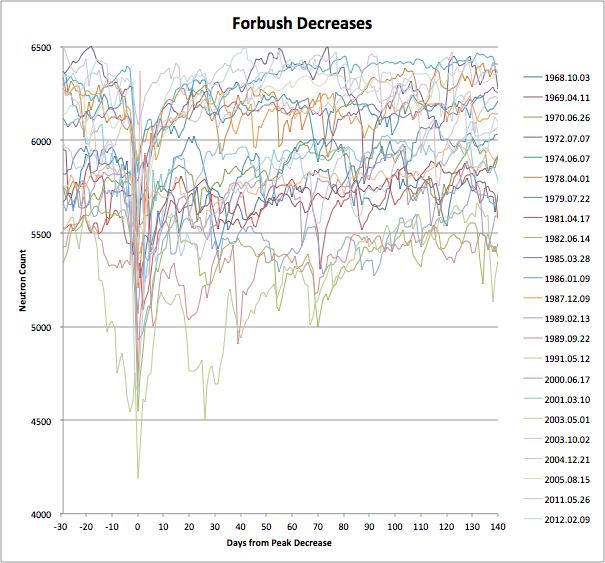
Twenty three Forbush decreases were found and daily data plotted together in Figure 3 with the peak of the decrease at the day zero. Neutron count data 30 days prior and 140 days after the Forbush decrease were plotted. The legend records the date at the beginning of each plot.
Figure 3 is a plot of 23 Forbush decreases recorded at Oulu since 1964.
Figure 4 is the average for all 23 Forbush Decreases. The vertical scale is NOT inverted in figures 3 and 4.
On average a Forbush decrease is about 14 days wide at the 10% point and 5 to 7 days wide at the 50% point. The average decrease in neutron flux is about 10%, but this can range widely from under 5% to over 20%.
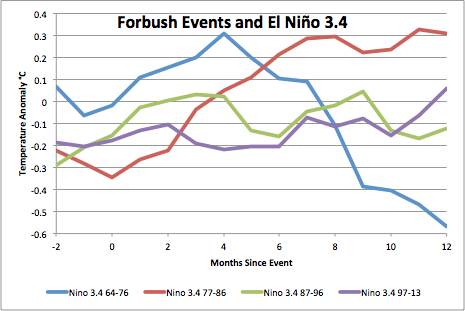
The temperature data available on the web is generally available only as monthly or annual data. Temperature data was averaged for events in each solar cycle from two months prior to at least a year after each event. Forbush events occur randomly, and not at convenient month ends, so the nearest months to each event were plotted. This blurs the resolution somewhat. El Niño 3.4, GISSLOTI, and HADSST3 data were compared. The El Niño data is from NCAR. The GISSLOTI and HADSST3 monthly data from woodfortrees.
Figure 5 is a plot of the average temperature effects for Forbush events from 1964 to 1976, 1977 to 1986, 1987 to 1996, and 1997 to the present.
The temperature changes seen here are quite large, more than half a degree, but the averaged signal is quite noisy because there are so few events. The first period (Solar Cycle 20) shows a warming peak at four months, but the second period (Cycle 21) has the warming delayed until the seventh month and later. The last two periods show little pattern.
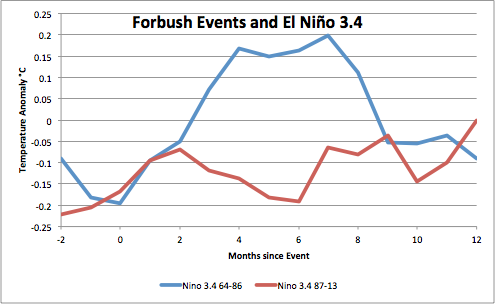
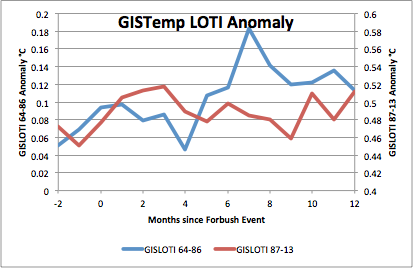
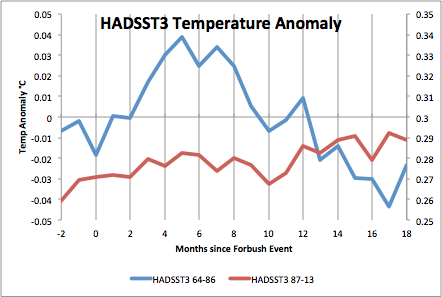
If the total period is split into just two portions, pre and post 1987, we get Figure 6.
Figure 6 is the temperature effect on the El Niño 3.4 area of Forbush events pre and post 1987.
Before 1987, a Forbush Event resulted in an ocean surface temperature rise in the El Niño 3.4 region of about a quarter of a degree on average, 4 to 7 months after the event, but only in the pre 1987 data.
Figure 7 is the temperature effect on GISTemp Land-Ocean Temperature Index Anomaly, pre and post 1987.
The full scale amplitude of both left and right scales is 0.2°. There is a 0.4° offset between the left and right scales. A peak at seven months is seen only in the pre-1987 data.
Figure 8 is the temperature effect on HADSST3 pre and post 1887. Left and right scales are the same amplitude, just offset 0.3°.
Again, only in pre-1987 data do we see a sea-surface temperature warming 4 to 7 months after Forbush events. Why should this be?
What changed in the late 1980’s? There seems to have been two steps in warming: the first with the spring of 1987 El Niño, the second with the spring 1997 super-El Niño. These El Niños were not started by any Forbush event.
They seem to have arisen from natural ENSO cycles. Perhaps sea surface temperatures simply reached a point where Forbush event cloud changes have little added effect.
We know that warming has stopped at the step of 1997. We see the cosmic ray/neutron flux levels increasing, which should result in cooling, yet we don’t observe cooling yet. The results above would seem to indicate that since 1987, natural ocean cycles may have overwhelmed cosmic ray affects. There seems to be a natural limit to sea surface temperatures at about 30°C, which is regularly reached in much of the tropical Pacific, and lack of clouds will not drive it higher. I would like to see input from Henrik Svensmark, Roy Spencer, Bob Tisdale, Willis Eschenbach or Nicola Scaffetta.



We present centennial records of sea surface and upper thermocline temperatures in Core MD01-2378 from the Timor Sea, which provide new insights into the variability of the Indonesian outflow across the last two glacial terminations. Mg/Ca in Globigerinoides ruber (white s. s.) indicates an overall increase of 3.2 °C in sea surface temperature (SST) over Termination I. Following an early Holocene plateau at 11.3-6.4 ka, SSTs cooled by 0.6 °C during the middle to late Holocene (6.4-0.7 ka). The early Holocene warming occurred in phase with increasing northern hemisphere summer insolation, coinciding with northward displacement of the Intertropical Convergence Zone, enhanced boreal summer monsoon and expansion of the Indo-Pacific Warm Pool. Thermocline temperatures ( Pulleniatina obliquiloculata Mg/Ca) gradually decreased from 24.5 to 21.5 °C since 10.3 ka, reflecting intensification of a cool thermocline throughflow. The vertical structure of the upper ocean in the Timor Sea evolved in similar fashion during the Holocene and MIS5e, although the duration of SST plateaux differed (11.3 to 6.4 ka in Termination I and from 129 to 119 ka in Termination II), which was probably due to the more intense northern hemisphere summer insolation during MIS 5e. During both terminations, SST increased simultaneously in the southern high latitudes and the tropical eastern Indian Ocean, suggesting virtually instantaneous atmospheric climate feedbacks between the high and low latitudes.
measurements in May of 1974, and they have run in parallel with those made by Scripps since then [Thoning, 1989]. The black curve represents the seasonally corrected data.