Why The Hiatus?
By Ed Caryl
One of the climatologist’s explanations for the 17-year hiatus in global warming is the effect of aerosols. This explanation seems weak for the simple reason that we don’t see aerosols in this time period.
We do see the impact of aerosols from volcanic activity in previous periods, however. Here is the satellite view of monthly global temperature since 1979, along with the El Niño index and atmospheric transmission from the Mauna Loa atmospheric observatory.
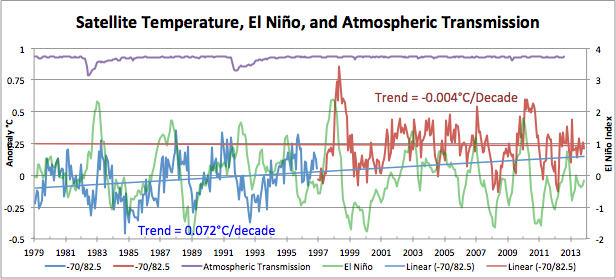
Figure 1 is RSS Global TLT, El Niño 3.4 index, and atmospheric transmission.
Atmospheric transmission is the ratio of direct solar radiation from the near UV to infrared wavelengths (0.3 microns to 2.8 microns) that makes it through the atmosphere. www.esrl.noaa.gov/gmd/grad/mloapt.html.
Two volcanic eruptions CAUSED significant stratospheric haze from sulpher dioxide (SO2) injected into the stratosphere,
El Chichon in 1982 and Mt. Pinatubo in 1991. Both caused significant solar energy obstruction for four years or more. Here are pictures of the Mt. Pinatubo eruption in June 1991 on the left, and of the resulting stratospheric haze in August 1991 on the right, taken from the Space Shuttle.
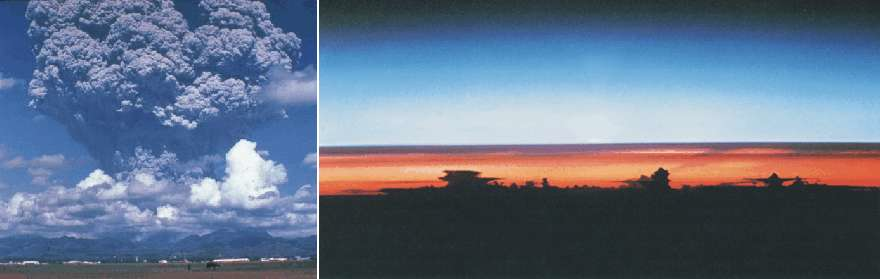
Figure 2 is (on the left) Mt Pinatubo in eruption, and (on the right) the earth’s limb showing the stratospheric haze, the purple line across the middle, above the cumulonimbus clouds. Source here.
The 34-year satellite observation era can be split into two halves, the 17 years before the El Niño of 1998, and the 17 years since, including the El Niño. During the first 17 years there were 2 significant volcanic eruptions and three El Niños. Two of those El Niños occurred after eruptions, but during the periods where SO2 haze was present. The SO2 hazes prevented any temperature increase, and in fact produced cooling for nearly four years in each case. Despite that, during the 17 years, temperatures increased by 0.12°C, 0.072°C/decade.
Look closely at the temperature pattern associated with El Niños. Each El Niño produces a global temperature spike a few months later, followed by a cooling rebound that is as about as negative as the El Niño is positive, and lasts as long. But there is one exception. There was a small El Niño in 1995 for which there was no negative rebound as it was followed by the super-El Niño of 1998. These produced a step in temperature of about a quarter of a degree.
Most of the warming in the years from 1979 to 1997 are in that two-year period from the El Niño of 1995 to 1997. We are now in a slow cooling from that step, thus the hiatus in temperature. There is very little temperature trend since the end of the Pinatubo eruption haze in 1995 as the result of aerosols. With the exception of two very short volcanic events, atmospheric transmission as measured at Mauna Loa was almost flat at around 93% for that whole period.
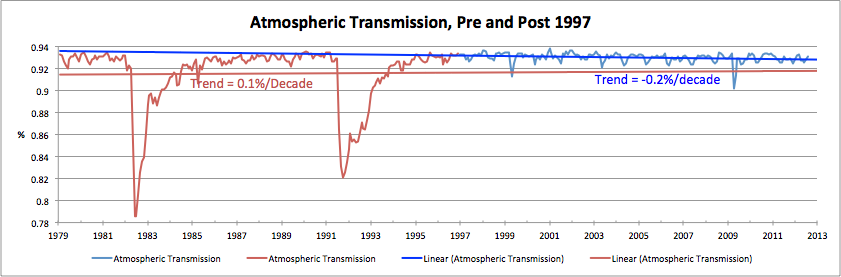
Figure 3 is a magnified view of atmospheric transmission pre- and post-1997 with trend lines.
The two minor volcanic events were Shishaldin volcano in the Aleutian island arc of Alaska, producing an ash cloud to at least 45,000 feet in the stratosphere on April 19, 1999, and on March 22, 2009, Mount Redoubt volcano, 106 miles southwest of Anchorage, Alaska, began a series of eruptions with the ash plume reaching 60,000 feet in the stratosphere during two of the six significant eruptions. Neither of these eruptions produced very much SO2, and the ash fell out of the stratosphere in less than a month, the resolution of the above plot.
If the very significant solar obscuration due to El Chichon and Mt. Pinatubo pre-1995 resulted in warming, there is no way that the dearth of activity in the post-1995 period could have produced the observed lack of warming. But, the 0.25°C step in warming in the period from 1995 to after 1998 can be explained by the lack of volcanic activity in the later period. The average atmospheric transmission in the first period is about 1.5% less than in the second period. Allowing for average albedo, that is about 2.5 Watts/m2 difference in average solar radiation at the earth’s surface. This, plus the two El Niños in 1995 and 1998, explains the step in warming. This also means that the climate sensitivity, Lambda is very low.
Delta T = lambda * delta F, T is temperature in degrees C, F is the forcing in Watts/m2.
Lambda = delta T/delta F = 0.25°C/2.5 Watts/m2 = 0.1°C/Watt/m2.
This figure has some caveats, the temperature measurement is from the global satellite (RSS) temperature data, and the atmospheric transmission data is from Mauna Loa, Hawaii, which was on the edge of the SO2 plumes from Pinatubo, so it should be viewed as an approximation.
But it agrees with what Willis Eschenbach found yesterday for tropical regions, here. The Pinatubo eruption was the larger of the two eruptions and had the largest impact, but it was limited to tropical latitudes where lambda is low or negative.
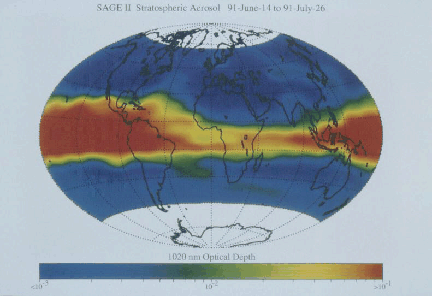
Figure 4 is an optical depth plot of the Pinatubo SO2 plume three weeks after the eruption. Source here.
The lack of warming for the last 17 years cannot be due to an increase in aerosols, as there was no significant increase.
The hiatus in warming, with little volcanic activity to provide cooling, with the peak reached in the AMO, solar activity declining, increasing sea ice, sea temperatures hitting the limit, and the very low climate sensitivity measured above, all indicate that we have reached the peak global temperature in this cycle. It will get no warmer. It may never get warmer. The thermostat is open.


Thanks, Ed. Why the hiatus? The question suggests that we are looking for an explanation of something observed in nature, but the hiatus is a difference between observed and expected temperatures, the latter produced by us or our models (which amounts to the same). So the hiatus may have a psychological or even psychiatric explanation.
more denialist nonsense
How about providing an example? Or has your intellectual level never progressed beyond third-grade name-calling?
There Are None So Blind
As Those Who Will Not See
The assertion that there has been a
“17-year hiatus in global warming”
is not true.
Despite the fantasies of Global Warming Deniers, the earth continues to warm at the rate of 4 Hiroshima atomic bombs per second – running 24/7 – including the years from 1998 to present. http://www.skepticalscience.com/4-Hiroshima-bombs-worth-of-heat-per-second.html
2005 was warmer than any previous year. Then 2010 broke the 2005 record. Data at: ftp://ftp.ncdc.noaa.gov/pub/data/anomalies/monthly.land_ocean.90S.90N.df_1901-2000mean.dat
Sea level continues to rise due to thermal expansion and glacial melting. The current rate of rise is over 50% faster than what was observed from 1870 to 2004. http://en.wikipedia.org/wiki/Current_sea_level_rise
Glaciers continue to melt, and the rate of melting has accelerated since 1998.
World Glacier Monitoring Service
http://www.wgms.ch/mbb/sum12.html
Ocean heating has accelerated sharply since 1998. Graph at: http://www.durangobill.com/GwdLiars/GwdOceanHeat.jpg
Full peer reviewed paper at:
http://onlinelibrary.wiley.com/doi/10.1002/grl.50382/full
Up to date info at:
http://www.nodc.noaa.gov/OC5/3M_HEAT_CONTENT/ (click on “2”)
And finally, November 2013 just set a record for the warmest November in history. http://www.ncdc.noaa.gov/sotc/global/2013/11/
Of course, every one of your claims is in dispute. For every point you mentioned, someone else can produce peer-reviewed papers and tons of literature and data pointing to the contrary. And if you rely on SkS and Wikipedia for your sources, then believability for all practical purposes disappears.
But keep up the faith.
Bill Butler
22. Dezember 2013 at 23:18 | Permalink | Reply
“Despite the fantasies of Global Warming Deniers, the earth continues to warm at the rate of 4 Hiroshima atomic bombs per second”
A rational person would then expect to see this in the form of a rising trend over the past 17 years in RSS. But there is no such trend.
Despite your attempt at calling us irrational, any neutral observer can see that you are a slanderer. This will not help your argument.
Your graphic shows three cooling events, two of which corelate very well with volcanic activity, but what is the explanation for the middle event, 1988?
I covered that. “Look closely at the temperature pattern associated with El Niños. Each El Niño produces a global temperature spike a few months later, followed by a cooling rebound that is as about as negative as the El Niño is positive, and lasts as long.”
That cooling in 1988 is rebound from the El Niño of 1987.