This is one of those posts about things noticed, remembered, and linked while surfing the web.
It is well known that the local sea level is heavily influenced by wind speed and direction as well as barometric pressure. Most people are aware of storm surges associated with hurricanes, for example. The same thing happens on a near-global scale, and some of it is near-permanent. Here is a global map of sea level anomaly from the University of Colorado.

Figure 1 is the sea level rise trend since satellite radar altimetry began.
In Figure 1, the sea level in the Western Pacific has risen 10 or 12 mm per year, while the eastern Pacific, parts of the Southern Ocean, and a spot in the Atlantic, have fallen by 3 to 5 mm per year, over the satellite era.
The next interesting map comes from the European Space Agency (ERA). This map is generated by taking the sea surface height as measured by satellite and subtracting the gravity model from GOCE. The result is the sea surface height over the geoid.
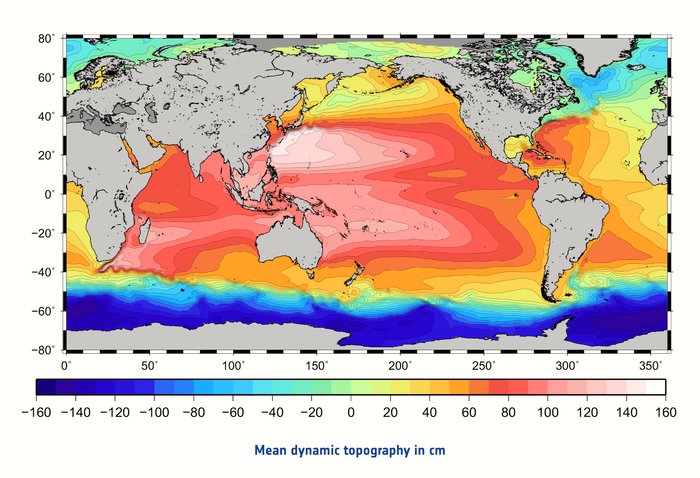
Figure 2 is the sea surface height over the Geoid.
Note the difference in height between the western Pacific and the Southern Ocean, about 3 meters. The difference in height between the western Pacific and the coasts of North and South America is over a meter. These height differences drive ocean currents. These differences are maintained by wind and pressure differences. If wind and pressure change, the sea level changes accordingly.
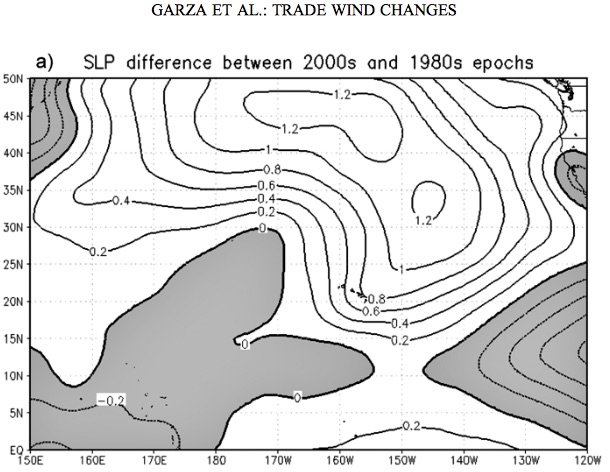

Next are plots (Figures 3 and 4) from Garza et al 2012, of Sea Level Pressure (SLP), and wind changes over the 1980 to 2009 epoch.
The SLP has increased over the eastern Pacific and decreased over the western Pacific. North of 10°N, easterly trade winds have increased in the eastern Pacific and south of 10°N, they have decreased. These small changes, along with thermal expansion, have changed the relative sea level between the two sides of the Pacific Basin by 1%, one centimeter out of one meter. My point is that not all of the western Pacific sea level rise is due to warming, a great deal of it is due to wind and SLP change.
Do you remember the controversy last year about the trade winds? One paper had them increasing, due to global climate change; the other had them decreasing due to climate change. They were both right. They were just looking at different parts of the elephant. North of 10° North the winds increased; south of 10° North the winds decreased.


That big red blob north of Aussies seems to be associated with warm water. Been warm in that area all 2014
Where’s the fallen wind mill gone, Pierre?
https://www.facebook.com/video.php?v=1035370459821733
Turns out it was dismantled – not blown down.
That’s a hell of way to dismantle a wind turbine. Could have been cleaner with TNT
A wind tower fell in Ireland.
http://www.bbc.com/news/uk-northern-ireland-30667411
One was removed in Australia.
http://www.abc.net.au/news/2014-10-29/newcastle-blows-off-landmark-wind-turbine/5850426
Ed,
Having seen several new-to-topic comments about waves and currents, I will offer this just in case.
This sentence: “These height differences drive ocean currents.”
Yes, I agree. However, other things are involved, such as rotation and salinity. Also, occasionally – as with Kelvin Wave – the terminology gets twisted. Earth Science 100 treats waves almost exclusively as wind driven waves. One has to take ES-101 to learn the nuance.
New subject: You have not said why “wind and SLP change.” You do say, however, “not all of the western Pacific sea level rise is due to warming.”
If we disregard Earth’s rotation and under sea volcanism, isn’t all the rest related to warming (and cooling)? Some folks just say natural variability but that isn’t much use. I don’t yet see a very compelling explanation for the changes that come and go over relatively short (multi-year) periods. Lots of folks are talking Ozone these days though – and that gets us back to the Sun.
Finally, on the 2nd world map, the Mediterranean Sea appears to be greyed out. I don’t see why that is necessary. One might think that the European Space Agency has an interest there. They use a 20 year mean and perhaps the Mediterranean is not stable enough (height wise) to produce useful information. Just wondering.
I’m not so sure if the height differences is what drives the currents, or if it’s the other way around. Overall, measuring sea level is extremely complex, and is not something that is done with a dipstick here and there.
http://onlineslangdictionary.com/meaning-definition-of/dipstick
But here and there a “dipstick” tries.
OT but here’s something which definitely goes the way the wind blows:
https://www.facebook.com/video.php?v=1035370459821733.
Pierre – is this an old video or a recent failure ?
ignore that – hadn’t seen your comment above…
as someone who spends far too much time in and around the sea,and having witnessed a one metre difference from predicted tide height to actual tide height due to a very low pressure system sitting over the shetlands and a high moving into the southern north sea,the notion that anyone,including all the greatest minds that have ever lived,could measure sea level to millimetre accuracy is farcical.
Thank you.
Excellent topic Ed.
Wind is the primary driver of ocean currents.
For me, finding this article is the top highlight of recent months of the climate discussion.
It’s the sun:
http://tallbloke.wordpress.com/2014/12/18/agu-presentation-argues-that-ne-pacific-centennial-trend-is-mostly-natural/comment-page-1/#comment-95769
Observations clarify that mainstream conceptualization of sun-climate relations is fundamentally wrong. The key roles of land-ocean & north-south asymmetry have been ignored.
Mitsubishi i-Miev (electric noddycar) loses 17% of battery capacity after 3 years, 40,000 km, in test.
http://www.sueddeutsche.de/auto/elektroauto-im-test-weniger-leistung-bereits-nach-drei-jahren-1.2241382
German journalist surprised! Too many quick charges says car maker. Warranty of 5 years applies. Which is good because battery costs 3000-8000 EUR in EVs.
Consumer tip from me, not from the journo: Wreck your noddycar’s battery before warranty expires!
In order to gain access to some key solar-terrestrial data, I had to agree to refrain from publicly releasing related analyses. But there’s nothing (an accidental loophole?) preventing more insightful exploration of publicly-available data with the benefit of simple geometric intuition gained by exploring the restricted-access data:
http://s13.postimg.org/4bpybuo8n/Sun_Wind_Pressure.png
http://tallbloke.wordpress.com/2014/12/18/agu-presentation-argues-that-ne-pacific-centennial-trend-is-mostly-natural/comment-page-1/#comment-95767
http://tallbloke.wordpress.com/2014/12/18/agu-presentation-argues-that-ne-pacific-centennial-trend-is-mostly-natural/comment-page-1/#comment-95641
A clean extension of these explorations to the trivial geometry of the northern arctic is forthcoming.
Ocean tides are set by the location of the moon.
New illustration of
Solar Cycle Length & Sea Ice:
https://tallbloke.wordpress.com/2015/01/15/the-uk-general-election-battle-ahead-an-appeal-for-your-help/comment-page-1/#comment-96504
• Fram Strait Ice Export
• Western Nordic Seas Winter Sea Ice Extent
• Solar Cycle Length
Refresher links over here:
http://joannenova.com.au/2015/01/the-sun-and-solar-physicists-go-quiet/#comment-1667594
Regards
Solar Cycle Length & Sea Ice:
http://s3.postimg.org/bwqi2bp5f/Solar_Cycle_Length_Sea_Ice_Sun.png
• Fram Strait Ice Export (Schmith & Hansen 2003)
• Western Nordic Seas Winter Sea Ice Extent (Macias-Fauria + 2009)
Background:
“Here we integrate and synthesize a set of multicentury historical records of Atlantic Arctic sea ice, supplemented with high-resolution paleoproxy records […] We establish a signal of pervasive and persistent multidecadal (~60–90 year) fluctuations […]”
Miles, M.W.; Divine, D.V.; Furevik, T.; Jansen, E.; Moros, M.; & Ogilvie, A.E.J. (2014). A signal of persistent Atlantic multidecadal variability in Arctic sea ice. Geophysical Research Letters 41, 463-469.
• http://folk.uib.no/ngftf/CV/PDF_Furevik/miles_et_al_grl_2014.pdf
• ftp://starfish.mar.dfo-mpo.gc.ca/pub/ocean/ingrid/Gary/Miles_grl51241.pdf (alternate link to same pdf)
Martin Miles’ research group has done an extremely valuable job of gathering all of these records together. Please see their Table 1 & Figure 1.