Climate cycles and their extrapolation into the future
By Dr. Dietrich E. Koelle
(Translated/edited by P Gosselin)
As the reconstruction of the climate’s development in the past by proxy data shows, there’s a series of temperature cycles that appear to be unknown, or ignored by many climate scientists. Among these are the larger climate cycles of 150 million to 180 million years (see Part 1 and Part 2), but also the shorter and for us the more important following cycles:
1000 years (900-1100) Suess cycle with +/- 0.65°C
230 years (230-250) deVries cycle with +/- 0.30°C
65 years (60-65) Ocean cycles with +/- 0.25°C
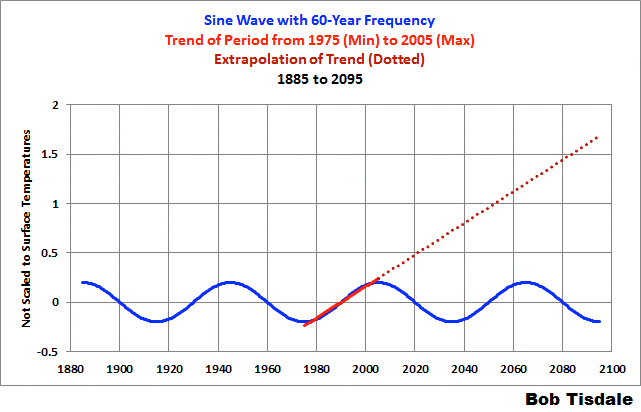
In principle these cycles are sinusoidal in behavior as depicted in Figure 1. Bob Tisdale has also shown how the temperature increase of the 65-year cycle from 1975 to 1998 led to the assumption that it is due CO2 emissions because they too happened to be parallel. This has been naively extended all the way to the year 2100 and forms the basis for the climate models and the invention of the so-called “climate catastrophe”.

Figure 1: Sine wave characteristic of the 60/65-year ocean cycle (Source: Bob Tisdale at WUWT).
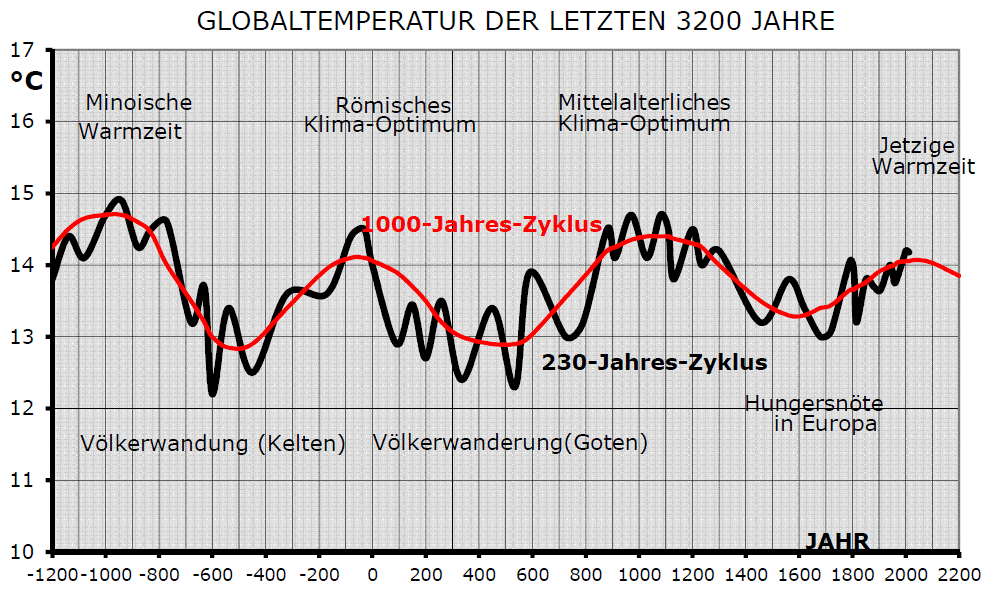
In this analysis we will attempt to see how the temperature development could be over the next 700 years, assuming of course that the mentioned climate cycles of the past will continue on into the future. This should not be (mis)understood as a forecast for the future climate. Up to now there is only the IPCC forecast that the global temperature will rise by 2 to 5°C by the year 2100 – based only on the expected CO2 increase. However that theory has failed to work over the last 18 ears because the various natural climate factors and cycles never got considered, or they were not allowed to be considered in the climate models. Included among these factors are the mean cloud cover (albedo) and the resulting effective solar insolation (watts per sqm) at the earth’s surface, or the sea surface, which is decisive for the temperature development.Next Figure 2 below depicts the 1000-year cycle and the 230-year cycle, which have been reconstructed from historical proxy data. They stem from a combination of results from various publications in the field of paleoclimatology over the last years. The diagram of the last 3200 years distinctly shows a 1000-year cycle; the last 2000 years of which are confirmed by historical documents. In fact this cycle goes back all the way to the end of the last ice age, i.e. some 9000 years. The reason for the cycle is still unknown today, yet its existence is undisputed.
The current warm period is no “anthropogenic product”, rather it is the natural result of a repeating 1000-year cycle that goes back far into the past. Today’s warm period does not even reach the temperatures seen in the past warm periods, which at times were 1 to 2°C higher. Moreover it is important to note that during both of the past temperature maxima of 1000 and 2000 years ago, the CO2 values were at 280 ppm while today they are at 400 ppm. This indicates that the earlier warmer periods likely were related to natural solar activity and not to a rise in CO2 because there was no CO2 rise during those warm phases.

Figure 2: Global temperature over the last 3200 years shows a distinct 1000-year cycle along with the 230-year cycle.
Of historical significance is the fact that over the course of human history warm periods were always times of economic and cultural prosperity. The cooler periods always led to serious problems that led to starvation and huge waves of human migration in Europe. Here it becomes undeniably clear that the alarmist claims that “the earth has a fever” made by politicians such as Al Gore are patentedly preposterous.
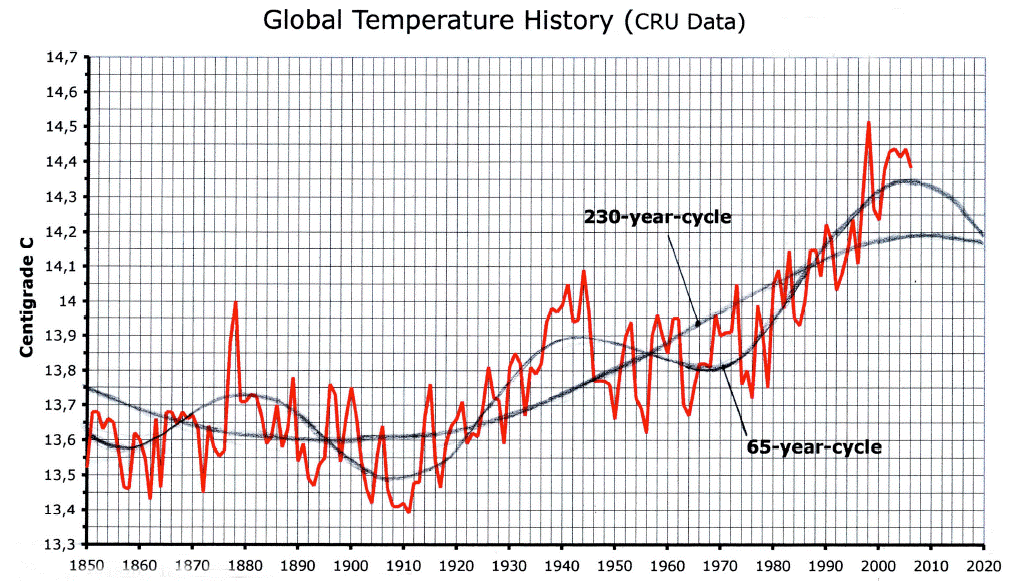
The “ideal” 1000-year cycle is varied by the 230-year cycle, which in turn gets varied by the 65-year oceanic cycle, which is depicted in Figure 1. Added to these cycles are the various typically non-cyclical events such as the ENSO, volcanic eruptions, etc. Figure 3 shows the temperature curve for the last 165 years along with the 230-year cycle and the effect of the 65-year ocean cycle. The current temperature values fluctuate by plus/minus 0.2°C due to the effects of ENSO, sunspot activity, volcanic eruptions, etc.

Figure 3: The 230-year cycle over the last 165 years has been superimposed by a 65-year cycle as well as by other effects like the irregular ENSO events and large volcanic eruptions.
The temperature rise of 0.6°C during the 1975-1998 period, which has triggered all the current climate hysteria, was of the same magnitude as the previous increase that occurred in the 1910 to 1940 period, which in turn had nothing to do with CO2 because back then the concentration in the atmosphere rose by only some 10 ppm (from 297 to 308 ppm). Also the temperature increase of 1.5°C over the last 150 to 250 years is also nothing “out of the ordinary” or “dangerous”, as we are often told in the media. Instead it is only the natural recovery from the Little Ice Age (LIA) that had gripped the planet from 1400 to 1750. The LIA not only led to the Thames River and Baltic Sea freezing over, but resulted in severe hunger in Europe and caused a mass migration to America.
The figures also show that all three climate cycles reached their maximum shortly after the end of the last millennium. With that in mind, we actually should have expected even higher temperatures than those seen in previous warm periods. Here perhaps the fact that the global temperature has seen a negative overall trend since the Holocene Maximum plays a role. That means that the global temperature has fallen by 2°C over the past 8000 years.
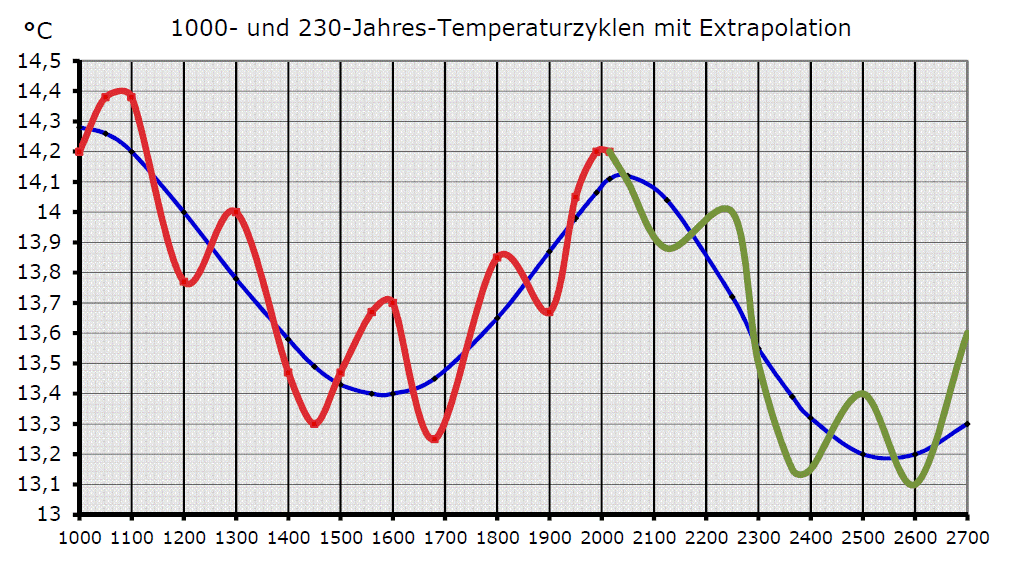
Based on historical climate fact, it is possible to extend the trend into the future to form a possible climate scenario. Figure 4 depicts the extrapolation of the 1000-year and 230-year cycle along with the generally expected trend. Added to this are the fluctuations of the 65-year ocean cycles, the impacts of the ENSO-events, sunspot cycles and volcanic eruptions, which result in additional fluctuations of a few tenths of a degree – just as they have in the past.

Figure 4: Extrapolating the 1000-year and 230-year cycles 700 years into the future.
Figure 4 shows the real global temperature development of the past 1000 years and its theoretical continuation over the next 700 years. This is not a forecast, but rather it is the extended possible course of the over all temperature trend, which over the mid-term in the next 100 years could see a drop of approx. 0.3°C and a 2°C drop in global temperature in 350 years – which would mean conditions just like those seen in the Little Ice Age from 1450 to 1700. In about 1000 years the 1000-year cycle will again take on its warm phase and temperatures like those of today can be expected.
In the next 50 years there would be no temperature increase, but rather a slight temperature decrease is expected. In the decades before and after the year 2300 a powerful temperature drop could occur because both the 230-year cycle and 100-year cycle would be dropping rapidly together in parallel.
References:
1 J.R.Petit et al.: Climate and atmospheric history of the past 420 000 years from the Vostok ice core, Antarctica, Nature Vol.399, June 1999
2 Th.Steuber et al.: Low-latitude seasonality of Cretaceous temperatures in warm and cold episodes, NATURE Vo.437, 27 Oct.2005
3 W.S.Broecker and G.H. Denon: What Drives Glacial Cycles ? Scientific American, Jan.1990
4 H.Kawamura et al.: Antarctic Dome C Temperature Reconstruction, Nature, 23 Aug.2007
5 J.Veizer et al.: Evidence for decoupling of atmospheric CO2 and global climate during the Phanerozoic eon, NATURE Vo.408, 7 Dec.2000
6 K.Kashiwaya et al.: Orbit-related long-term climate cycles revealed in a 12-MYr continental record from Lake Baikal, NATURE Vol410, 1 March 2001
—————
Note from the Die Kalte-Sonne editors: The main point of this post is to provide any analysis of natural cycles and their logical extension into the future. Unaccounted in the projection shown in Figure 4 is the climate impact of CO2, whose role in climate today is hotly disputed. In our book “The Neglected Sun” we presented two CO2 climate sensitivity scenarios: 1.0°C and 1.5 °C warming for a CO2 doubling. Current studies have corrected the original IPCC value of 3°C strongly downwards (see our articles “Studies from 2014 provide hope: warming effect of CO2 is considerably over-estimated. Official correction is imminent“). It will be exciting to watch how research will develop with respect to climate sensitivity over the coming years.


Interesting presentation.
Slightly off-topic: over at Dot Earth I recently commented on the failure of IPCC FAR predictions to come anywhere near true.
Another commenter posted a SkS post on “denier predictions” from 2 or 3 y ago.
After looking at the .gif graphic, I noticed several “problems” with the SkS representation. Anyone familiar or interested to hear more?
There is some crass misrepresentation.
http://wattsupwiththat.com/2011/12/07/in-china-there-are-no-hockey-sticks/ takes a single proxy, tree ring data from Tibet, and comes up with a 2485 year record. The strongest cycles it discloses are at 110, 199, 800, and 1324 years. It doesn’t seem to be a great match, though there’s only two cycles of 1324 to work with.
Nonetheless, their prediction is for falling temps from 2006 to 2068. They seem to have gotten off to a decent start.
I agree that any climate change we are seeing is not driven by CO2. I do not have a pet theory as to what is going to happen and do not expect to see a good explanation in the next few years. If it takes more than 20, I likely won’t be around to care. Anyway . . .
I need a handicapping sheet for cycles in the manner of a daily racing sheet for horse races. Some places show a “de Vries (Suess) cycle” of ~208 years. Here we have a 1000 year Suess and a 230 year de Vries. There are others.
The 3rd one here (60-65 years)[another place it is 65-70][elsewhere, 50-80] seems to be the Atlantic Multidecadal Oscillation (AMO), the cause of this is not known. While there may be a hidden solar link, the AMO is not a solar cycle.
So you’re saying it isn’t driven by CO2, just because?
Cal, if it were driven by CO2, we would see ongoing warming according to the words of the prophet Hansen; we are long past the point of taking the CO2AGW conjecture seriously.
Taking a break from doing just these calculations – hot off the press, so to speak.
Here’s an extrapolation (blue) with cycle periods varied by +- 10% (magenta, orange).
Dai
(if drag and drop works here)
/Users/daved/Desktop/SignalR150203.135529_1S2.gif
No luck. Here instead: http://brindabella.id.au/SignalR150203.135529_1S2.gif
Dai
That is VERY interesting!
Isn’t it impossible for those pushing global warming not to know this? In fact, given where we are on the curve, with warming still possible, it seems they picked what they thought was the perfect time to try to convince us. In fact there still could be another 0.5 to 1.0 C degrees yet to go over several decades, if I read the graphs correctly.
If the natural warming continued (continues), as it seems it could, their lies may not have been discovered until it was too late.
Never underestimate ignorance joined with arrogance and low intelligence. Many think they know what is going on and so make no effort to investigate further. Anything that is said that contradicts the CO2-warming meme is from a conspiracy of deniers and is mere misrepresentation or misdirection borne out of malevolence by those who want to see our planet “destroyed”. Read the likes of skepticalscience or realclimate and you’ll see an incredible defensive wall against having to consider any alternative to Anthropogenic GW/CC.
Besides if there hadn’t been so much resistance the AGW agenda would be well on its way to completion by now and they could point to the pause as “proof” that they had saved the planet
A very useful summary and integration of cycles; and I can’t remember seeing a similar one before.
It brings to mind my school biology teacher (I’m in UK) who explained Milankovitch cycles (tho’ not referred to as that) to interested 10-year-olds around 1950. Probably his equivalent today would not be permitted to talk about such things.
John F. Hultquist said
“While there may be a hidden solar link, the AMO is not a solar cycle.”
The solar link is solar plasma strength on the Arctic and North Atlantic Oscillations, with weaker solar conditions leading to negative AO/NAO and increased poleward ocean transport and a warmer AMO.
The period in recent times is 69 years. Which is precisely the periodicity of the most common and regular major planetary configuration causing higher levels of solar activity and clusters of warmer years for the mid latitudes.
The major forcing of the climate in the mid 1970’s with increased La Nina and a strong cooling of the AMO was at one of these configurations.
I have found one previous reference to it, it’s a quadrature series of Jupiter, Saturn and Uranus, with Saturn in quadrature with a heliocentric opposition of Jupiter and Uranus. Repeating best at 69 years (and finally at 317.7yrs), and with two looser configurations in between. E.g. around; 1934, 1948, 1975, 2003, 2044. I do have an observationally based theory for why this particular configuration should produce such results.
There’s one in the middle of Maunder in 1686 (very warm on CET), another in 1727, and 1865. Some won’t produce warm periods if Neptune is in certain positions, and taking that into account, the 20th century had the best run of these events since the 8th century.
Solar Minima occur on average every 10 solar cycles, with from 2 to 5 weaker sunspot cycles in each minimum. The 20th century period was unusual in that there was a longer than average interval between solar minima of ten solar cycles, and it also had followed a short and milder solar minimum (Gleissberg Minimum 1880-90’s).
The Holocene stadial type periods of increased clusters of cold events that includes the LIA, the Dark Ages, Greek Minimum etc, are very variable in frequency. The mean is around 700 years, but they vary from 400 to 1200 year intervals. And like the above, they are really events rather than sinusoidal cycles.
The image I have is three cyclic systems interacting: planets, internal solar dynamics, and the Earth’s ocean cycles.
The planetary orbits and solar dynamics have evolved together so it would be surprising if there was no connection.
The oceans are constrained by the Earth’s irregular geography so we can’t expect a close resonance with solar cycles – more likely going in and out of phase in a quasi-chaotic manner. I’m trying to analyse phase shifts in the southern ocean cycles to see if this can be detected. I’m not very optimistic.
It’s significant that the four or five strongest cycles account for over two thirds of SST variance and nearly all the long term variance leaving no room for any CO2 ‘signal’.
Period yrs, Weight, Contrib. %, Total %
863 0.58 35.9 36
193 0.29 18.0 54
11.4 0.09 5.81 60
11.5 0.09 5.64 65
60.6 0.07 4.52 70
A hint that I might be on to something is the two 11yr cycles that are almost 180deg out of phase.
The claim that natural variance is totally random is clearly false. Sea temperatures are cyclic. Land temperatures are weather.
I’m a little confused about the idea of “proxy data” here. There is no accurate way of accounting for temperature data before the common era, most core sample technologies can measure average ppm of atmospeheric gasses and radioactive particles. The DeVries and Seuss cycles have more to do with solar radiation than heat dissipation.
Regardless, the first cited study used in this original paper, the Petit paper on Vostok ice cores, states outright that CO2 and CH4 concentrations over time are indeed closely linked to Antarctic temperatures, and that the ppm levels now “are unprecedented during the past 420 kyr.”
So with that in mind, even if the warming trend right now is or is not anthropogenic at its base, how on earth could it not be constructive to intentionally reduce the greenhouse gasses that have built up in this recent industrial era?
Because the atmospheric concentrations lag the temperatures, therefore the chain of causality is from temperature to atmospheric concentration, and not the other way around.
Thus, policies to mitigate our emissions would accomplish nothing but to kill many people around the world due to artificially induced fuel poverty, and otherwise make all of our lives harder for no net benefit.
It is not possible to make intelligent climate forecasts without consideration of where we are with regard to the natural millennial ( 960 – 1020) solar activity cycle seen in the temperature and other data -see Figs 5-9 at
http://climatesense-norpag.blogspot.com/2014/07/climate-forecasting-methods-and-cooling.html
It is clear that the earth is just approaching, just at or just past the millennial peak. (Fig 9) The curve is probably not sinusoidal there is about 650 years of general cooling and a period of relatively rapid warming of about 350 years.
If we look at the neutron count record – Fig 14 which, together with the 10Be data ,is the best proxy for solar activity it is clear that solar activity peaked in about 1991. There is a 12 year delay between the driver peak and the global RSS temperature peak which probably occurred in mid 2003 since when the earth has been in a cooling trend see
http://www.woodfortrees.org/graph/rss/from:1980.1/plot/rss/from:1980.1/to:2003.6/trend/plot/rss/from:2003.6/trend
The sharp drop in solar activity seen at 2005-6 in Fig 13 should result in a noticeable cooling and a steepening of the cooling trend in 2017 -2018.
Check the first link for forecasts of the timing and amplitude of the coming cooling which should bring us to the depths of another LIA at about 2650.
A very interesting analysis, of a kind attempted quite often and which ought to serve as a springboard for productive discussion and enjoyable theorising. But the field has been poisoned by the wealthy ones who owe their prestige and their incomes to the promotion of alarm over our CO2 as a dominating driver of the climate system. Their retirement cannot come soon enough.
Nice analysis. One problem: Figure 3 includes CRU data. I assume this is the adjusted data? They adjust historical data downward, of course. What would Figure 3 look like with raw historical temperature data?
Amongst the references, there ought to be a paper by Qian Wei-Hong and Lu Bo, “Periodic oscillations in millennial global-mean temperature and their causes,” Chinese Science Bulletin, Atmospheric Science, December 2010, Vol. 55, No. 35, pp. 4052–4057, doi:10.1007/s11434-010-4204-2. They arrive at very similar conclusions upon having observed and analyzed various cycles in reconstructed millennial global-mean temperature series. The late 20th century warming period is shown to result from superposition of four cycles. Their analysis predicts cooling by 2030 and another warming by 2060.
[…] Up With That har mere om den videnskabelige del. No Tricks Zone referer til et andet og tysk studie, der mener at vise at klimaet ligger under for ganske mange […]
No mention of N. Scafetta, a signal processor: “Empirical evidence for a celestial origin of the climate oscillations and its implications”(2010)J. of Atm & Sol-Ter Phys.