Yesterday I published a piece by Fred F. Mueller on Germany’s out-of-control renewable energy transition and how it is in fact transitioning over to a disaster.
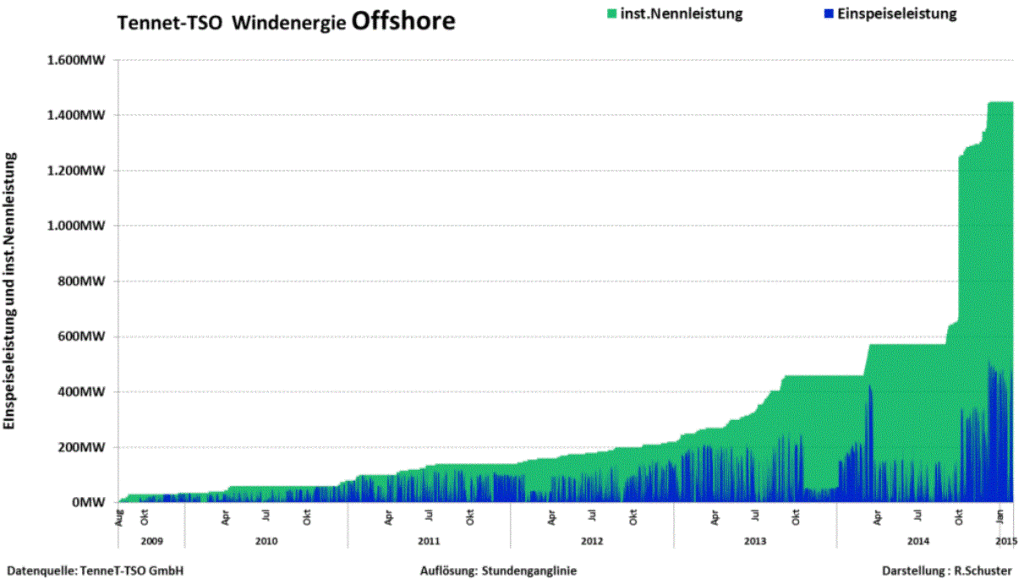
What follows below is a graphic that proponents of the offshore wind energy industry don’t want anyone to see. It tells the whole story about how (in)efficient and (un)reliable German offshore wind energy really is (Hat-tip: www.achgut.com):
Chart shows the installed nameplate offshore wind capacity (shaded green) and the actual output (blue shaded area) since 2009. Wind’s poor performance and unreliable, wildly fluctuating supply disappoint and risk sinking Germany’s “Energiewende”. Chart source: R. Schuster.
The above chart was prepared by Rolf Schuster, an industrial engineering designer, who during his free time has started a wind power databank in order to check the rosy claims being made by the wind power lobby. The results are not something any fast-talking salesman would want any potential buyer to see. The power that was input (blue) is a mere fraction of the rated capacity (green).
Schuster writes:
If you divide the power fed in (blue) by the rated capacity (green) you get the percent of the rated capacity that actually gets fed into the grid. The linear trend shows a negative tendency – towards 20 percent of the rated capacity. That means: Despite the massively increased capacity in 2014, hardly more power has ended up getting delivered compared to the start of the year. Only one fifth of the rated capacity actually gets fed in.”
Many proponents used to argue that the wind is always blowing at the North Sea, and so a steady supply was a sure thing. Now we have real results coming in. That “steady” wind is only delivering 20% of the installed rated capacity. A fiasco.
Schuster also says that offshore turbines have serious technical problems as well. Foundations are being washed out from underneath; there’s corrosion, and overloads that lead to turbine shutdowns. The harsh conditions of the North Sea a proving much tougher to handle.
There are also major problems with the high-voltage direct current systems that have yet to be solved, Schuster writes. One entire North Sea wind park has been disconnected from the grid as a result. This, Schuster says, “makes one ask if the installation of a major power transmission line from North Germany to South Germany would be a high risk gamble for the German energy supply“.
Green power goes AWOL again!
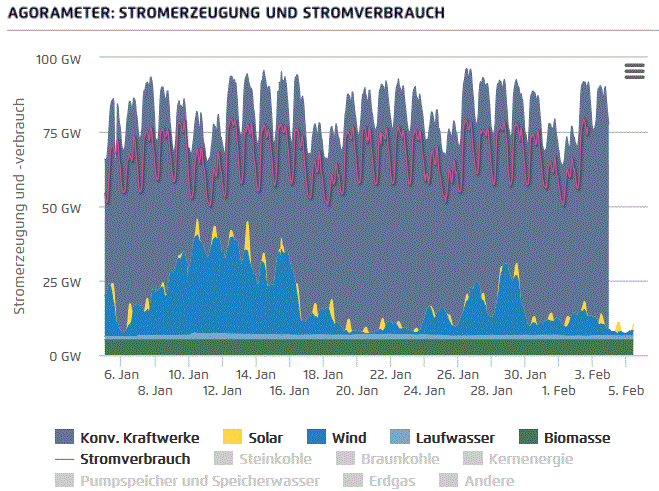
Also a look at online energy portal Agora here also tracks renewable energy that gets fed into the German power grid. A look at today’s graphic for the last 31 days tells us that once again wind and solar have gone AWOL, and so conventional fuels such as gas, nuclear and coal have to jump in to bail out.
The above chart shows German energy supply and consumption for the last 31 days. Solar power that was fed into the grid is shown in yellow. Wind power is shown in blue. Cropped from Agora.
Yesterday, February 4, we saw very little wind power getting fed into the grid, less than a gigawatt from a nameplate capacity of some 55 gigawatts of installed capacity – less than 2%! On February 4 wind and solar together virtually fed in almost nothing into the grid. If it had not been for coal, gas and nuclear, the country would have gone dark.


It’s a hockey stick! It’s a green hockey stick!
At the same time they are crippling the very part of the industry that they rely on.
Lunatics in charge of the Asylum.
This is definate proof that the majority of Germans are romatics at heart, not among the enlightened. Only a true romantic could see what energie-fraud has done and still support it.
Well, Molyneux had this idiotic thesis that the enlightenment passed Germany and Russia by and that’s the reason Germany and Russia had these vile regimes.
It is probably news to you and Molyneux that the arch-saint of the Enlightenment, Voltaire himself, resided nowhere else for a number of years than at Sansoussi at the court of the Prussian king.
” Only a true romantic could see what energie-fraud has done and still support it.”
Total idiocy; as the German romantics were the strongest proponents of undisturbed beauty of nature; and quite consistent in that regard. Replace romantic with Marxist and you’re getting closer.
Something strange in the first chart. It seems that it was running at 50% up until the end of 2013. It can be that technical problems have caused the low 20% since then, but it would seem to show that 50% is possible for a few years. Perhaps it means that you can get 50% or more for 5 years and then you have to replace all the turbines.
I guess it’s an artefact of very narrow peaks.
In the beginning wind turbines were only built in the Storm-prone coastal plains, and a stormy day would drive the few wind turbines to 100% of name plate capacity.
As wind turbinization encompasses bigger regions and locations with less overall wind now, we get some averaging out – the peaks become smaller but less narrow as the wind moves across the land – , and an overall reduction in capacity factor.
This would be an adequate explanation if the time-scale resolution was higher, but here we see the years broken into 4 quarters, so each section records 3 months of wind power. I don’t think even a single day transient would show up on this chart so I don’t think it can have anything to do with gusting and transients.
In the large version one year is 200 pixels wide on my screen so a day is half a pixel, the graphic looks anti-aliased, so a single day transient would be visible as a half-bluish peak. But most definitely be visible. And I do see such peaks, lots of them.
I counted about 50 pixels for 3 months, so I agree with you.
Assuming therefore that each line represents approx. 2 days, is it a maximum gust speed or a measure of the average wind strength over that time, in which case gusts are averaged out and won’t show.?
If it is an average of the wind speed, then I wonder why it is not averaged over more time to smooth it out and make it more meaningful?
As wind turbine output is proportional to the third power of the wind speed, the peaks tend to be needle-like; rising and falling parabolically. As a wind gust travels across the land, the more turbines you have spread out over the land, the more of these needle-like peaks are smeared together into a broader peak.
It looks like a haircut from Oct 13 into the beginning of 2014. That was quite a windy period for NW Europe.
14years ago it was common to talk of the typical output of wind as 30% of rated capacity. Because the sea is smoother, there should be less turbulence so that figure should be higher. So 20% is close to half what it should be.
With energy costs coming down, it will no longer be worth maintaining or repairing these expensive monsters so I doubt that figure will increase.
This is the end for wind.
Offshore reaches average 35%; onshore in Germany dropped from 20% to 17% over the years(reason is that the best spots in the coastal plains were used first, later turbines were built in less and less suited spots)
@ Mike Heath
It is a resolution problem with the graph. There is no way that until 2013 the average wind power was 50% of the nameplate power, it was always around 18% (can be checked in the old IEA wind reports). I guess they wanted to show the peaks in the graph and indeed, sometimes with a lot of wind you can get nameplate power, for a short time.
“This, Schuster says, “makes one ask if the installation of a major power transmission line from North Germany to South Germany would be a high risk gamble for the German energy supply“.”
They could always install a floating portable nuke to back it up…
A footnote: the reason for the green Peak at the end of last year without a corresponding rise in the blue is due to the fact that 3 offshore wind parks (Global Tech 1, Meerwind and Nordsee Ost) have been officially added to the net (and thus the sum of installed namelpate capacity) but are still running in the test mode, with only nominal amounts of electricity actually fed in.
It would be helpful to see construction costs each year and cumulative. And produced power on the same time scale.
Operating costs and pricing can be manipulated, and when government is involved they will be. Construction costs are harder to massage until they please. Debt normally is incurred, how much was it?
Rated capacity has proved useless except as a history lesson.
[…] året. Endast en femtedel av den installerade kapaciteten tillförs faktiskt nätet.” – se mer här. (En annan beräkning för all vindkraft i Tyskland ger en ännu lägre siffra, 14,8 %, av […]
BBC & Huawei together in advertisement mislead about Germany’s Green power ‘miracle’
“At the height of a scorching European summer, peak production of renewable energy in Germany was running as high as 75%, and solar topped out at 50% of demand. On average, 25% of Germany’s electricity generation comes from renewable sources. It has already smashed European Union targets for 20% renewable energy across member states by 2020.
– In many ways, Germany presents a model for the future supply of renewable energy and the challenges that come with it, for other markets to observe. The rise of small stations, typically using wind or sun, means power networks are no longer just distributing power from central generators,…”
Huawei claim they have a smart grid, magic solution
http://www.bbc.com/future/specials/connected-world/huawei-power
( You know how I got to that advert ?
The BBC has a business BBC Worldwide to cross-subsidise the BBC by selling BBC stuff etc. It owns a magazine called BBC Future
So I looked at the cold weather stories in The Daily Express newpaper website, on the side it has adverts marked promoted stories ..incredibly 4 out of 10 of them were adverts for BBC WorldWide stories .. I noticed the BBC Futures one about Climate ..and found it was an advertising feature from BBC Future Magazine for Huawei )