The whole of this week’s Weatherbell’s Saturday Summary by high profile meteorologist Joe Bastardi of course is excellent, but this week especially the first 4 minutes or so dealing with climate are of particular interest.
In it the veteran meteorologist, who has an unusual talent for making long-range forecasts, brings up some excellent points as the world leaders meet in Paris under the delusion they are going to rescue the planet from a dangerous climate change – a mere fantasy they’ve invested tens of billions to prop up.
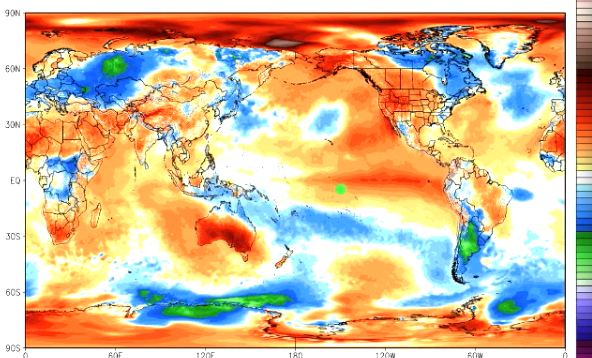
First Joe shows an NCEP CFSV2 chart depicting global temps:
NCEP chart, cropped from Weatherbell Saturday Summary.
Bastardi thinks that the NOAA is not being straight with the public and “is playing a little bit of a shell game“, and tells his viewers that claims that the planet is 0.025° warmer than the previous record, based on a questionable proxy reconstruction/adjustment methodology, is over the top.
Bastardi asks, “Why are we trusting proxy reconstructions over the gold standard of trying to initialize temperatures?”
No correlation
On CO2’s linkage to global temperature, Bastardi puts up a chart at the 1:30 mark showing that CO2 hasn’t been at all the climate driver over the earth’s geological history and that there is no correlation. It’s all overblown.
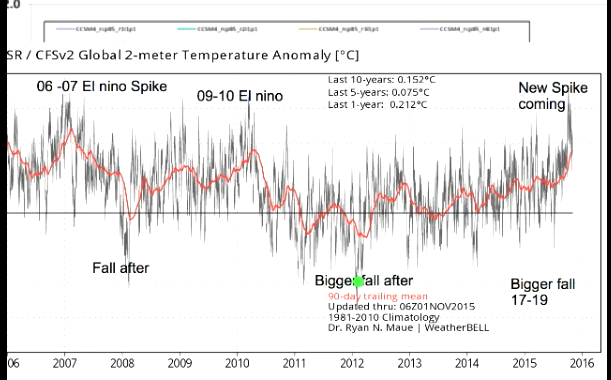
Cooling trend over the past decade
At the 2:17 mark Joes puts up another chart telling us global temperatures have in fact been cooling over the past decade.
NCEP chart, cropped from Weatherbell Saturday Summary.
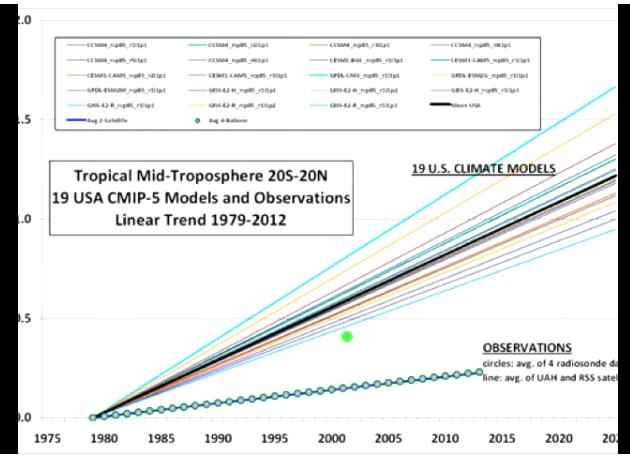
The above chart clearly shows this year’s El Nino, but that the overall trend is down. Bastardi does say that should the upcoming La Nina-associated temperature fall turn out to be weak, then the warmists may have a point that the globe is at least getting a bit warmer. But the bottom line for Joe is that the globe still is not warming anywhere near as much as the models project, illustrating this with a chart comparing the models to the actual observations at the 3:12 mark:
Dr. Roy Spencer chart, cropped from Weatherbell Saturday Summary.
On government’s attempting to form policy on such “grossly over-warmed” models, Joe says: “That’s insanity.”
Bastardi says the Pope and the governments are seriously misinformed if they think fossil fuels have been bad for us. To illustrate the point, he points up a chart at the 3:30 mark depicting life expectancy versus fossil fuel consumption.
Global Progress chart, cropped from Weatherbell Saturday Summary.
Human life only started to be long and prosperous precisely when fossil fuels began to be exploited. Any technically educated person will have no trouble understanding why, especially when we view the huge variety of beneficial products that are derived from this valuable and hugely plentiful natural resource.
It is truly stunning that there are actually people out there who cannot see this, but yet enjoy their benefits constantly.


Joe makes very good points and I have been an avid follower for two years now, but, it cannot hurt to use renewables in place of coal especially. I remember as a child the smoggy cities on the east coast. A modern example is China where tens of thousands are dying premature deaths each year due to smog.
In fact, they are the leading country in developing and using green energy.
More effort should go into reforesting the Amazon basin, the lungs of the world. I’m sure a case can be made as the rain forests disappeared, the warming rose. It might be a small part of the problem but still a problem.
In the more technically advanced nations, such as Germany and the United States, we now have the technology to burn coal cleanly (excluding co2 which is harmless and beneficial). This is not the case in many other places in the world. Instead of trying to kill coal we should be further advancing its technology at home, and exporting the advances to the less developed world. We could be driving down the prices of energy for all, not increasing it. It is criminal that elderly and poor people are suffering because of the sky rocketing price of energy caused by the renewables drive driving up costs.
Frank, they are clear-cutting the ‘lungs of the Earth’ for ‘green’ biofuels. I’d say they were intent on increasing the cost of Everything.
“More effort should go into reforesting the Amazon basin, the lungs of the world. ”
A forest in its natural state is perfectly carbon neutral. Plants grow, die and decay. A forest has no “lung of the world” function.
sod arriving to put in his negative two cents worth on Joe in 5…… 4…………… 3 3/4………………………
Sod is off to Paris I presume…
Frank says: “… it cannot hurt to use renewables in place of coal especially.
Well, you go first. I want my refrigerator/freezer to work correctly all the time. It would make no sense to have them only when the sun shines or the wind blows. It is night now where I live – no solar, and besides we live too far north – and the wind is not on. See this site for a fix on the latest wind power – it is the green line at the bottom.
http://transmission.bpa.gov/Business/Operations/Wind/baltwg.aspx
The local temp is -7° C., so the heater needs to work. It is electric also. [The truth is that our power comes from big dams on the Columbia River in the US State of Washington. But still …]
We have had a small iceage and now we have one degrees higher temperature of witch 0,3 can be a result of CO2 emissions.
We have 85% energy from fossil fuels of witch coal is important but dirty.
Clean air act has made a remarkable result.
A result we in the west can enjoy due to economic capacity.
The developing world are still waiting for fresh air:
http://aqicn.org/map/world/
Lasse, The Skeptical Environmentalist by Bjoern Lomborg has data about expenditures on environmental protection (like flue gas scrubbing) as related to GDP/capita. The conclusion is: Before you care for your environment, you must get rich enough first.
November was the hottest ever in Germany.
“7,5 Grad Celsius warm war es diesen November im Durchschnitt in Deutschland. Das ist 3,5 Grad mehr als im langjährigen Mittel von 1961 bis 1990, meldete der Deutsche Wetterdienst (DWD). Gegenüber der Referenzperiode von 1981 bis 2010 ist es immer noch ein Plus von 3,1 Grad. Das macht die letzten 30 Tage zum wärmsten Monat seit 1881, dem Beginn regelmäßiger Aufzeichnungen. Am höchsten kletterte das Thermometer am 7.11. in Freiburg, auf 23,8 Grad.”
http://www.sueddeutsche.de/wissen/weltklimagipfel-in-paris-heissester-november-in-deutschland-1.2760750
3.5°C warmer than the average. wow. Hottest month since beginning of the modern temperature recording.
Here the DWD means the warmest November anomaly, and not the warmest anomaly ever.
It was a mild month. But applying the global warming theory, it is supposed to be causing cold, severe winters in Europe. Thus applying the theory the other way, mild winters would have to mean that the planet is cooling. That is how science works.
That aside, you’re confusing weather with climate. The mild weather has nothing to do with CO2, and is the result of a weather pattern that pumped warm Atlantic air over Central Europe. One look at the month’s prevailing wind direction tells the story.
“But applying the global warming theory, it is supposed to be causing cold, severe winters in Europe.”
Very good! I already forgot about that junk from the PIK, that they produced after the cold 2009/2010 winters. Warmunism predicts everything – so its prediction also always fail.
Germany is now the entire planet?
Yes. Makes it easier to forge our way to warmunist world domination.
Same old tricks as before. The ‘S’ in the cut-off temperature graph makes I seem that what is plotted is the stratosphere – which every one agrees cooled. That is the only thing that makes sense, given that every other such 1990-2015 graph does not show cooling. I suspect a big fudge on that one.
The graph of projections versus empirical is bogus. Everybody already agrees that the 1998-2013 ‘hiatus’ was at least a slow-down. So obviously, if one runs models from 1990 against the empirical, one gets a lower slope. The effect disappears of course if one sets the base line further back. (Don’t forget ‘anomalies’ are differences from a baseline.) But one could ignore that trifle. The main problem is that the error margins of (p=0.05) both projections and empirical data are omitted. Plot things correctly, and the empirical data are within the ranges projected for IPCC FAR 1990 scenarios B and C.
D. Andrew White – Nope, the “Hiatus” is not a slow down. Alarmists refuse to accept geological data demonstrating the Climate is a dynamic system and has had world-wide temperatures and (Gasp!) CO2 levels both higher and lower than current values.
Computer models probably fail as they are all, without exception, based on the premise that CO2 is a harmful, “greenhouse” gas that forces subsequent temperature change when data suggests changes in world-wide temperature force subsequent changes in CO2 levels – therefore, demonstrably failing the Law of Cause and Effect.
Finally, water vapour (i.e. Clouds) is probably a more important factor with respect to temperature change, yet none of the computer models consider water vapour as a contributing factor.
Are you seriously going to claim that plotting error bars will reconcile fallacious computer projections with real world observational data?
Finally, the start of the hiatus is based upon the records themselves, the date from which a regression line through the real world observational data documents the lack of any discernible increase in temperature within the limits of uncertainty (the error bars you were mentioning). As we are entering an “El Nino” year, real world temperature data are expected to FINALLY show an increase, however, this may be offset if the following La Niña is sufficiently cool.
The data, unless “corrected” by NOAA, speaks for itself.
Nice try. You forget to mention that CO2 grew faster than assumed in scenario A.
Warmunist theory still totally and utterly destroyed.
[…] https://notrickszone.com/2015/11/29/veteran-meteorologist-bastardi-calls-policymaking-based-on-grossl… […]