Solar activity in December
by Frank Bosse and Fritz Vahrenholt
(Translated/edited by P Gosselin)
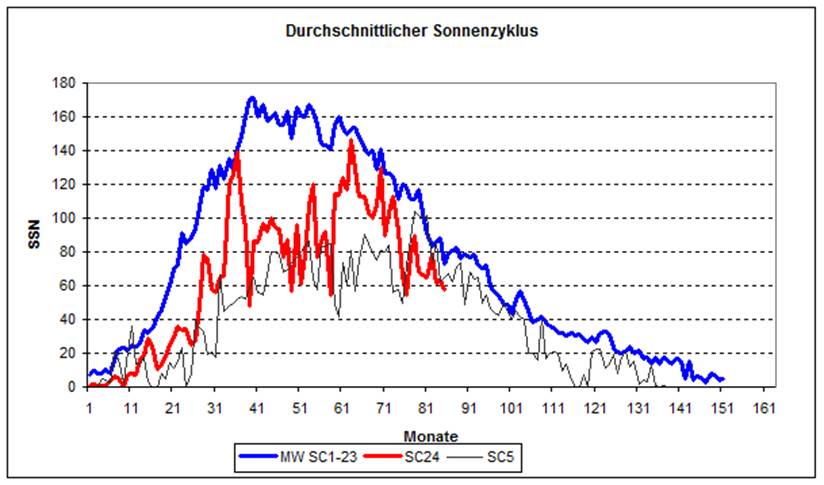
The central star of our solar system was quite inactive last month. The measured solar sunspot number (SSN) was 57.7. That is only 79% of what is the average for this time point into a solar cycle compared to the mean of the 23 previous complete cycles. What follows is a comparison:

Figure 1: The current solar cycle 24 (red) in relation to the mean of all the other previous 23 solar cycles (blue), and to the very similar solar cycle no. 5, which ended in 1810.
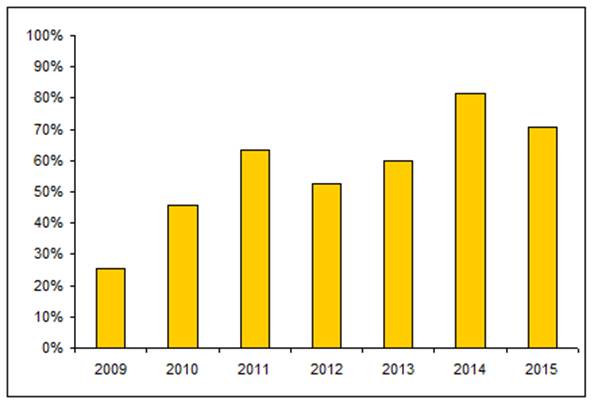
For the complete years of the current cycle, a plot of the activity percentage with respect to the mean appears as follows:

Figure 2: Relative sunspot activity of each calendar year for solar cycle no. 24.
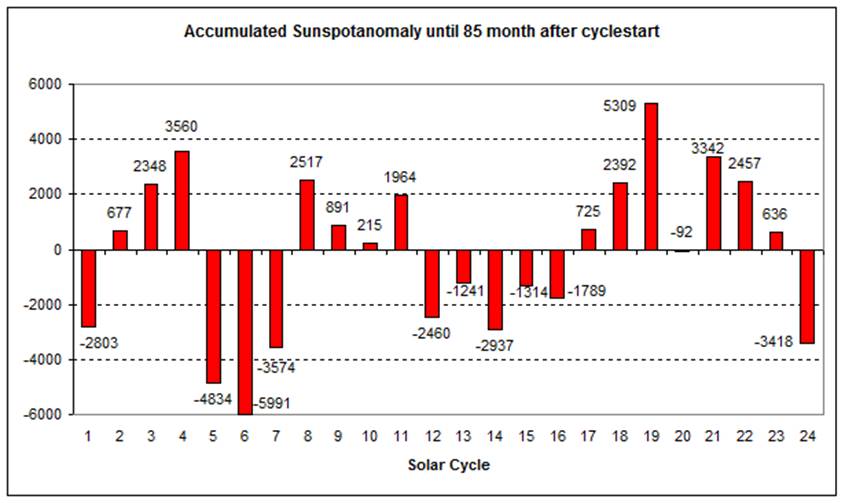
For the entire solar cycle so far (now 7 years and 1 month) the sun’s activity has reached only 56% of the mean solar cycle. The deviation from the mean for the accumulated sunspots of the individual cycles 7 years and one month into the cycle are plotted as follows:

Figure 3: The accumulated solar sunspot anomalies from the mean cycle (blue in Figure 1) for each cycle, 7 years and one month into the cycle.
It is clear to see that the phase between solar cycle no. 17 (started in 1933) and the end of solar cycle no. 23 in 2008 was the most active since systematic observations began. That phase was abruptly ended by the current cycle.


Warmunist cult leader: Cure for cancer less important than fight against Global Warming.
http://www.breitbart.com/video/2016/01/14/obama-might-cure-cancer-temps-go-2-degrees-wont-matter/
Warmunists think of themselves as smart when they say things like that – “See how I can compare potential victim numbers in my head! I’m a smart progressive!”
Why use a proxy (sunspot number) when daily solar irradiance is so readily available?
LASP: http://lasp.colorado.edu/data/sorce/tsi_data/daily/sorce_tsi_L3_c24h_latest.txt
Because there’s much more to the sun’s impact on earth than just solar irradiance.
By the way, the daily LASP data show that average monthly solar irradiance in 2015 was +0.03 W/m2 above 2014’s value(*). No matter what your sunspot numbers say.
*The first 2+ months of solar irradiance data are missing due to satellite problems. Above statement is for the data available after 3/4/2014.
And here’s one example of a correlated, but much more influential, solar parameter and it’s effect on water vapor, the major greenhouse gas: – Solar wind vs temperature
Sorry, David Appell, but it is the solar wind that’s important. It modulates the gamma rays that precipitate cloud formation, which in turn influences temperature to a measurable extent.
Unlike for CO2 which is far less important in determining temperature, Svensmark’s theory just keeps getting support from the data.
Because they can’t regulate solar emissions, they have to put the blame on something they can fool us into thinking they can regulate, i.e., CO2. And that’s despite the fact that effects of changes in it’s concentration, which we have virtually no influence on either, have no significant effect on climate.
Warmunists have concluded that satellites conspire with weather balloons to delude humanity into thinking the globe isn’t warming. Gavin Schmidt in his Bureau Of Adjustments the last fighter for the terrible, globally warming truth.
http://www.breitbart.com/big-government/2016/01/15/climate-alarmists-invent-new-excuse-the-satellites-are-lying/
A, financed by big time coal investor Jeremy Grantham, who publically plays the warmunist-Malthusian peak oil drama queen.
Quite a few years ago I watched a debate between warmists and skeptics, with the audience voted their belief in AGW before and after. The warmists appeared to be losing about half way through, but probably wouldn’t have lost by as much if Gavin Schmidt hadn’t told a lie transparent enough for all to see. But, being a warmist, I guess he just couldn’t help himself.
“Warmunists have concluded that satellites conspire with weather balloons to delude humanity into thinking the globe isn’t warming.”
Sorry, but that is totally wrong. Please look at the data from your link:
http://media.breitbart.com/media/2016/01/GL_MT_Avg_2015-1024×696.png
The balloons do show warming and no pause, only the satellites do not.
Sad Old Duffer,
The chart in the article shows about .1c warming in 35 years. That means it will take about 700 years to add 2c warming. Gee, we are gonna boil the oceans in no time!!
HAHAHAHAHAHAHAHAHAHAHAHAHAHAHAHAHAHAHAHA
Make that .2c in 35 years or 350 years for 2c. I’d better move to the Antartic immediately!!
HAHAHAHAHAHAHAHAHAHAHAHAHAHAHAHAHAHAHAHAHAHAHA
“The chart in the article shows about .1c warming in 35 years.”
You are wrong. from 1995 to now the balloon data shows a 0.4°C
That is 0.2°C per decade , basically exactly what was forecast.
You made an error and you did not start from the lowest point in the dataset.
sod, the red line are the models, not the weather balloons. Have you reached a new level of disingenuity?
the blue circles are the ballon data, the green squares the satellites.
The balloon data does not show a flat line since 1998 but instead shows significant warming.
The balloon data is not supporting the sceptic claim about a pause since 1998.
If you use the sceptic technique of starting the trendline in the lowest point (1995, by chance also a logical 20 years period..) on the balloon data, it gives basically exactly the 0.2°C per decade that we were warned about.
Is There An Antidote To Their Tunnel Vision?
Sun’s Role in the Satellite-Balloon-Surface Issue
As I have “confessed” in the past, I used to be a lukewarm believer in AGW, until I came across the John Daily website “still waiting for greenhouse” almost a decade and a half ago. For me, it was “the red pill.”
More backstory
http://www.friendsofscience.org/assets/files/documents/satdata.pdf
More detail
http://www.drroyspencer.com/2015/05/new-satellite-upper-troposphere-product-still-no-tropical-hotspot/
Interesting that the balloons show NO WARMING from 1975-1998 and very little after 2003
There is very obviously the STEP change around 2000-2001 that all alarmist have to use to create any warming trend at all.
That step change is a bit earlier in the satellite data, but that also clearly shows two distinct period of near zero warming: 1975-1995 and 2000-now.
That step is NOTHING to do with CO2, but a solar forced EL Nino effect, and as it is the ONLY warming in the data, this means that there is NO CO2 WARMING SIGNATURE in the whole of the balloon or satellite data sets.
sod 19. January 2016 at 8:49 PM | Permalink
“If you use the sceptic technique of starting the trendline in the lowest point”
Wow, that’s a “sceptic technique”? You have achieved a new level of making things up. Maybe visit a neurologist. Somethings wrong with the volume of matter between your left and your right ear.
David, you should one day learn about the Svensmark hypothesis and the effect of cloudiness on the albedo. You were once a science journalist so you might even have a passing interest in that.
But instead, on every solar related post you claim that solar irradiance is all that counts. I think you do know better, and you are being intentionally disingeneous and misleading.
If reputation were a prerequisite to becoming a science journalist, this would hamper your efforts of finding new jobs.
But maybe you rely financially now on some Green subsidy billionaire’s support, who knows, and goodbye, science writing. Is it that?
It’s so funny how David never answers on this suggestion. As if he already knew about the Svensmark hypothesis and just spreads his solar irradiation stuff to poison blogs with irrelevant crap. As if he were on a mission, like a Sunsteinian desinformation agent.
David: Please compare the TSI of the mean of all cycles 1…23 with the TSI of the SC24 ( Figure 1) without taking the SSN as a proxy! Good luck!
Hmmm… Interesting to see that “…solar cycle no. 17 (started in 1933)” occurred just a year or two before the hottest years recorded for the US, 1934 and 1936. Given that indirect evidence, now that solar activity is apparently dropping like a rock, what does that auger for the immediate, mid-term, and long-term future?
[…] Fonte: NoTricksZone […]