By Ed Caryl
Yes, you read that right. There has been NO warming in 85 years.
There are many surface land stations with records going back more than 100 years. Some records exist back to 1880 and earlier. GISS cuts the records off at 1880. There are many gaps in these records before 1930, and all the 20th Century warming occurred before then.
How do I know this? I scanned the GISTemp web site for locations with long records, that were as continuous as possible, with a variety of satellite brightness indexes. Because the U. S. Weather Bureau was especially diligent in setting up measurement stations, 60% in this study are U. S. Over the rest of the world it was very difficult to find stations with both long, continuous records, and a zero satellite brightness index. I stopped searching after finding a total of 50 stations.
The satellite brightness index is used by GISS as a proxy for population and thus a proxy for urban warming. It is then used to calculate the amount of “homogenization” to apply to cities and towns. Locations with a brightness index (BI) of 10 or less is considered “rural” and no homogenization correction is applied to those with zero brightness. However, Time of Observation (TOBs) and move corrections are still applied to these stations. GISTemp has downloadable temperature data for: Unadjusted temperature, Adjusted temperature (TOBs and move adjustments), Adjusted and Cleaned data (Cleaning removes data considered unreliable in some way) and Homogenized data. For the 50 stations, Unadjusted, Adjusted and Cleaned, and Homogenized monthly data were downloaded. Of these, 20 stations are considered rural, with a BI of 10 or less. 15 are towns with BI between 11 and 32, and another 15 are cities with a brightness index of more than 32. I attempted to select pairs or triplets of locations that had a large city with close by rural stations. This was easy in the U. S., with the high density of stations, but more difficult in the rest of the world where stations might be separated by hundreds of kilometers.
For all the 150 resulting temperature records, the linear trends for each from 1930 to the present was calculated using Excel. This gives the annual trend numbers in degrees C. Here are summaries of that data presented as bar charts for each group of locations, rural, medium sized towns, and large cities; the bars are for summer and winter data. Summer is June, July, and August in the northern hemisphere, and December, January, and February in the southern. Winter is the reverse of that.
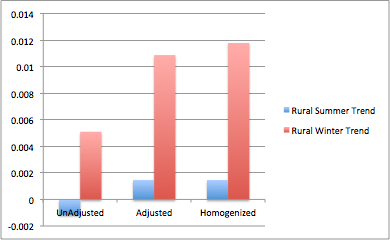
Figure 1 is the rural data. Unadjusted data indicates summer cooling at these stations since 1930. Even the adjusted and homogenized data indicate less than 0.125°C summer warming in 85 years. This is statistically NO warming in the summer. Winter warming is about 1° over 85 years. This may all be due to increasing population and home heating around these stations.

Figure 2 is for towns with BI from 11 to 32. For example, towns like North Platte, Nebraska, Godthaab-Nuuk, Greenland, and Bismarck, North Dakota. The Unadjusted summer trend is almost zero, with the adjusted and homogenized summer trends less than 0.4°/85 years. The winter trends are much higher at 1.36° in 85 years. All of the summer trend increase is due to adjustments; as is nearly half the winter increase.
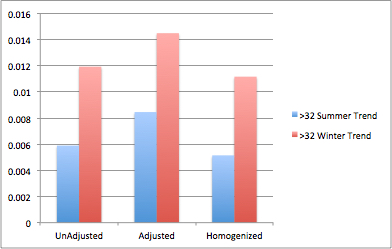
Figure 3 shows the big cities, like Tokyo and New York. It is expected that these locations would have high urban heat island affecting temperatures in summer and winter. Again, adjustments have increased both summer and winter temperature trends, though not as dramatically as for the smaller towns. Homogenization is supposed to correct for this, but has failed to do so for summer trends, and has only made the winter trend slightly less than the rural winter.
This has led to the strange result that medium size towns are supposedly warming faster than large cities by almost 50%.
All of the trend increase in the last 85 years is due to mankind’s desire to keep warm in winter. This inside warmth leaks out into the surrounding environment and is measured by the local weather stations. This, combined with tinkering with the data, has produced all the warming in the last 85 years. There is clearly no warming, and perhaps some modest cooling, in the summer, and all the winter warming is due to direct heating by mankind keeping warm. Shorter term trends, like the 70’s cooling, are due to natural cycles. There is no “hockey-stick”! No “Solution” is necessary.
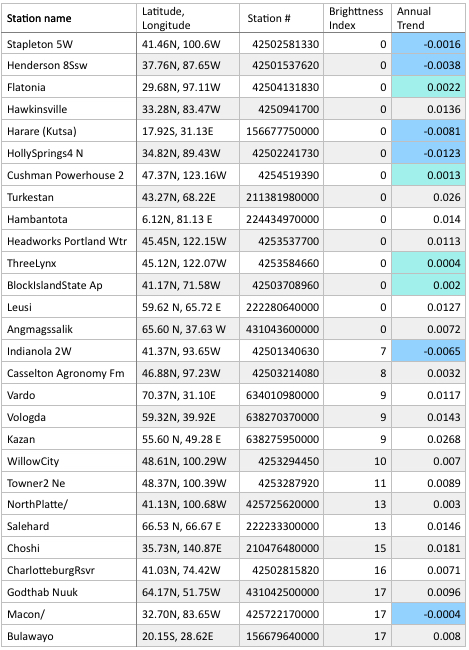
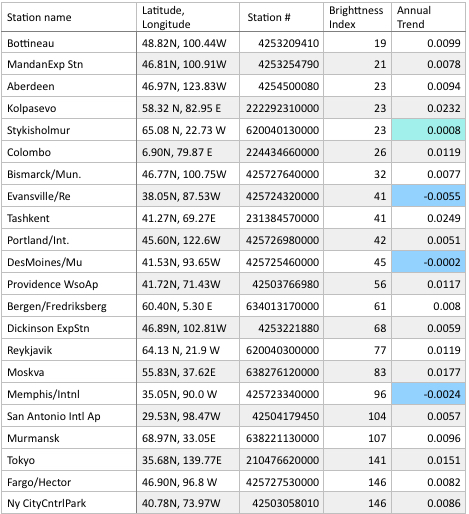
Here is the list of the stations used. There are nine stations with negative annual temperature trends. They are highlighted in blue. Three of those are large cities. Five more have trends between zero and 0.0025°C/year. Most of those are rural.
There is more analysis to be done on this data for future articles.


The “Daily Record” – local paper, in nearby Ellensburg, WA – just reported this April as the second warmest on record.
April 1934 was No. 1.
That was 82 years ago.
So, more or less, the “Daily Record” confirms your study.
The closest station in GIStemp is Cle Elum. The unadjusted data shows cooling in the last 85 years, but after all the manipulations, the homogenized data shows warming (surprise!) but with large gaps where the warm years in the 1930s and 40s are thrown away. See the chart and move the cursor over “unadjusted” in the legend. http://data.giss.nasa.gov/cgi-bin/gistemp/stdata_show.cgi?id=425004515040&dt=1&ds=5
Hi Ed,
Cle Elum and Ellensburg are problematic regarding weather reports.
The Lat/Long for the station you link to is rounded off and not at a weather station. For many years reports were sent by a lady at this location (her back yard):
47.186333, -120.947353 (Google Earth coordinates)
She became ill and stopped sending reports. (I called and talked to her.) There was a break (many months) and a new site was established at the waste treatment facility. My wife and I visited there and took photos.
47.189030, – 120.912884
This location is the metal roofed shed housing electronics. The rain and snow parts are just west and the temperature sensor is close to the fence & trees. The sensor is 7 feet up from the red-rock surface. 7 feet is the maximum snow depth known in Cle Elum. The red rock is from an under ground coal mine. Note the black asphalt and the sewage digestors.
Ellensburg has several issues. The airport reports as does another station south of town at a new sewage treatment place. This one moved many times. Some are: one time the station was behind the radio station, then moved to the old sewage place, then to a gravel parking area at the Fire Station (with charcoal grills nearby) and then to the current location, here:
46.969048, -120.540631
Temperature sensor is under the tree, about 3 feet from the asphalt.
Treated water flows into the Yakima River about 1 km SW of the facility and that location is given as the “location” of the weather station (The Department of Ecology requires that spot be known, but it has nothing to do with weather.)
A couple of us documented these things when WUWT was building the Surface Stations data base. A friendly pilot took some photos from her own plane. The Surface Station data base files no longer work for me, but maybe I need new URLs or something.
Anyway, if one wants to plan a picnic or a hike getting readings from such places are fine.
http://onlinelibrary.wiley.com/doi/10.1029/2007JD008465/abstract
[E]xtraneous (nonclimatic) signals contaminate gridded climate data. The patterns of contamination are detectable in both rich and poor countries and are relatively stronger in countries where real income is growing. We apply a battery of model specification tests to rule out spurious correlations and endogeneity bias. We conclude that the data contamination likely leads to an overstatement of actual trends over land. Using the regression model to filter the extraneous, nonclimatic effects reduces the estimated 1980–2002 global average temperature trend over land by about half.
—–
http://www.sciencedirect.com/science/article/pii/S0169809515000988
Highlights
•The seasonal and temporal variability and trends of UHI in Athens was studied.
•UHI [the Urban Heat Island effect] accounts for almost half of Athens’ warming.
The study explores the interdecadal and seasonal variability of the urban heat island (UHI) intensity in the city of Athens. Daily air temperature data from a set of urban and surrounding non urban stations over the period 1970–2004 were used. Nighttime and daytime heat island revealed different characteristics as regards the mean amplitude, seasonal variability and temporal variation and trends. The difference of the annual mean air temperature between urban and rural stations exhibited a progressive statistically significant increase over the studied period, with rates equal to + 0.2 °C/decade. A gradual and constant increase of the daytime UHI intensity was detected, in contrast to the nighttime UHI intensity which increases only in summer, after the mid 1980s.
—–
http://onlinelibrary.wiley.com/doi/10.1002/2014GL062803/abstract
Observations from the main mountain climate station network in the western United States (US) suggest that higher elevations are warming faster than lower elevations. This has led to the assumption that elevation-dependent warming is prevalent throughout the region with impacts to water resources and ecosystem services. Here, we critically evaluate this network’s temperature observations and show that extreme warming observed at higher elevations is the result of systematic artifacts and not climatic conditions. With artifacts removed, the network’s 1991–2012 minimum temperature trend decreases from +1.16 °C decade−1 to +0.106 °C decade−1 and is statistically indistinguishable from lower elevation trends. Moreover, longer-term widely used gridded climate products propagate the spurious temperature trend, thereby amplifying 1981–2012 western US elevation-dependent warming by +217 to +562%. In the context of a warming climate, this artificial amplification of mountain climate trends has likely compromised our ability to accurately attribute climate change impacts across the mountainous western US.
—–
http://www.sciencedirect.com/science/article/pii/S1364682615000577
Highlights: Observe an overestimation of temperature after including non-valid stations.
Abstract: Starting from a set of 6190 meteorological stations we are choosing 6130 of them and only for Northern Hemisphere we are computing average values for absolute annual Mean, Minimum, Q1, Median, Q3,Maximum temperature plus their standard deviations for years 1800–2013, while we use 4887 stations and 389 467 rows of complete yearly data. The data quality and the seasonal bias indices are defined and used in order to evaluate our dataset. After the year 1969 the data quality is monotonically decreasing while the seasonal bias is positive in most of the cases.
—–
http://link.springer.com/article/10.1007%2Fs10666-014-9429-z
New Zealand provides a rare long temperature time series in the Southern Hemisphere, and it is one of the longest continuous climate series available in the Southern Hemisphere Pacific. It is therefore important that this temperature dataset meets the highest quality control standardsNew Zealand’s national record for the period 1909 to 2009 is analysed and the data homogenized. Current New Zealand century-long climatology based on 1981 methods produces a trend of 0.91 °C per century. Our analysis, which uses updated measurement techniques and corrects for shelter-contaminated data, produces a trend of 0.28 °C per century.
—–
http://onlinelibrary.wiley.com/doi/10.1002/joc.971/abstract
During winter (December 2001–March 2002), the urban area averaged 2.2 °C warmer than the hinterland. The population has grown from about 300 residents in 1900 to more than 4600 in 2000. In recent decades, a general increase of mean annual and mean winter air temperature has been recorded near the centre of the village, and a concurrent trend of progressively earlier snowmelt in the village has been documented. Satellite observations and data from a nearby climate observatory indicate a corresponding but much weaker snowmelt trend in the surrounding regions of relatively undisturbed tundra.
—–
http://www.sciencedaily.com/releases/2015/11/151118131726.htm
Temperatures in the urban core of Minneapolis, St. Paul and Bloomington average 2 °F higher in summer than in surrounding areas. The differential spiked as much as 9 °F higher during a heat wave in July 2012. Urban heat island effect is stronger at night in summer and during the day in winter. In urban areas during the winter when snow cover is less pervasive, temperatures are higher than rural areas in the daytime by an average of 2 °F.
—–
http://link.springer.com/article/10.1134%2FS000143381509011X#/page-1
This article presents the results of a study of the urban heat island (UHI) in the city of Apatity [Russian Arctic] during winter that were obtained according to the data of field meteorological measurements and satellite images. Calculations of the surface layer temperature have been made based on the surface temperature data obtained from satellite images. … As a result of the analysis of temperature fields, an intensive heat island (up to 3.2°C) has been identified that was estimated based on the underlying surface temperature, and its mean intensity over the observation period significantly exceeds the representative data for European cities in winter. It has also been established that the air temperature calculated according to the MODIS data is systematically higher under winter conditions than the air temperature from direct measurement data.
—–
http://journals.ametsoc.org/doi/abs/10.1175/JAMC-D-14-0295.1?af=R&utm_source=feedly&utm_medium=webfeeds
The trend of surface air temperature (SAT) is a critical indicator to climate change in varied spatial scales. Due to urbanization effects, however, the current SAT records of many urban stations can hardly meet the demands of the studies. Evaluation and adjustment of the urbanization effects on the SAT trends are needed, which requires an objective selection of reference (rural) stations. … The results showed a highly significant urbanization effect of 0.074°C/10yr and urbanization contribution of 24.9% for the national stations of mainland China for the time period 1961-2004
—–
http://link.springer.com/article/10.1007%2Fs00704-013-0894-0
Daily minimum temperature (Tmin) and maximum temperature (Tmax) data of Huairou station in Beijing from 1960 to 2008 are examined and adjusted for inhomogeneities by applying the data of two nearby reference stations. Urban effects on the linear trends of the original and adjusted temperature series are estimated and compared. Results show that relocations of station cause obvious discontinuities in the data series, and one of the discontinuities for Tmin are highly significant when the station was moved from downtown to suburb in 1996. The daily Tmin and Tmax data are adjusted for the inhomogeneities. The mean annual Tmin and Tmax at Huairou station drop by 1.377°C and 0.271°C respectively after homogenization
—–
http://www.sciencedirect.com/science/article/pii/S1352231099001314
[I]n the climate of Poland the occurrence of the UHI is the most important feature of urbanized areas. Over 80% of nights are characterized by surplus heat in towns, amounting to 2–4°C, and sporadically to 8°C and more.
—–
http://www.sciencedirect.com/science/article/pii/S0034425709003174
On a yearly average, urban areas are substantially warmer than the non-urban fringe by 2.9 °C
—–
http://www.tandfonline.com/doi/abs/10.1080/01431169208904271#.UyMwZoXLLEw
The results indicate that urban heating is attributable to a large excess in heat from the rapidly heating urban surfaces consisting of buildings, asphalt, bare-soil and short grasses. In summer, the symptoms of diurnal heating begin to appear by mid-morning and can be about 10°C warmer than nearby woodlands.
—–
http://onlinelibrary.wiley.com/doi/10.1002/%28SICI%291097-0088%28199608%2916:8%3C935::AID-JOC64%3E3.0.CO;2-V/abstract
The long-term mean annual temperature record (1885 –1993) shows warming over the past century, with much of the warming occurring in the most recent three decades. However, our analyses show that half or more of this recent warming may be related to urban growth, and not to any widespread regional temperature increase.
—–
http://onlinelibrary.wiley.com/doi/10.1029/2010JD015452/abstract
[R]apid urbanization has a significant influence on surface warming over east China. Overall, UHI effects contribute 24.2% to regional average warming trends. The strongest effect of urbanization on annual mean surface air temperature trends occurs over the metropolis and large city stations, with corresponding contributions of about 44% and 35% to total warming, respectively. The UHI trends are 0.398°C and 0.26°C decade−1. The most substantial UHI effect occurred after the early 2000s, implying a significant effect of rapid urbanization on surface air temperature change during this period.
Thank you, Kenneth, for that incredible list. I will copy that.
” There is clearly no warming, and perhaps some modest cooling, in the summer, and all the winter warming is due to direct heating by mankind keeping warm. ”
sorry Ed, have you ever been outside in winter?
What sort of heating do you think is heating thermometers outside?
we are talking about min/max temperatures here. So you claim that people heat the minimum night temperature outside their houses.
That is simply and totally insane.
Did you read Kenneth’s comment above?
No matter how much houses are insulated, the heat inside goes outside. That is why in winter heating devices run periodically to make up for the losses. Otherwise no heating devices would be needed. Next winter, turn off your furnace and see what happens.
“Did you read Kenneth’s comment above? ”
yes. it is a random assortment of articles mentioning the term “UHI”, some of which contradict each other or contradict your claims:
“A gradual and constant increase of the daytime UHI intensity was detected, in contrast to the nighttime UHI intensity which increases only in summer, after the mid 1980s.”
and this one from the Poland article:
“. In winter, favorable conditions for the existence of the UHI occur less frequently”
UHI is caused by concrete storing heat better than soil. and by buildings blocking wind. There are small other aspects, but these two are the most important.
“heating buildings” is not a major part of UHI. Please provide some more scientific discussion on that subject. I would love to be shown to be wrong!
Yes, sod, you are. It is very sad.
Sod’s “noise filter” is amazing. It faithfully filters out all trace of signal, and amplifies the noise.
Very sad, indeed.
For examples of heating the outside in winter, Google infrared house heat loss and then click on images. All the energy used for heating (and any other use) eventually finds its way into the surrounding environment. Energy doesn’t disappear except into thin air, heating it, then it is eventually radiated away into space.
“For examples of heating the outside in winter, Google infrared house heat loss and then click on images. ”
I asked a simple question: please provide links to the scientific debate on the topic of houses heating the outside in winter.
please explain, how does the heat leaving the house in the middle of the night make it into the stevenson screen, even if (worst situation) it is only a dozen meter away from the house?!?
you made up an explanation, that is directly contradicted by multiple sources linked and cited by Kenneth above!
“The Awful Truth About Global Temperature Records”
As I summarized there, “there has been NO global warming since the development of the Standard Atmosphere model a century and more ago”.
The “pause” in UAH data is vanishing a little more with another extreme month:
http://www.drroyspencer.com/2016/05/uah-v6-global-temperature-update-for-april-2016-0-71-deg-c/
And most people can no longer deny the warming, as they see the fires burning around their houses:
http://www.bbc.com/news/science-environment-36212145
But there always will be some “pause meme” to confuse the public.
this “pause” is generated by some simple tricks:
looking mostly at US stations, with warm 30s, which happened exactly 80 years ago (by pure chance, about the time frame of this study.
ignoring modifications that compensate data errors.
false explanations (like heating increasing the temperature outside) to explain the false data.
a very strange winter/summer distinction, also used to provide false explanations.
Poor sob, has no idea what a “transient response is.
It will be hilarious to watch him later in the year when the temperatures have dropped back down and the plateau extends even longer.
Meanwhile in another part of the world.. Cooling in the Antarctic for the whole of the satellite record, and no warming in the southern ex-tropics.
http://s19.postimg.org/5ezsuxp9v/UAH_So_Pol.png
http://s19.postimg.org/6i8mcowfn/UAH_So_Extropical.png
The so-called “global” El Nino spike was only noticeable in the tropics and the northern hemisphere, and it was winter in the NH.
“Poor sob, has no idea what a “transient response is.” – AndyG55
Buddy and sod and their pals are what one might refer to on a blog like that as “interfering transients.” Their “responses” are just all noise, all the time.
“The “pause” in UAH data is vanishing a little more with another extreme month:” – sod
Actually, temps have begun to fall from last month’s peak. And before you post about his data, do bother to read what Spencer wrote about it.
http://www.drroyspencer.com/2016/05/uah-v6-global-temperature-update-for-april-2016-0-71-deg-c/
“I expect average cooling to continue throughout the year as El Nino weakens and is replaced with La Nina, now expected by mid-summer or early fall.” (yes, I know the rest of what he writes, but am only pointing out that your amateur blathering is at odds with his professional opinion. I know that counts for nothing with you, but someone else might want to know.)
———————————————–
But seriously, sod, I agree that we really ought to try cooling the world, because as you can see, Maine gets far too hot in the winter! //s//
http://www.wunderground.com/hurricane/2009/merecordlow.jpg
Climate-gate exposed governmental agenda behind global warming…
The scandal irrupted in 2009 when Professor Phil Jones who was the leading scientist for the Climate Research Unit had his Email account hacked, which uncovered 1000’s of Email correspondences between Jones and his team of scientists.
The E-mails clearly exposed the contrivance among the scientists to squelch global-warming skeptics by falsifying data.
The reality is that world’s cyclical weather patterns are pointing towards a little ice age, so they were forced to modify the narrative to ‘climate change.’
In other words, Phil Jones and his team were caught red handed.
—–
Sod seems to think that all home insulation is perfect. If it were, Sod, we could heat our homes with a candle.
A candle? I don’t think so, Ed. If it were perfect, a candle would be too much (provided the kids don’t run in and out all the time).
” There is clearly no warming, and perhaps some modest cooling, in the summer, and all the winter warming is due to direct heating by mankind keeping warm. ”
That is laughable.
1) The Arctic ice sheet is now more than 1,000,000,000 square kilometers BELOW the level of 2012 for this time of year, the last year a record low ice melt was recorded. The years of 2013 and 2014 were “bounce years”…as the Arctic ice recovered for a couple of years….before continuing its descent in 2015 (NOTE: There have been SEVERAL instances of bounce years since 1980….and each “recovery period” has been followed by LOWER LOWS). This year will likely SHATTER the old record low. So I guess all that heat that man is using to keep warm…is somehow making its way up to the Arctic to melt the ice sheet….and making its way to the Antarctic to help melt the West Antarctic ice sheet. Or…are the seals and salmon now using space heaters to keep warm? FASCINATING.
http://climatechangegraphs.blogspot.com/2012/08/arctic-sea-ice-volume-extent-charts_30.html
If you go to the 5th set of graphs in the above link, you will find the “SST Anomaly” graphic. You can clearly see that the waters surrounding the Arctic are much warmer than normal.
2) Record high temperatures continue to overwhelm record low temperatures in Russia, Canada, and the US (those countries comprise most of the land mass surrounding the Arctic Ocean. As “arctic amplification” continues to kick into high gear.
http://climatechangegraphs.blogspot.com/2012/08/ratio-of-new-daily-record-high-temps-to_30.html
http://climatechangegraphs.blogspot.com/2012/08/ratio-of-new-record-high-temps-to-new_36.html
Of course it is impossible for the earth to be cooling….when you have Russia (very large land mass) setting record high temperature records more than 3.4 TIMES the amount of new record low temps. As well….Canada is setting new record high temps at the rate of more than 2.6 times the record lows over the current decade.
These are only 2 countries, and whose thermometers are placed in urban environments.
Buddy is proof positive that activists brains are perfectly insulated against the truth. Just one e.g., is what Buddy writes above about the Arctic – any normal person would be utterly embarrassed when shown that his claims were completely fictional, as is done here.
http://motls.blogspot.com/2016/05/arctic-ice-area-safely-higher-in-2016.html
…but not Buddy. No sir! He will just double down on stupid, taking proof that he’s wrong and claiming it shows he is correct.
“The difference [in ice extent between years] is not ‘significant’ to the extent that a sane person would care about it” – Lubos Motl
But care Buddy does, and wants us to as well. And if we don’t, he’ll keep on lying in hopes that some day we will. Because if there’s one thing a stupid person hates, it is being stupid alone.