By Ed Caryl
The Warmunists are fond of stating that the warming in the late twentieth century was unusual and unprecedented, and could only have been caused by rising CO2. They refuse to recognize that the early twentieth century warming was just as rapid. Of course that statement is also based on the lack of data for earlier times.
But there ARE data for earlier times. The Central England Temperature (CET) data set extends all the way back to 1659 and has been maintained to this day. Here is a window into an early 90-year section of that data set, overlaid with the last 90 years.
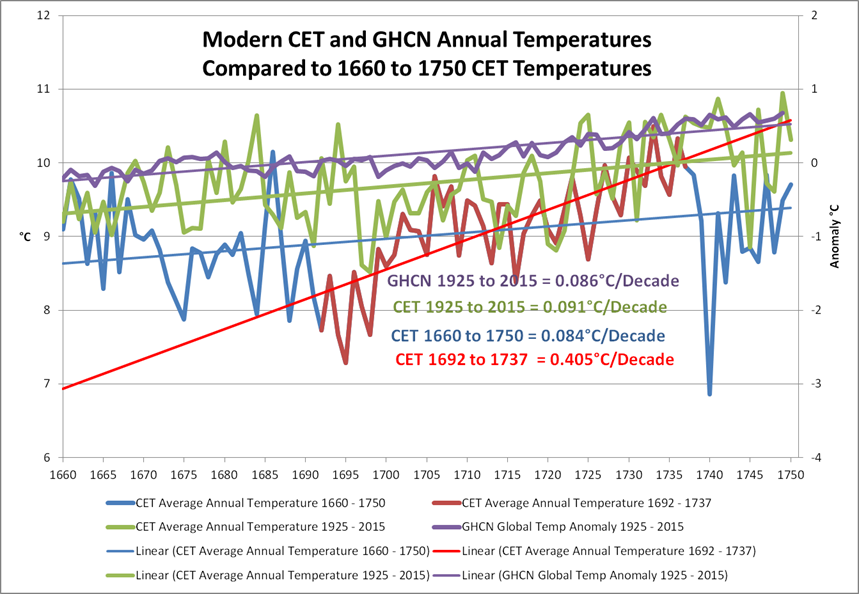
Figure 1 is CET and GHCN temperatures from 1925 to the present, compared to CET temperatures from 1660 to 1750. The 45-year span from 1692 to 1737 is highlighted in red.
If the trends for all three 90-year data sets are compared, they are nearly identical, from 0.084 to 0.091°C per decade warming.
But the 45-year span from 1692 to 1737 was warming at nearly five times that rate, 0.4°C per decade. This warming rate is more than twice as fast as the late twentieth century rate, for twice as long.
Central England warmed by two degrees, three degrees if one measures from the coldest year to the warmest in that interval. For comparison, here is the GHCN data for the modern period.
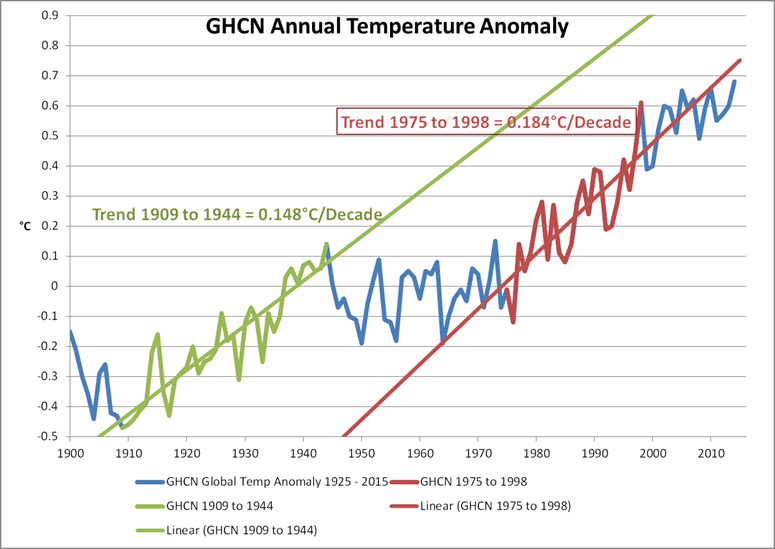
Figure 2 is the modern era from GHCN with the modern warming in red and the early twentieth century warming in green.
Please note that I have picked the time period with the most warming in that interval, including from the bottom of the 1976 La Niña to the top of the 1998 El Niño. The early twentieth century warming began with the 1914-15 El Niño. If the El Niño and La Niña events are removed, both warming periods have a trend of about 0.16°C per decade. The 0.4°C/decade warming period from 1692 to 1737 must have been very scary for the eighteenth century climatologists.
It all came to an abrupt end, however, in 1739 and 1740. The temperature dropped three degrees practically overnight in climate terms. See figure 1. What caused that? A volcano!
On the southern end of Hokkaido, in Japan, there is a large caldera called Shikotsu. It is now filled with a lake. This caldera was formed about 35,000 years ago. On the edge of the caldera three volcanic vents have been intermittently active since then. One of those, Tarumai, (or Tarumae) is active to this day, including four VE5, very large eruptions in 6950 BCE, 800 BCE, 1667, and 1739. Though both the 1667 and 1739 eruptions were classed as VE5, the 1739 event pushed enough gas into the stratosphere to affect global climate.
“In the northern hemisphere density of yearly tree ring [sic] have changed in AD 1740 (Briffa et al., 1998) suggesting the eruption of 1739 affected global climate.”
Sheveluch, on Kamchatka, is also implicated, but that eruption was only a VE3.
The resulting cold caused the “Great Irish Frost” of 1740, where Irish harbors and rivers froze over, preventing import of grain, frost killed the potato crop, and 20 to 30% of the Irish population died of cold and famine. The cold affected all of northern Europe, but was a disaster for Ireland due to the politics of the time. For a scholarly treatise on it see The Irish famine of 1740–1741: famine vulnerability and “climate migration”, here. The implication is that the good years prior to 1740, made Ireland in particular, vulnerable to a cold snap. This is the thing to be feared in our future rather than continued warming.


EIKE has also very long term data from other cities, Paris, Vienna, etc. and reached the same conclusion. I’m working with Ed to improve the graphics – bear with us for a bit.
An interesting paper, found in another discussion group, on the relations between the positions of planets, solar activity and climate variations.
http://gpcpublishing.com/index.php?journal=gjp&page=article&op=view&path%5B%5D=443
(previously posted by error in the nutrition thread)
Documentation of the solar activity variations and it’s influence on climate
Dimitris Poulos
Abstract
The four planets that influence the most the solar surface through tidal forcing seem to affect the Earth climate. A simple two cosine model with periods 251 years, of the seasonality of the Earth – Venus syzygies, and 265.4 years, of the combined syzygies of Jupiter and Mercury with Earth when Earth is in synod with Venus, fits well the Northern Hemisphere temperatures of the last 1000 years as reconstructed by Jones et al (1998). The physical mechanism proposed is that planetary gravitational forces drive solar activity that in turn drives temperature variations in earth. The sun is in a boundary balance state at one hand collapsing due to gravity and at the other hand expanding due to fusion, and as such it should be heavily influenced by minimal external forcings such as planetary gravity. Sound waves in the solar mass, created from the planetary movement, are responsible for the formation of solar corona and sun spots. The Earth-Venus 251 year resonance is resonant to a near surface solar layer’s thermal natural frequency that “explodes” to form solar wind. The calculated solar wind properties match the observed.
I have long noticed that the period from 1910 to 1940 had nearly identical warming as the period 1975 to 2005. The notion that recent warming is “unprecedented” is malarkey. We are still recovering from the LIA which is probably going to take another hundred years or so if we don’t hit another cold spell. Wake me up when the cattle in Greenland are again grazing.
The warminists are immediately going to respond with, but those cities/countries are not “Global” as they did with the Mini Ice Age and Medieval Warm Period.
They already have on my Facebook posts.
So have them explain, if the LIA was LOCAL in Europe, then where was the offseting centuries-long heatwave to make Micky Manns Hockeystick real. And why did one continent turn ice cold and a different one on the other side of the planet turn hot. I sense there must be a model for that.
A C point them here http://www.climate-lab-book.ac.uk/2015/what-have-global-temperatures-ever-done-for-us/
CET is a good proxy for global temps
phil jones made a study of this same period in 2006. he came to the conclusion that natural variability was much greater than had hitherto been realised.
tonyb
Ed, you are using unadjusted data. Adjust them, and the problem will go away.
/sarc
I’m shocked! Climate changes involve more than the one sacred variable – carbon! This invalidates the UN mandate to NOT study other variables of long-term weather and makes a mockery of the ‘settled science’ mime.
If you did not learn that more than aGHGs change the climate, you haven’t seriously studied the science.
The lapse is your’s, not the UN’s.
If you think that more aCO2 has any affect on the climate, you are a gullible base-level anti-science moron who has absolutely zero understanding of anything to do with science.
The rotten appell is a classic example of this gullibility and idiocy.
He is a low-level sci-fi propaganda journalist with basically zero understanding of any real science.
And if you have learned it, and say it in public, your a “denier,” and subject to abuse of prosecutorial power by activist AG’s.
P.S.
“One-half of CO2 doubling achieved
Detectable impacts on the climate are yet to be seen”
http://motls.blogspot.com/2014/09/one-half-of-co2-doubling-achieved.html
Lose the anger, David. All it does is make a person stupid.
Thank you for clarifying that all the nonsense over CO2 is just that—nonsense. It’s a complex system with many variables. Now that we have established that trying to control it using CO2 is rediculous, can we move on to more important things?
Please, it is the warmists who worship carbon as the overwhelming PREDICTIVE variable that will destroy our biosphere.
Real scientists don’t get nervous when new factors are discovered affecting their PREDICTIVE models. Real scientists don’t have tantrums when historical climate periods are discovered that don’t fit into their PREDICTIVE models. Real scientists don’t secretly smile when thugs like Loretta Lynch threaten to lockup those that disagree with them. Real scientists are not emotionally attached to the weight of individual variables in their long-term PREDICTIVE models. Real scientists don’t pretend that linear regression techniques used to PREDICT chaotic systems are ‘settled science.’ Real scientists don’t cherry pick data and knee-jerk discount data (satellite) that goes against their hypothesis.
You should be ashamed of yourself for even claiming to embrace the scientific method.
[…] Unprecedented? Central England Warming Of 1692 – 1737 Twice As Fast As Late 20th Century Warming! [link] […]
Ed, did you think no one would no one would notice you cherry picked your interval?
For shame.
Erm apparently no one can read;
“Please note that I have picked the time period with the most warming in that interval, including from the bottom of the 1976 La Niña to the top of the 1998 El Niño”
Warmist definition of “Cherry Picking” is any interval, no matter how long, that contradicts their fantastic claims. Of course, when they chose an interval, no matter how short, that they claim as “proof” of AGW, well that’s OK!
David: I did notice that most climate change cherry picks the interval. If you don’t use the entire length of the data—1629 to current times—you can certainly be accused of cherry picking.
You apparently did not understand the post since the post is addressing the claim that modern industrial warming is higher than any time in the past, which it clearly is not.
Ed, what kind of statistical analysis did you use?
Just look at the data and you can see, that changes in the old “set” are much bigger than what they are today:
http://www.metoffice.gov.uk/hadobs/hadcet/
you cab clearly see, that huge changes from +1 to -1.5°C were pretty common in the past and have become extremely rare in the new and better data.
why do you not just add an error band, looking at decadal variability?
Would ruin your claims, of course!
PS: any comparison between CET and global data is plain out false of course.
“and have become extremely rare in the new and better data”
The “new and better data” will be the old, accurate data that has been Mannipulated using an AlGoreithm provided by Mosh, Kev and Gavin, presumably?
I see you believe that our predecessors were so thick they couldn’t read thermometers. In that case you would have fitted in well back then.
“I see you believe that our predecessors were so thick they couldn’t read thermometers.”
This has nothing to do with believes. Just look at the data:
http://www.metoffice.gov.uk/hadobs/hadcet/graphs/HadCET_graph_ylybars_uptodate.gif
Either temperature changes were much wilder in the past OR (much more likely) there is a problem with the data.
This can be solved in 5 minutes. Just add error bars to the graph (i always thought that sceptics like error bars?!?).
“there is a problem with the data.”
So again.. sob gives ZERO proof.
All we ever expect from him.
Hey, AndyG55, can’t you see he gave you a link to the MET data! Or, as you say, he gives “ZERO proof.”
Here’s some commentary on two other sources of data, including special sections on the data tampering they indulge in, which sob conveniently (for his uninformed arguments) ignores.
https://notalotofpeopleknowthat.wordpress.com/tag/giss/
https://notalotofpeopleknowthat.wordpress.com/tag/ghcn/
But, what IF temps were going up? Shouldn’t we be pursuing alt energy sources?
Not just no, but H*** NOT!!!
http://dailycaller.com/2016/05/23/professor-fighting-global-warming-will-impoverish-everyone/
Furthermore:
“…the Met Office’s own forecasts have become so skewed by its obsession with global warming that its incessant predictions of “hotter, drier summers” and “warmer, wetter winters” have made them the last people to rely on.”
http://www.telegraph.co.uk/comment/11938459/Met-Office-shown-to-be-wrong-by-its-own-data.html
(no doubt will be able to refute this with his usual low standards of “proof” from his church-of-globull-warming sources. …good for a laugh until, as with all missionary propaganda, it gets old.)
“So again.. sob gives ZERO proof.”
Are you blind?
http://www.metoffice.gov.uk/hadobs/hadcet/graphs/HadCET_graph_ylybars_uptodate.gif
Do you really think, that 2°C jumps from year to year were pretty common in the past and now are no longer?
Why not? That was in the depths of the LIA. Of course the statistics of a temperature metric are different when there’s more ice around.
Temperature statistics depend strongly on abundance of water and on the state it is in.
And as the LIA was caused by a Grand Solar Minimum, cloudiness must have been different.
You just wait what happens as the new Grand Minimum unfolds. Of course we need to chase out the temperature forgers from the institutes first, the Joneses and Schmidts.
What are you smoking, sod? (and NO, I don’t want any)
You’re “proof” is “ZERO proof,” because it’s the testimony of KNOWN liars (they are all in it together.
https://notalotofpeopleknowthat.wordpress.com/2015/02/04/temperature-adjustments-transform-arctic-climate-history/
https://notalotofpeopleknowthat.wordpress.com/2015/07/20/noaa-tampering-exposed/
https://notalotofpeopleknowthat.wordpress.com/2015/01/29/temperature-adjustments-around-the-world/
A gullible fool wants us to believe serial liars, and then mocks us when we don’t. And, he wants us to believe that “renewable” energy con artists have our best interests at heart.
https://stopthesethings.com/2016/05/30/panic-erupts-infigen-set-to-offload-worn-out-australian-wind-farms-to-even-greater-fools/
Everything he knows about these (and lots of other) matters is as wrong as can be.
“Do you really think, that 2°C jumps from year to year were pretty common in the past and now are no longer?”
Seems you skipped history as well as maths and science at high school.
The LIA was often cold one year, hot the next. The history books confirm these biggish swings.
Your ignorance yet again leaves you floundering with no science to back up anything you say.
“Your ignorance yet again leaves you floundering with no science to back up anything you say.” – AndyG55 to sod
For some strange reason he’s impervious to facts.
Twice as fast as the late twentieth century warming indeed! Or maybe even three times as fast because the late twentieth century warming is a hoax. What they have done is to include the hiatus of the eighties and nineties that lasted from 1979 to 1997 as a fake warming that does not exist. With that they changed an 18 year stretch of no-warming into a warming period and attached it to their late twentieth century warming. You can see what that period was like before in figure 15 of my book “What Warming?” The fake warming replaces it in all ground-based temperature curves but the hiatus is still visible in satellite temperature curves today.
“but the hiatus is still visible in satellite temperature curves today ”
How true that is.
In UAH and RSS there was NO WARMING from the 1980 to the start of the 1998 El Nino is mid 1997.
http://s19.postimg.org/f3dhdpmlv/UAH_before_El_nino.png
http://s19.postimg.org/q3j2zxgab/RSS_before_1998_El_Nino.png