The conceptualization of “global warming” has become so entrenched in the lexicon that few give much thought to its dubious derivation.
Many assume that “global warming” actually means that all or nearly all of the globe is warming as a consequence of the “well-mixed” greenhouse gases in the atmosphere (i.e., CO2 concentrations have indeed reached right about 400 parts per million from the Arctic to Antarctica, or all across the globe). In reality, however, only parts of the globe have been warming. Large regions of the Earth have seen stable or falling temperatures in recent decades, or even dating back to the mid-20th century, when anthropogenic emissions have been claimed to have caused most climate changes.
The only means by which it could be said that we have had global-scale warming is to presume that only the overall net temperature difference counts – for all the regions of the world added together. The regions of the world where it has not been warming necessarily do not count in the “global warming” conceptualization.
Let’s say that Greenland has warmed by 1.2° C since 1979, but Antarctica has cooled by -0.9° C since 1979. Would it be misleading to add these two regions together and claim that the poles have warmed by tenths of a degree in the last 37 years? Yes, because one pole has not been warming, but cooling – even though both poles are subjected to the same atmospheric CO2 concentrations. But this mischaracterization of temperature trends (effectively claiming that both poles have been warming when only one has) is precisely what is done in framing the “global warming” conceptualization.
As a prototypical example of “global warming” manufacture, consider the recently published Riser et al. (2016) paper entitled, “Fifteen years of ocean observations with the global ARGO array” (below). The 25 authors summarize the temperature changes in the 0-700 m near-surface layer for all the ocean regions combined since 1950. They point out that the Pacific Ocean all the way “from Chile to Alaska” has cooled by -1° C during the last 65 years. Other parts of the oceans have warmed by 1° C to compensate. And when all the cooling and warming regions of the oceans are added together, the warming regions barely win out, scoring a net gain of “nearly 0.2°C” since the mid-20th century. So because the net temperature change has been slightly positive, it can technically (albeit misleadingly) be said that the global oceans have been warming. This way, the large regions of the oceans that have been cooling can be buried and ignored, and the “global warming” conceptualization remains intact.
“Most regions of the world ocean are warmer in the near-surface [0-700 m] layer than in previous decades, by over 1° C in some places. A few areas, such as the eastern Pacific from Chile to Alaska, have cooled by as much as 1° C, yet overall the upper ocean has warmed by nearly 0.2° C globally since the mid-twentieth century.”
Of course, when addressing periods of climate history, such as the Medieval Warm Period, the same advocates who now say modern warming has been global and synchronous insist that the evidence shows the Medieval Warm Period was only warmer than now in Europe, or in Greenland, but the rest of the world didn’t warm. This is false — hundreds of peer-reviewed scientific papers have documented evidence of warmer temperatures during Medieval times throughout vast regions of the Earth, including in Antarctica. But if the standard is that the warming must be ubiquitous to “count” as global warming, then the modern era fails that standard miserably. Because the globe is not warming. Only some regions are. Other regions haven’t warmed in decades, or have been, in fact, cooling.
Below is of highlighted summary of the scientific literature (over 30 peer-reviewed papers) documenting some of the regions of the world where there has been no detectable warming trend during the period of time that anthropogenic CO2 emissions have been claimed to have dominated climate changes (generally since the mid-20th century). As the scientists indicate, large portions of the Pacific, Atlantic, Indian, and Southern Oceans have been cooling in recent decades. There is also scientific documentation of recent (20th/21st century) cooling (or no long-term warming trend) in the southeastern U.S., Northern Europe, Antarctica, China, Canada/Canadian Arctic, Western South America (Chile), South Africa, Greenland, Iceland, Antarctica, and the Arctic. One has to wonder how and from where a large net “global warming” signal could have been obtained when there has been so much regional cooling.
Perhaps it can be explained why temperature changes since the 20th century have been called “global warming” caused by anthropogenic CO2 emissions when large regions of the globe have not been warming, but cooling, for the last several decades. Do uniformly rising CO2 concentrations cause cooling in some places, and warming in others — or warming in some decades, and cooling in others? If so, what is the scientific basis for this selectivity?
Pacific, Atlantic, Indian, Southern Ocean Cooling
The “entirety” of the Pacific Ocean and Indian Ocean, as well as the eastern Atlantic, have been cooling below depths of 2000 m (“about 52% of the ocean lies below 2000 m”) since 1992.
Discussion: “Over the 20 yr of the present ECCO state estimate, changes in the deep ocean on multiyear time scales are dominated by the western Atlantic basin and Southern Oceans. … In those same regions, a longer-term general warming pattern occurs below 2000 m. A very weak long-term cooling is seen over the bulk of the rest of the ocean below that depth, including the entirety of the Pacific and Indian Oceans, along with the eastern Atlantic basin.“
—–
The eastern tropical Pacific Ocean has cooled since 1979.
“[C]ooling trend in the eastern tropical Pacific sea surface temperature (SST) during 1979–2008”
—–
The North Atlantic Ocean has cooled by -0.45° C since 2005.
“Here we show that since 2005 a large volume of the upper North Atlantic Ocean has cooled significantly by approximately 0.45 °C or 1.5 × 10²² J, reversing the previous warming trend. … The observed upper ocean cooling since 2005 is not consistent with the hypothesis that anthropogenic aerosols directly drive Atlantic temperatures.”
—–
The Southern Ocean has been cooling overall since 1979 (by about -1.0°C), which has led to an increasing sea ice coverage not simulated by models.
“Cooling is evident over most of the Southern Ocean in all seasons and the annual mean, with magnitudes approximately 0.2–0.4°C per decade or 0.7–1.3°C over the 33 year period [1979-2011].”
“Through the sea ice-albedo feedback, models produce a high-latitude surface ocean warming and sea ice decline, contrasting the observed net [Southern Ocean] cooling and sea ice increase [1979-2013].”
Southeastern United States Cooling
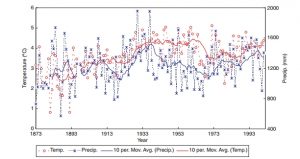
The southeastern United States has been cooling since 1895.
The 20th century cooling trend over the southeastern United States
“Portions of the southern and southeastern United States, primarily Mississippi, Alabama, and Georgia, have experienced century-long (1895–2007) downward air temperature trends that occur in all seasons.”
—–
In Kentucky, there has been no statistically significant warming or cooling trend since 1950.
Chattopadhyay and Edwards, 2016
“[B]roadly speaking, mean annual temperatures in Kentucky have not demonstrated a statistically significant trend with regard to time [during 1950-2010].”
—–
Alabama summer maximum temperatures cooled at a rate of -0.07° C per decade, or about -1° C overall, between 1883 and 2014.
“Three time series of average summer daily maximum temperature (TMax JJA) are developed for three interior regions of Alabama (AL) from stations with varying periods-of-record and unknown inhomogeneities. The time frame is 1883-2014. … Varying the parameters of the construction methodology creates 333 time series with a central trend-value based on the largest group of stations of -0.07 °C decade-1 with a best-guess estimate of measurement uncertainty being -0.12 to -0.02 °C decade-1.”
Northern Europe Cooling
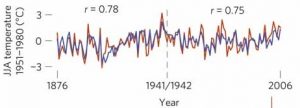
Temperatures in Scandinavia have been cooling overall for the last 2,000 years. The recent warming, which peaked in the early 1940s and cooled thereafter, has been well within the range of natural variability and has not offset the overall cooling trend.
“Orbital forcing of tree-ring data”
—–
Britain has cooled by -0.5° C since the early 2000s.
“Britain has experienced a drop in temperature of about 0.5°C since the early years of the millennium at a time when world temperatures have remained virtually stable”
—–
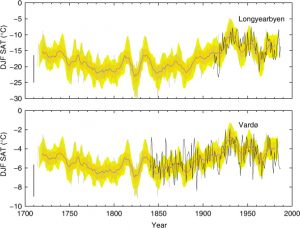
Northern Norway has been cooling since the 1940s peak.
“Thousand years of winter surface air temperature variations in Svalbard and northern Norway“
Antarctica Cooling
The Antarctic Peninsula has been cooling since the late 1990s at a statistically significant rate.
Absence of 21st century warming on Antarctic Peninsula consistent with natural variability
“Here we use a stacked temperature record to show an absence of regional [Antarctic Peninsula] warming since the late 1990s. The annual mean temperature has decreased at a statistically significant rate, with the most rapid cooling during the Austral summer.”
—–
East Antarctica hasn’t warmed in the last 200 years
“For East Antarctica, no general warming and increase in precipitation is found in surface observational data (Turner et al., 2005; Monaghan et al., 2006, 2008). … We conclude that, in the last 2 centuries, conditions in the interior DML [Dronning Maud Land, East Antarctica] have been fairly stable and only weakly influenced by changes in atmospheric dynamics.”
—–
The Ross Sea (Antarctica) has cooled at a rate of -1.59° C per decade since 1979, with no overall warming trend since 1882.
“Reconstructed mean annual temperatures show no significant change between 1882 and 2006 [for the Ross Sea, Antarctica]. However, a decrease in cold season [April–September (AMJJAS)] temperatures of −1.59° ± 0.84°C decade−1 (at 90% confidence) is observed since 1979.“
—–
The Antarctic continent as a whole has been cooling since the 1960s.
“[O]ur spatial analysis of Antarctic meteorological data demonstrates a net cooling on the Antarctic continent between 1966 and 2000, particularly during summer and autumn. The McMurdo Dry Valleys have cooled by 0.7 °C per decade between 1986 and 2000, with similar pronounced seasonal trends.”
“In this study, observed temperature records of 12 stations from Antarctica Island, Coastline and Continental areas are analyzed by means of detrended fluctuation analysis (DFA). … [W]e find .. most of the Antarctic stations do not show any significant trends over the past several decades”
—–
Western South America (Chile) Cooling
Chile has been cooling since the 1940s.
“Late Holocene summer temperatures in the central Andes…Chile”
China not warming
Temperatures in northwest China have not shown a warming trend in the last 368 years. It was warmer than now in the 1600s and 1700s.
Conclusion: “Overall, the RLST [mean maximum temperature] variability in the NWSP [northwestern Sichuan Plateau, China] might be associated with global land–sea atmospheric circulation (e.g., ENSO, PDO, or AMO) as well as solar and volcanic forcing.”
—–
Glaciers in northwestern China have been stable to slightly advancing in the 21st century.
“‘Pamir–Karakoram–Western-Kunlun-Mountain (northwestern Tibetan Plateau) Glacier Anomaly’ has been a topic of debate due to the balanced, or even slightly positive glacier mass budgets in the early 21st century.“
Recent mass balance measurements indicate a slight mass gain at Muztag Ata in the Eastern Pamir [China]. … [N]early balanced budgets for the last forty years. Indications of slightly positive trends after 1999 (+0.04 ± 0.27 m w.e. a−1 ) are confirmed by in-situ measurements.
Canada not warming
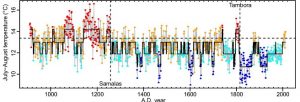
The Canadian Arctic (northeastern North America) was warmer than now in the early 1800s, and throughout the 1000 to 1200 AD period, with no significant warming trends outside the range of natural variability in the last 200 years.
“Volcano-induced regime shifts in millennial tree-ring chronologies from northeastern North America”
British Columbia (Canada) temperatures have been stable, with no warming trend, throughout 1900-2010.
“Tree-ring derived Little Ice Age temperature trends from the central British Columbia Coast Mountains, Canada”
South Africa not warming
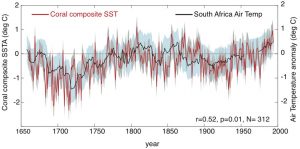
South Africa‘s surface air temperatures have been stable for the last 200 years, with as-warm or warmer temperatures in the 1800 to 1860 period. Temperatures warmed more rapidly (~1.5°C in 50 years) between 1720 and 1770 than they have at any time since.
“Madagascar corals track sea surface temperature variability … over the past 334 years”
Greenland cooled from 1940s to 1990s
Prior to the mid-1990s, Greenland had been cooling overall since the 1940s — a 50-year cooling trend despite a rapid increase in CO2 emissions during the 1940s to 1990s period. It was only after the mid-1990s that Greenland temperatures began rising in concert with CO2 concentration increases.
“Reconstructions indicate that Greenland temperatures did not begin to follow hemispheric greenhouse gas warming patterns until the mid-1990s. This discrepancy indicates either that the warming hiatus was associated with internal climate variability, or that the simulations are missing processes important to Greenland climate.”
“The Greenland coastal temperatures have followed the early 20th century global warming trend. Since 1940, however, the Greenland coastal stations data have undergone predominantly a cooling trend. At the summit of the Greenland ice sheet the summer average temperature has decreased at the rate of 2.2 °C per decade since the beginning of the measurements in 1987.”
“Analysis of new data for eight stations in coastal southern Greenland, 1958–2001, shows a significant cooling (trend-line change −1.29°C for the 44 years), as do sea-surface temperatures in the adjacent part of the Labrador Sea”
“The medieval warming (1000 A.D.) is 1 K warmer than the present temperature [in Greenland], and the LIA is seen to have two minimums at 1500 and 1850 A.D. The LIA is followed by a temperature rise culminating around 1930 A.D. Temperature cools between 1940 and 1995.“
As of 2007, the Greenland ice sheet still hadn’t warmed enough since the mid-1990s to exceed the warmth achieved during the 1920s and 1930s. Added to the 1940s to 1995 cooling, Greenland has experienced a 70-year-long cooling trend.
“Meteorological station records and regional climate model output are combined to develop a continuous 168-yr (1840–2007) spatial reconstruction of monthly, seasonal, and annual mean Greenland ice sheet near-surface air temperatures. The annual whole ice sheet 1919–32 warming trend is 33% greater in magnitude than the 1994–2007 warming.”
Iceland cooled between 1940 and the early 2000s
“An Analysis of the Icelandic Climate since the Nineteenth Century”
The Arctic cooled between the 1940s and 1990s
Absence of evidence for greenhouse warming over the Arctic Ocean in the past 40 years
“In particular, we do not observe the large surface warming trends predicted by models; indeed, we detect significant surface cooling trends over the western Arctic Ocean during winter and autumn. This discrepancy suggests that present climate models do not adequately incorporate the physical processes that affect the polar regions.”
Conclusion: “The lack of widespread significant warming trends leads us to conclude that there is no strong evidence to support model simulations of greenhouse warming over the Arctic Ocean for the period 1950-1990. Our results, combined with the inconsistent performance of model simulations of Arctic climate indicate a need to understand better the physical processes that affect polar regions, especially atmosphere-ice-ocean interactions, ocean heat transfer and cloud radiative effects”
—–
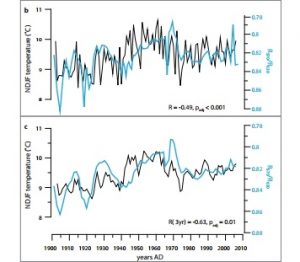
There have been no net temperature changes in the Arctic Atlantic since 1940 (graph A), with abrupt cooling between 1940 and 1995 (graph B, far right).
“Pairwise comparisons to reconstruct mean temperature in the Arctic Atlantic Region over the last 2,000 years”
—–
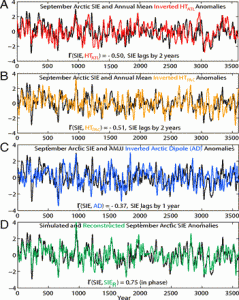
Arctic sea ice extent anomalies (September melt season) have been essentially stable for the last 3,600 years






I would expect the oceans to warm for several hundred years after the end of the Little Ice Age. It takes about 800 years for the oceans to go through one “ventilation cycle”. Seeing some ocean surface warming of a fraction of a degree in the 20th century should not be surprising.
[…] Abundant scientific evidence that ‚global warming‘ is a made-up concept […]
You have no need to measure the temperature everywhere, if there were overall general warming over the globe, it would show up in the rate of sea level rise.
But I have checked hundreds of tide gauge stations and every single one of them is linear all the way back to 1848.
Hence there is no warming.
“It was only after the mid-1990s that Greenland temperatures began rising in concert with CO2 concentration increases.”
In concert with the decline in solar wind strength, which caused negative North Atlantic Oscillation to increase. Rising Co2 should increase positive NAO, that won’t drive a warm AMO and Arctic.
Interesting and for a non-academic mind, appears to deny or at least clarify where and what is warming.
So why are glaciers in areas like Alberta and British Columbia, and Nepal retreating? And why is the sea ice in Hudson’s Bay changing / moving?
Thanks
Glaciers have generally been retreating on average since the last glaciation. They retreat and advance in cycles, but on average have been retreating. You should only be scared if they begin to advance more often than not. Then we will be in real trouble.
Once upon a time, about 18,000 year ago, the world was really really cold. Then it began warming and the glaciers began melting.
http://www.geocraft.com/WVFossils/PageMill_Images/anim_glac.gif
The world is now nowhere near the warmest it has gotten in the past, so as it warms and cools, glaciers shrink and advance. Let’s just hope they don’t start growing again permanently, because that would be really really bad, especially for Canada.
http://www.agatelady.com/images/gem-of-the-month/june-2012/glacier-big.jpg
I will add these to my list of NOT WARMING. ! 🙂
1. No warming in the UAH satellite record from 1980 to 1998 El Nino
2. No warming between the end of that El Nino in 2001 and the start of the current El Nino at the beginning of 2015.
3. No warming in the southern polar region for the whole 38 years of the satellite record.
4. No warming in the southern ex-tropicals for 20 years.
5. No warming in Australia for 20 years, cooling since 2002
6. No warming in Japan surface data for the last 20
years, No warming from 1950-1990.. zero trend for 40 years
7. No warming in the USA since 2005 when a non-corrupted system was installed, until the beginning of the current El Nino.
8. UAH Global Land shows no warming from 1979 1997, the no warming from 2001 – 2015
9. Iceland essentially the same temperature as in the late 1930s as now, maybe slightly lower
10. Southern Sea temperatures not warming from 1982 2005, then cooling
11. Even UAH NoPol shows no warming this century until the large spike in January 2016.
I’ve said it many times.
The only REAL warming in the last 40 or so year has been regional warming associated with NON-CO2 forced El Nino events, and from natural ocean oscillations.
Very little from the data manipulators in NOAA, GISS, BEST, HadCru etc can be taken as having ANY BASIS IN REALITY.
I do not know how to react to these articles. They are a collection of parts of articles, that agree with your position.
That is called selection bias. The results are clear before you start collecting the articles and soundbites
you are in total contradiction to basically everyone with some knowledge of the fields that you are discussing. That is, because those people do not only look at the few sources that support this position but also include the millions that do not.
You mean they look at the sources that either support their hypothesis or those that can be “adjusted” to make them support their hypothesis and ignore those that don’t.
The point of this article is that, regardless of the hype, “the globe” is not warming; parts if it are. And as Richard implies, if they can deny the MWP on the grounds that it was regional, then we can deny the current warm period on the same grounds.
There are numerous sayings that apply, from not having your cake and eating it what is sauce for the goose, etc.!
You really must try to be more consistent or make yourself look an idiot.
Selection bias has to do with selecting data that support one’s theory. Papers are not “data.” There are good papers and there are bad (in this case, LOTS of bad), and weeding out the crap is NOT a “bias,” except for someone who wants to deceive.
E.g., tossing out Michael Mann’s hockey stick graph is perfectly valid, because it is garbage, because …HE WAS BIASED IN HIS SELECTION OF THE DATA.
“you are in total contradiction to basically everyone with some knowledge of the fields that you are discussing.” – sod
That’s just a regurgitation of the disproven 97% of scientists lie.
https://notalotofpeopleknowthat.wordpress.com/category/97-scam/
https://www.youtube.com/watch?v=SSrjAXK5pGw
“I do not know how to react to these articles.” – sod
your boilerplate negative responses based on bad science put the lie to that claim.
sod~ according to your side the whole world is warming up. Therefore cold records should be becoming increasingly rare. Heavy snows ought to be slowly being replaced by rain, or no precip at all in some regions. Ice should not be expanding at the south pole. ‘Amplification’ should be pushing temperatures Up at BOTH poles, and this is not happening.
Yet that’s what your side claims SHOULD be happening.
So, explain to us why the above articles even exist if the world works the way you believe it does?
And NO- not for one moment would I believe that ‘man-made’ warming would cause colder temperatures.
sod quote: “I do not know how to react to these articles.”
It is simple.
Forget the waffle above.
Choose one link, and then supply a 97% science link disproving it.
Good luck with that.
I was not able to download from the link provided but used this one instead
http://flux.ocean.washington.edu/riser_web/nclimate.argo.review.pdf
[…] Now before I run away and resume avoiding talking about climate change again here’s a link that asks the very pertinent question of what dow we mean by “global warming” and does it even make sense as a concept? Abundant Scientific Evidence That ‘Global Warming’ Is A Made-Up Concept […]