Schneefan at wobleibtdieerderwaermung.de here analyzes Arctic sea ice to date…
(Translated, edited by P Gosselin)
====================================
Arctic: Sea ice melt 2016 done at 4.1 million km²? Northwest Passage freezes over!
At approx. 4.1 million square kilometres extent, it appears that the summertime Arctic sea ice melt has ended early, on 7 September 2016.
Here the sea ice area is 743,000 km² greater than the low set on 16 September 2012.
On average sea ice begins to grow again in mid September.
The NSIDC table shows the preliminary low point on 7 September 2016, at 4.083 million km²,. On September 8 the ice area grew by 21,000 sq. km. to 4.104 million km²:
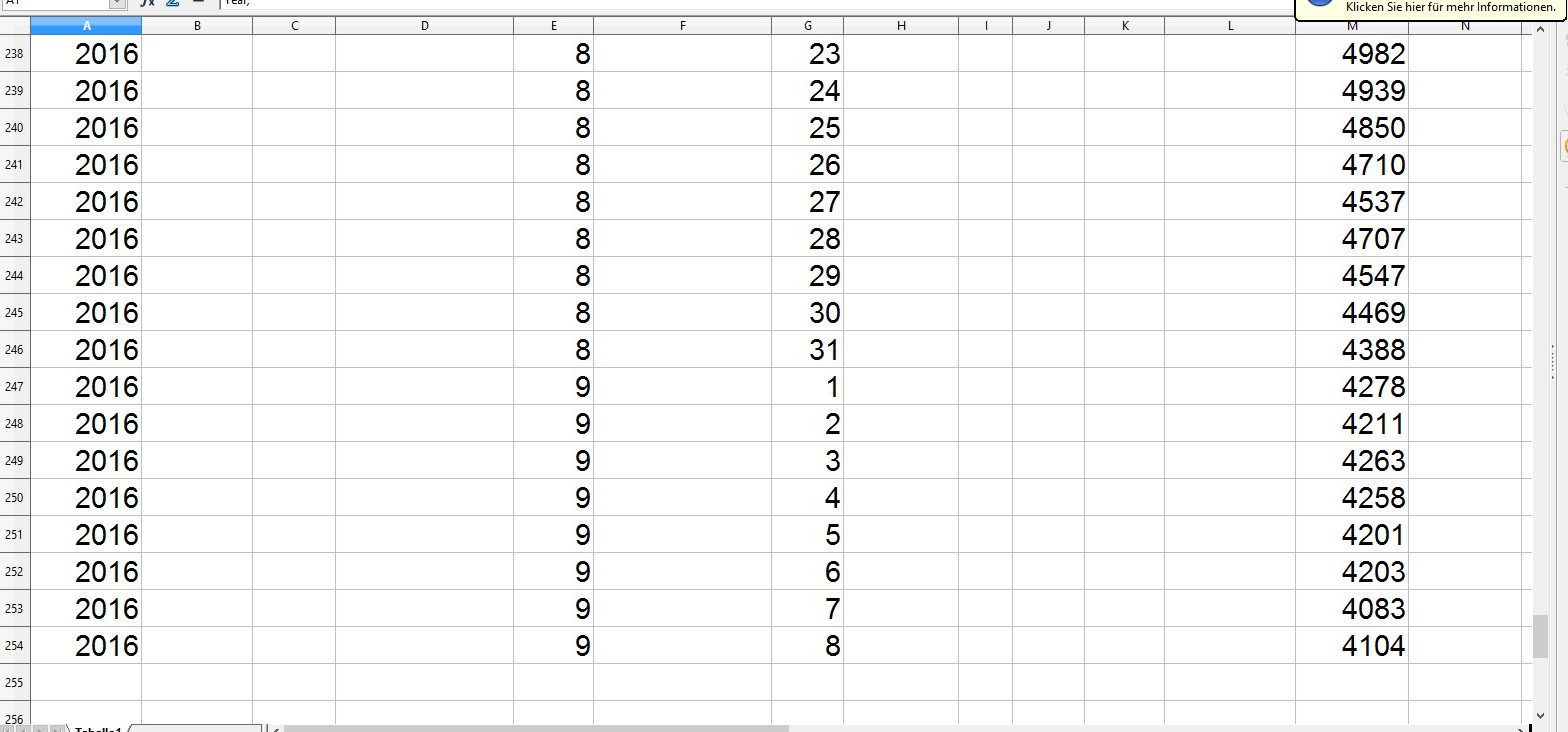
Table for Arctic sea ice extent with 15% ice concentration from the National Snow and Ice Data Center (NSIDC) from September 9, 2016. Source: NH_seaice_extent_nrt_v2.csv.
Also NORSEX shows Arctic sea ice (min. 15% concentration) possibly having turned the corner from the September 7 low point:

Source: arctic-roos.org/observations/in-arctic.
Whether there will be more melting, depends on the wind conditions over the next few days.
But one thing is clear: The northern part of the Northwest Passage was blocked by multi-year ice – foremost the western exit – for the entire summer of 2016, and was even not passable by ice breakers.
The southern part – Amundsen’s Route – was neither ice free in August 2016…
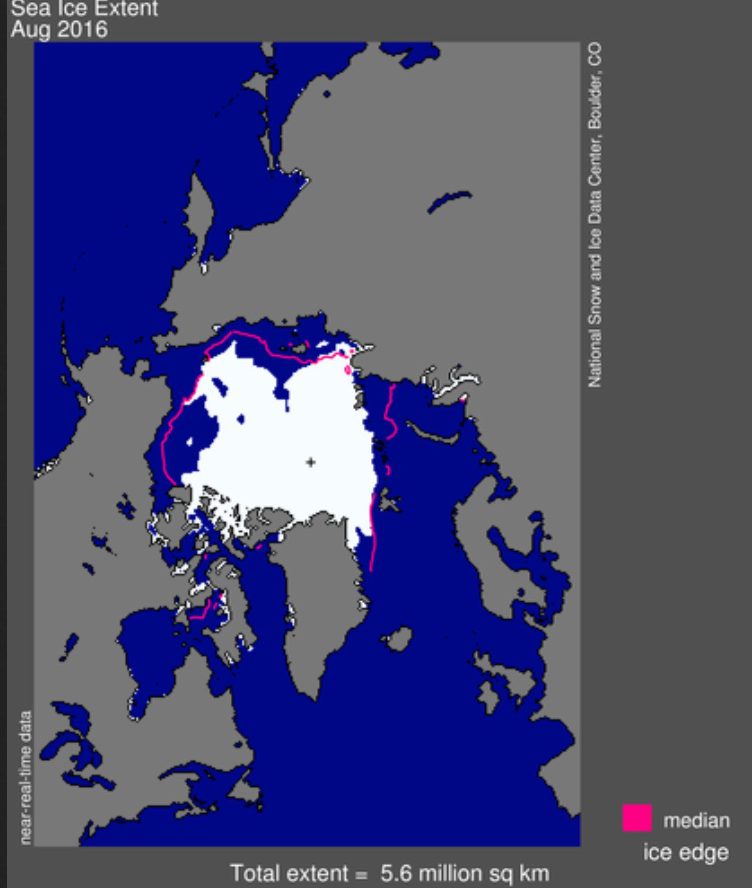
NSIDC sea ice chart (extent) for August 2016 shows sea ice blockage of the western part of northern route through the Northwest Passage. The southern Amundsen’s Route shows partial ice blockage and thus could be traversed only with the help of ice breakers. Source: nsidc.org/data/seaice_index/
….nor after the start of September 2016:
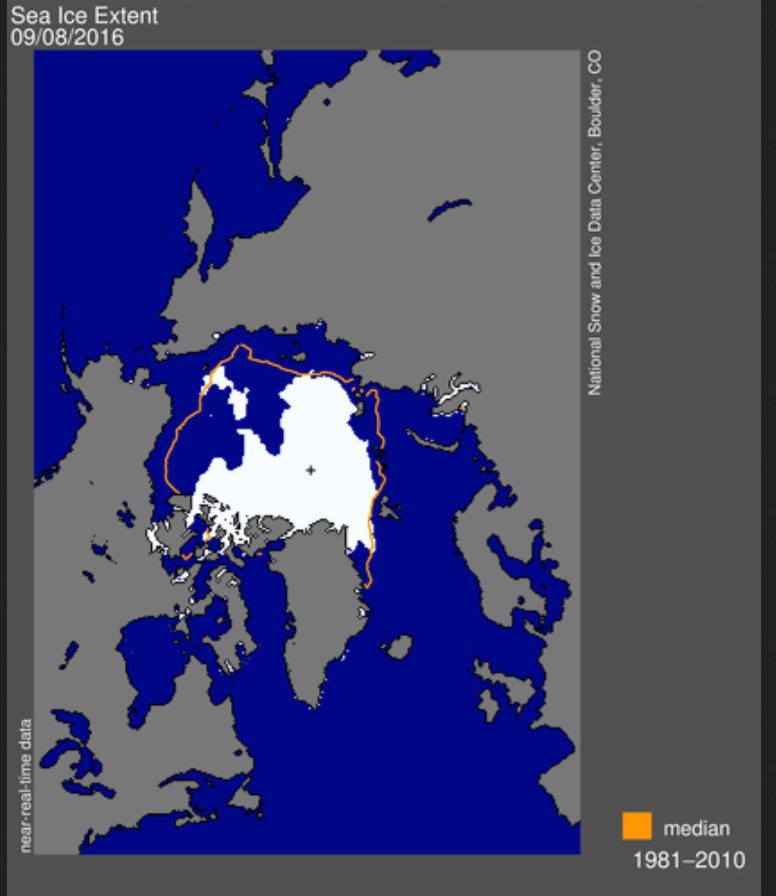
NSIDC sea ice chart, September 8, shows a strong ice blocking of the northern route of the Northwest Passage, western exit. The southern Amundsen Route shows closed ice fields. Source: nsidc.org/data/seaice_index/.
When comparing both NSIDC charts, we see a growth in sea ice in early September 2016 along the southern Amundsen Route compared to August 2016.
250 billion tonnes more ice
The Arctic polar winter 2016 has started early this year, as it did a year ago. Greenland ice from to 1 September 2015 to 31 August 2016 grew by 30 billion cubic meters (30 km³). Since the 2011/2012 season it has grown by 250 billion tonnes (250 km³) in mass. [That’s the same as 250,000 sq. km of 1 meter thick sea ice.]
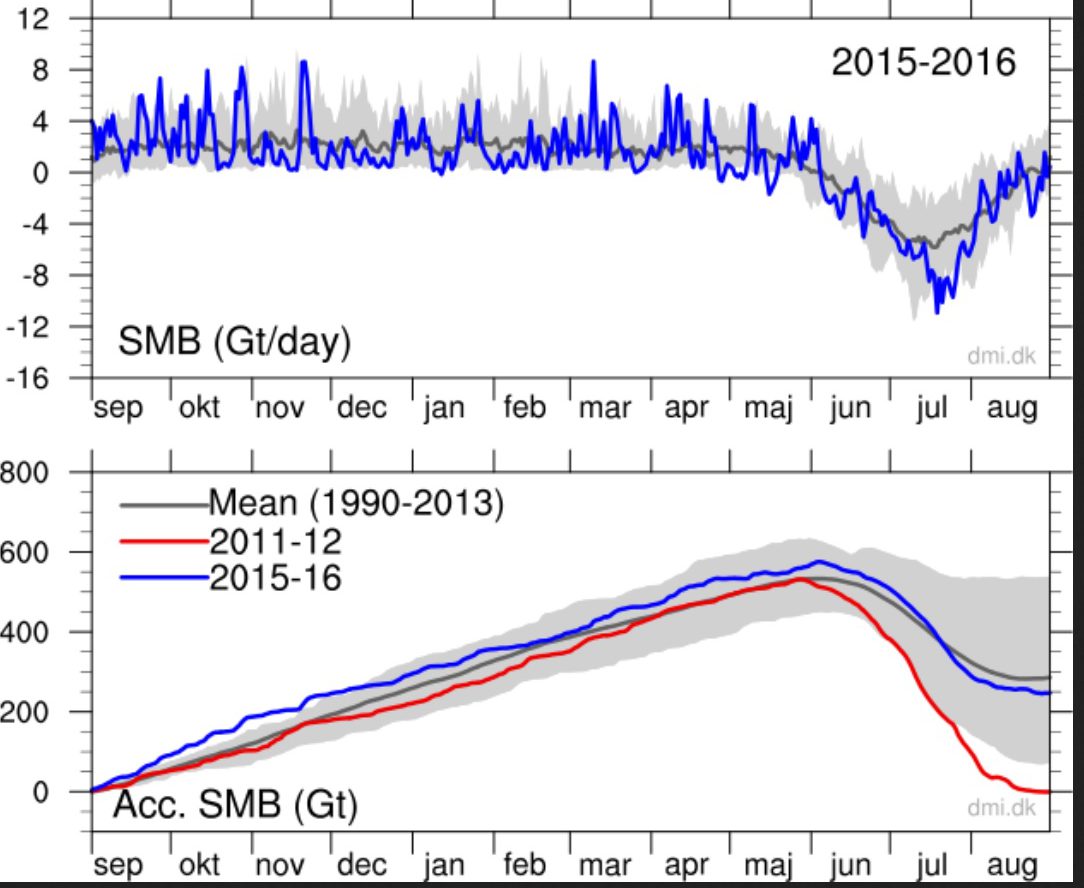
Top: The total daily contribution to the surface mass balance from the entire ice sheet (blue line, Gt/day). Bottom: The accumulated surface mass balance from September 1st to now (blue line, Gt) and the season 2011-12 (red) which had very high summer melt in Greenland. For comparison, the mean curve from the period 1990-2013 is shown (dark grey). The same calendar day in each of the 24 years (in the period 1990-2013) will have its own value. These differences from year to year are illustrated by the light grey band. For each calendar day, however, the lowest and highest values of the 24 years have been left out.” Source: dmi.dk/en/groenland/maalinger/greenland“.
Astonishingly there are some people who wish to navigate the Arctic in sailing vessels because some climate prophets, like Al Gore and Peter Wadhams, claimed that Arctic sea ice would be practically gone in the polar summer of 2016. Read more here on climate scientists who called such claims pure nonsense.
Many people of course can appreciate the sailing skills of the Northabout crew, but no one should risk their lives to prop up the climate fairy tale of man-made global warming with an ice-free summertime Arctic: A Race Against Time.
The next coming days will tell us whether or not Arctic sea ice has reached the minimum for the summer earlier than normal, or if it will shrink some more.
Greetings
Schneefan2015


Those are Sea Ice Index numbers from NOAA which show less extent than MASIE, higher resolution and accuracy than SII.
https://rclutz.wordpress.com/2016/09/06/arctic-ice-surprises/
Sent this to serial alarmist and failed “ice-free Arctic” climate “scientist”.
Peter Wadhams- see;
https://wattsupwiththat.com/2016/07/22/professor-peter-wadhams-will-not-bet-on-his-own-sea-ice-predictions/
Dear Professor Wadhams.
Another of your annual predictions fails. Miserably.
What was it you said- 1 million km2?
Well it looks like it has bottomed out at 4 million km2. You are only out by a factor of 4.
ftp://sidads.colorado.edu/DATASETS/NOAA/G02135/north/daily/data/NH_seaice_extent_nrt_v2.csv
I’m still on for a £1,000 bet next year on sea-ice not going below 1 million km2. Hey, what the heck- let’s make it £2000.
In other words “put up or shut up”.
Regards and best,
Dr D Keiller.
“In other words “put up or shut up”.” — D. Keiller
Sadly, they never do either.
Arguing with outlier predictions is a waste of time. By late June, many experts who follow the changes in the Arctic believed the 2012 record would not be broken this year because not much happened in June, and conducive activity in June is essential for breaking records. I’m not an expert on that topic but it was clear from the arguments made that they were probably right.
I follow the sea ice extent measurements and indeed it is highly likely that 2016 will not break the 2012 record, but it has already reached lower than 2007 and thus has overtaken the number two spot. But it’s an illusion to think this means anything. In August, the ice in the Arctic was hammered and shattered by two large storms.
The maps above that show a solid white area is an illusion because of the way ice has been measured for over 35 years. The maps made sense even as recently as 6 or 7 years ago. But they were made for an Arctic that no longer exists. Yes, the sea water will continue to freeze from September to early February because of the lack of sun, but we’re in a different world now, and it is time to deal with the reality of what global warming is doing to the Arctic as well as other areas of the Earth.
“…but we’re in a different world now, and it is time to deal with the reality of what global warming is doing to the Arctic as well as other areas of the Earth.” – Ray
The only one living in a “different world” is you and your soddy fellow travelers.
While toxic AGW deniers crow about one year predictions, present Arctic sea ice VOLUME is 11,000+ KM3 short of the Arctic sea ice VOLUME of the 1980’s. The energy to melt such a vast block of ice is 35 TIMES THE YEARLY ENERGY CONSUMPTION OF THE U.S.
For 10 years toxic AGW deniers have depended on the solar TSI being well below average (including a 3+ year low period breaking a 100 year record). Toxic AGW deniers have stated Earth is cooling, which it ain’t. But Earth has not returned to early 20th century low temperatures. For 380 straight months Earth temperatures have been over the 20th century average. The first decade of the 21st century has been the hottest recorded decade, also including the 20th & 19th century recorded temperatures. The last five years have been the hottest 5 year recorded period, including the 21st, 20th, & 19th centuries. 2014 & 2015 has been the hottest recorded successive years, including the 21st, 20th, & 19th centuries. 2016 is thought to continue the trend. All this while solar TSI is low. Science says is only a blip low, but toxic AGW deniers depend on many decades of of sub-standard TSI. But, for billions of years, the sun has continued to warm & will continue to warm, despite a blip low period.
Further data:
In the last 2.5 years, the High Arctic had 140 & 160 straight days above average temperatures. One hundred straight days of the 160 were no less than 3degC over average with the average of the 100 days being 5 to 7degC over the long term average. Also, the thrusting AGW energy shoved Arctic cold down onto populated regions of Canada & the U.S., so toxic AGW denier liar whiners could squawk about the cold.
Between 1979 & 2000, only one year had ANY Arctic sea ice days, as low as the same date sea ice of ALL of the year 2015 AND to date 2016. And those DAYS were only two or three straight of that year.
Indeed, not even Arctic weather sea ice days, which can be high or low, can bridge the clean break between the Arctic of the old 1980’s decade & the Arctic of the new AGW dominated years.
Now go and live in Siberia, and enjoy the benefits of the Little Ice Age, fool !
And then go and learn at least the very basics about cycles such as the AMO.
Or remain an IGNORANT scammer for the rest of your tedious life.
Its going to hilarious watch you guys over the next few years as Arctic sea ice starts to climb again.
Are there enough cockroach crevasses for you crawl into, I wonder. 🙂
You do know that since the AMO levelled off there has been a ZERO TREND is Arctic sea ice, don’t you ???
Or are your comments based on your ignorance, like all Arctic ranters.!
https://s19.postimg.io/425r9zipf/Arctic_ice_area_trend.png
“Also, the thrusting AGW energy shoved Arctic cold down onto populated regions”
Thanks, I started to wonder why it’s so cold here.
Are you really that ignorant?
more alarmist crap. no one knows what the volume of arctic sea ice actually is. some people attempt to model it ,but they have no idea how accurate they are either. it is educated guess work,with very little actual data to back up the assertions made by alarmists.
the fact several groups are attempting to model volume and they all have different results should have been a clue.
It is the second lowest extend on record.
https://ads.nipr.ac.jp/vishop/graph/Sea_Ice_Extent_N_prev_v2.png
That is the most important piece of information, but somehow it is not named, when “sceptics” discuss arctic sea ice.
And talking about the northwest passage, the most important piece of information is a cruise ship making the trip for the very first time.
http://www.foxbusiness.com/markets/2016/09/09/giant-cruise-ship-makes-historic-voyage-in-melting-arctic.html
and the trend in shipping is also pretty clear:
http://www.enr.gov.nt.ca/state-environment/73-trends-shipping-northwest-passage-and-beaufort-sea
“on record”
roflmao.. and what a piddlingly short record on the upward cycle of the AMO it is.
Thing is , sop, that biodata clearly illustrates that before the LIA (coldest period in 10,000 year) the Arctic was often ICE FREE in the summer months.
But do keep up the childish ignorance about real Arctic sea ice history. Its good for a laugh like all your other childish antics. 🙂
When the record doesn’t further the narrative, ditch the record.
https://i1.wp.com/realclimatescience.com/wp-content/uploads/2016/01/2016-01-03-09-53-08-1.png
Reykjavik temperatures match the AMO quite well, and again we see that 1979 was by far the COLDEST year in the Arctic since the peak in 1940 (which was warmer than now)
https://s19.postimg.org/yavxs1i7n/amoreyk.jpg
Oh, nice. Completely consistent with the deleted history prior to 1979. Thanks. Do you have the original source? I thought I found it, but the image seems to have been “not found or removed.”
What do you mean “original source”.
I am the source of the combined Reykjavik/AMO graph. 🙂
It was housed elsewhere, but disappeared.
Why not link to your YUGE chart pr0n session, Andy…
http://realclimatescience.com/2016/06/nasa-climate-scamming-is-happening-everywhere/
That’s one of the many good things about realscience’s blog, it holds the image even if the place it is stored disappears. 🙂
@AndyG55
OK, I suspected that as a possibility. Nice work!
Keep up the good work but do not fret about trolls.
the trend in arctic ice breaking ships is also clear.
Update on MASIE ice extents: Could be the annual minimum happened on Sept. 10, which would match 2009 as the earliest in the last 10 years.
https://rclutz.wordpress.com/2016/09/12/arctic-ice-minimum/
[…] kuvista 1 ja 2 voi havaita. Saattaapa olla, että merijäät ovat jo lähteneet kasvuun, kuten NoTrickZone jo muutama päivä sitten ounasteli (Linkki). Kuvassa 2 näyttäisi NOAA:n aineistossa olleen […]