The Sun in September 2016
By Frank Bosse and Prof. Fritz Vahrenholt
(Translated and edited by P Gosselin)
Also last month the sun was relatively inactive. The observed sunspot number (SSN) was 44.7, which was just 64% of what is the average for the previously observed 23 cycles.
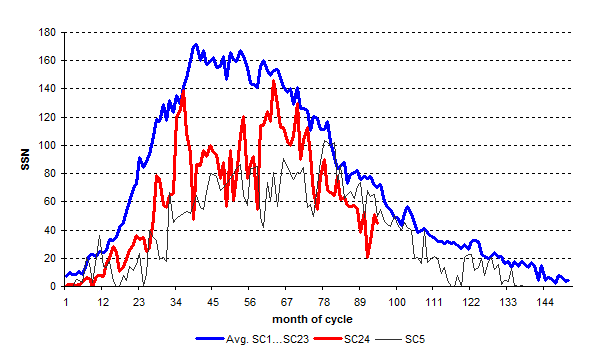
The average cycle has a duration of 11 years. The current cycle number 24 is depicted by the red curve in the following chart:
Figure 1: The current solar cycle 24 is shown in red. The mean of the previous 23 cycles is shown by the blue curve. The black curve depicts solar cycle 5, which had a similar behavior as the current cycle 25.
What stands out is that the last 18 months of activity of the current cycle has been consistently weaker than during the same period of solar cycle 5, which ushered in the Dalton-Minimum in 1795.
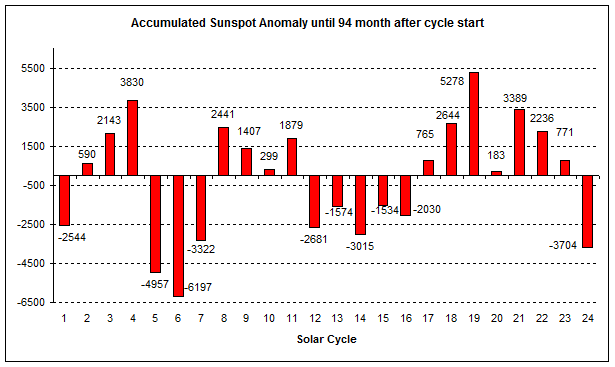
So what can we say about the upcoming solar cycle 25, which is expected to begin around 2020? Next month we will take another look at the solar polar field because its strength is a leading indicator for what the sun has in store for us. Up to now everything looks like the situation we saw in the early 19th century.The comparison of the individual cycles with respect to their sunspot deviation from the mean after 94 months into the cycle follows:

Figure 2: The accumulated monthly sunspot totals for each cycle and their respective deviation from the mean (blue curve in Figure 1), 94 months into the cycle. Only 2 cycles were less active than the current cycle: cycles no. 5 and 6 – some 200 years ago! The second half of the 20th century was the most active phase with respect to amplitude and duration.
Beginning with solar cycle 18 in the year 1944 until the mid 1990s (SC22) there were 4 strong cycles. The peak was SC 19, which ended in 1964. SC 21 was the third strongest cycle and 1986. The strong cycles ceased in 2005, and one is not expected with strong certainty until 2033.
===================================
Note from NTZ: Yesterday Kenneth Richard posted on 18 very recent papers showing a strong correlation between solar activity and global temperature over the past centuries. Many accept that periods of low solar activity lead to periods of global cool-offs. But some experts caution that the effects from the series of the powerful solar cycles of the late 20th century will not be offset by the single weak cycle we are currently experiencing.


Of course the sun controls our climate and observing, measuring and analysing the real data is very, very important.
All other climate parameters are just minor players in the outcome.
What is going on with these high solar wind
values? It is as if the sun is purging all
its excess energy. These are exciting times
we’re in.
Not that I’m anxious to see any type of cooling coming, considering I live in Florida, but it would be nice to see the end of all the climate alarmist propaganda that constantly floods the media.
I’d rather see the end of the media.
These are fighting words to the warmists. Any variable that affects climate other than C02, even solar variables, are ignored or explained away.
This demonstrates the danger of mixing dogmatism with science. Climatology is a very complex field and has no room for fanatics that attack any hypothesis that threatens their trillion dollar carbon trading floor and simple predictive models based on carbon content.
Even a child would know intuitively that studying climate and temperature must begin with the sun, not with the C02 molecule to the exclusion of all else.
“These are fighting words to the warmists. Any variable that affects climate other than C02, even solar variables, are ignored or explained away.
too funny.
As an example, The GCMs all current consider:
1. Changes in Solar Forcing ( both sunspot related changes and orbital changes)
2. Changes in dust, aersols, ect
3. Changes due to volcanic activity
4. Changes in Land Use
5. Changes in black carbon
6. Changes in HFCs
7. Changes in methane and other GHGs
and yes
8. Changes in c02
Look at any input file for any GCM.. its not just C02
In fact the science SHOWS that its not just C02
So why the focus on C02
1. It’s the largest contributor
2. Once in the atmopshere it last a long time
3. We have choices about how much to emit
“So why the focus on C02
1. It’s the largest contributor”
BULLTISH !!
A bit player at most !!
That’s why the models are so embarrassingly overwarm.
And yes, China, India, and many other developing countries will be ramping up their CO2 emissions substantially over the next many years..
And there is NOTHING you or your fellow anti-CO2 scammers can do about it.
“Changes in Solar Forcing ( both sunspot related changes and orbital changes)”
As if they are the only solar variable.. DOH !!
Gunna look like fools when the temperature drops, aren’t they.
Don’t worry Mosh, at least you have a fall-back as a used car salesman.
Mosher, for years now you pretend to never have heard of Svensmark. Do you know how manipulative that makes you look? I mean Svensmark might be right or he might be wrong but it looks like the perfect explanation for the climate cycles, LIA, MWP etc. So why do you manipulative Lukewarmers pretend he doesn’t exist. It reeks of corruption.
Mosher, you failed to mention that the variables’ strength/influence can be adjusted to show warming or cooling. The same goes for temperature records, which you said yourself use “Different data sources. Different methods.”, in order to show the past was cooler, so that the present can look warmer: http://realclimatescience.com/wp-content/uploads/2016/10/Screen-Shot-2016-10-23-at-3.40.55-PM.png