Three years ago, when the Rosenthal et al. (2013) paper was made available online from the journal Science, there was a bit of a stir among the purveyors of the humans-control-climate-with-their-CO2-emissions paradigm. Climate activist Michael Mann, for example, was ostensibly quite unhappy that a Medieval Warm Period (with +0.65°C warmer-than-now intermediate [0-700 m] ocean temperatures) was prominently identified in the paper’s abstract, and that both the Medieval Warm Period and Little Ice Age were characterized as “global events” in the summary. These conclusions served to undermine his own tree-ring hockey-stick reconstructions that effectively made the inconvenient Medieval Warm Period disappear. None of the graphs from the paper depicted anything resembling a “hockey stick” for recent decades, which is probably why Mann claimed the paper was “suspect” and contained “a number of inconsistencies” and “debatable assumptions and interpretations”.
Indeed, the Rosenthal et al. (2013) ocean heat and temperature reconstruction depicted the last few centuries as still among the coldest of the last 10,000 years, with 21st century temperatures (2000-2010) slightly (just ~0.3°C) above the coldest years of the Holocene (the Little Ice Age), and a full 2.0°C colder than during the Early and Middle Holocene (10,000 to 6,000 years ago), when CO2 concentrations were in the 260 ppm range, or 140 ppm lower than today.
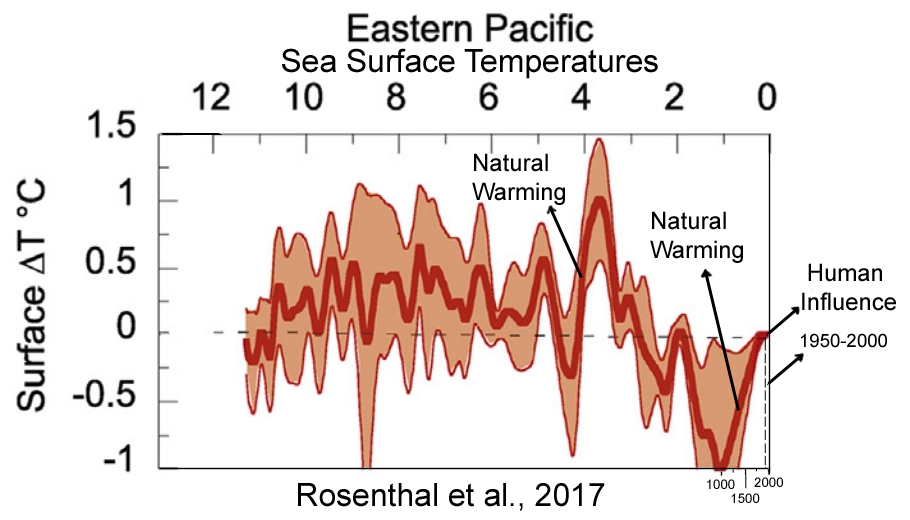
Below is an encapsulating graph from the 2013 paper with annotations. Notice that the amplitude and rapidity of the natural (pre-1950) warming and cooling phases sometimes exceed + or – 1°C per century, and how the post-1950 anthropogenic (presumed) warming is effectively undetectable and/or indistinguishable from natural variability.

Not inclined to disappoint those advocating for the anthropogenic climate change paradigm, the Rosenthal et al. scientists obligingly granted one single appeasing sentence, offering that the“modern rate of Pacific OHC change is, however, the highest in the past 10,000 years.” Got that? The increase in ocean temperatures in recent decades (reported by the IPCC to only be “about 0.015°C per decade” for the 0-700 m layer between 1971-2010) is claimed to be much faster than any other period during the Holocene.
“It is virtually certain that the upper ocean (0 to 700 m) warmed from 1971 to 2010. … The warming rate is 0.11°C per decade in the upper 75 m, decreasing to about 0.015°C per decade by 700 m.” (IPCC AR5 WG1 Chapter 3, page 263)
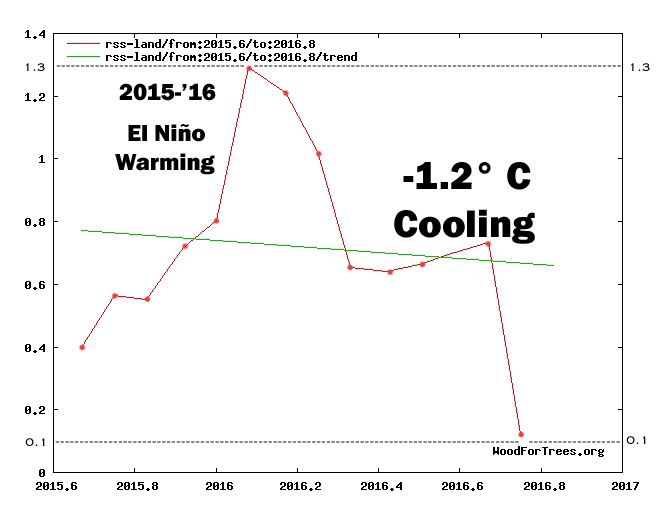
So how did Rosenthal et al. leap to their conclusion? By oddly deciding that it is scientifically defensible to directly compare an 8,000-year-long trend to a 55-year trend (1955-2010) — which, statistically, is much like comparing an 8-month-long El Niño-dominated temperature anomaly to a 37-year-long temperature trend. In other words, Rosenthal and co-authors were able to claim an unprecedented modern warming rate by cherry-picking an extremely short-term period (1950s-present) and by simultaneously ignoring all the other short term (<100 years) trends (from their own reconstructions) that greatly exceeded modern temperature changes in both rapidity and magnitude (as the graph above illustrates).
Interestingly, Bova et al. (2016) recently found that during the Holocene there were short-term “natural” ocean warming trends that achieved amplitudes of more than “2.0°C within 200 years” at the 0-1000 m depth, which is about 5 to 10 times the rate of warming (more than 0.1°C per decade) compared to the 0.015°C per decade warming rate in recent decades (1971-2010) at the shallower 0-700 m depth.
Rosenthal and colleagues were nonetheless able to get away with claiming that modern ocean temperature changes are among the fastest of the Holocene in their 2013 paper, which is likely what allowed the paper to be published in Science. And thus a seemingly throwaway sentence necessarily became the “take-home conclusion” for Michael Mann and his ilk.
A New Rosenthal (2017) Paper
A new Rosenthal et al. (2017) paper has many similar features to the 2013 version with some important differences.
Seemingly in response to those who claimed their last paper didn’t represent the global oceans well enough, the authors added Atlantic Ocean proxy records to their last Pacific Ocean reconstruction that extended from the North Pacific to Antarctic. Again they concluded that their coverage represents global ocean temperatures:
“[W]e assume that our records represent the World Ocean and thus are comparable in volume with the current estimates (Levitus et al., 2012).”
Perhaps because of the lone positive coverage from Mann and other activists that it afforded them the last time they mentioned it, Rosenthal and co-authors once again claim in this paper that their cherry-picked short-term (55 years) warming rate (now 0.033°C per decade [0-700 m] for 1955-2010 instead of 0.015°C per decade for 1971-2010 as indicated by the IPCC) greatly exceeds the overall 8,000-year trend (from 10,000 years ago to 2,000 years ago) of “0.002°C per decade”. They also compare the same 55-year trend to a 400-year trend (1200 to 1600 A.D.) Just as directly comparing a -1.2°C temperature drop over an 8 month period to the overall 3+ decade satellite temperature trend would be an abominable misrepresentation, comparing a 55-year trend to a 400-year trend or an 8,000-year trend is, to put it bluntly, statistical malpractice.
“Levitus et al. (2012) report a mean ocean warming of the 0-700 m ocean layer of 0.18°C between 1955 and 2010, corresponding to ~0.033°C per decade. To obtain a first order comparison, we assume that our records represent the World Ocean and thus are comparable in volume with the current estimates (Levitus et al., 2012). Assuming the intermediate depth ocean (0-700 m) cooled between 10 and 2 Ka by ~1.5 °C we calculate a cooling rate 0.002°C per decade. Similarly, considering the intermediate depth ocean (0-700 m) cooled by ~0.5 °C between 1200 and 1600 CE we calculate a temperature change of -0.013 °C per decade. In both cases these rates are smaller than the modern rates even when applying the observed IWT changes to the whole ocean (as opposed to just the Pacific as was done in Rosenthal et al. (2013).”
‘Global’ Sea Surface Temperature Reconstructions
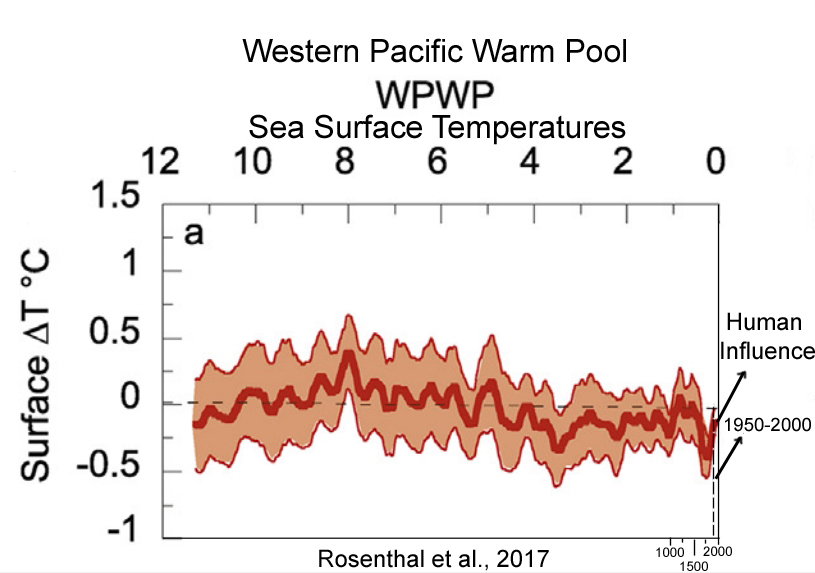
Let’s consider the sea surface temperature reconstructions. Notice the annotations indicating when humans presumably began influencing temperatures (after 1950) with their CO2 emissions. As shown, all or nearly all the warming in the last few centuries took place prior to the era of presumed anthropogenic influence. Instead of CO2 emissions, some other forcing mechanism needed to have caused the large magnitude and rapidity of ocean temperature changes.

Holocene Ocean Heat Reconstructions
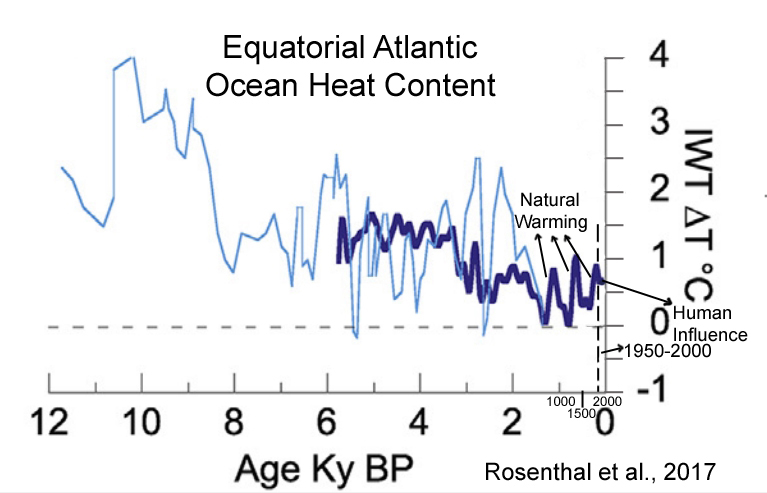
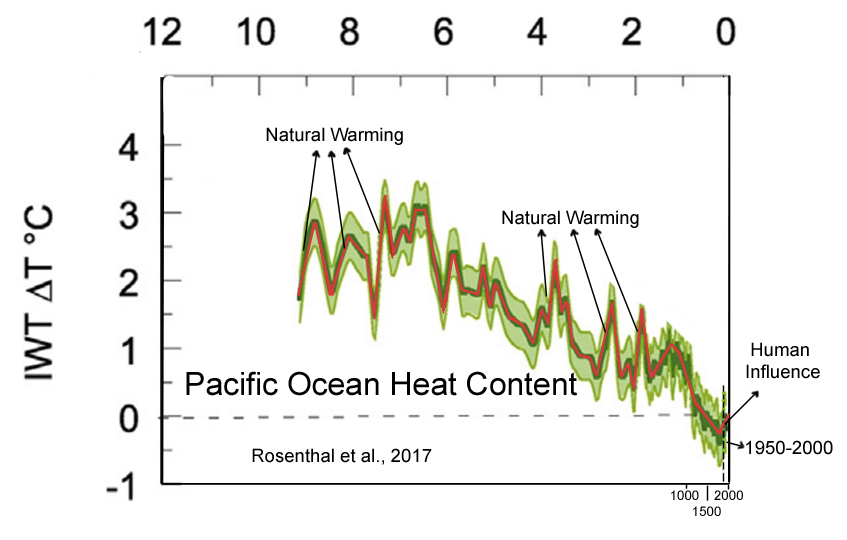
The new (or reconditioned) graphs of ocean heat content ( 0-700 m) are no better, and perhaps worse, than the sea surface temperature reconstructions when it comes to depicting the negligibility of the anthropogenic influence.


The Alleged Anthropogenic Influence Effectively Begins Only After 1950
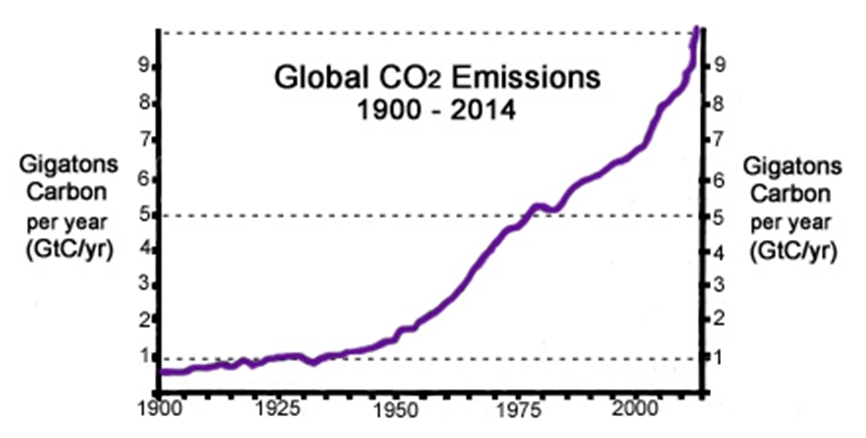
The reason why we only include the post-1950 period as the era of the presumed anthropogenic influence on ocean temperatures is simple: anthropogenic CO2 emissions were effectively flat and negligible prior to 1950 … after which they exploded.
In fact, the IPCC claims that the net radiative forcing from all combined anthropogenic sources was “more than 1.5 W m-2” between 1951-2011.
“Over the period 1951–2011 the trend in anthropogenic forcing is almost 0.3 W m–2 per decade and thus anthropogenic forcing over this period is more than 1.5 W m–2.” IPCC AR5 Chapter 8, page 699
As Rosenthal et al. (2017) note, the total net radiative forcing from all anthropogenic influences since 1750 has been 1.6 W m-2, which leaves almost no room for humans to have had more than a modest (~0.1 W m-2) impact on climate prior to 1950.
“It is generally assumed that the effects of direct forcing through the last millennium were relatively uniform in both hemispheres, much like the effects of the recent increase in GHG though with substantially smaller impact compared with the estimated total anthropogenic radiative forcing of 1.6 ± 0.8 W/m2.”
So if nearly all the radiative influence on ocean temperatures from human activity took place after 1950, and if nearly all the abrupt and far more pronounced ocean temperature changes (warmings and coolings) took place prior to 1950, this would imply that there are other factors driving warming and cooling trends besides anthropogenic forcing (CO2). Rosenthal et al. seem to reluctantly admit in the paper that the models of radiative forcing don’t seem fully capable of explaining the Holocene’s rapid temperature changes.
“Here we review proxy records of intermediate water temperatures from sediment cores and corals in the equatorial Pacific and northeastern Atlantic Oceans, spanning 10,000 years beyond the instrumental record. These records suggests that intermediate waters [0-700 m] were 1.5-2°C warmer during the Holocene Thermal Maximum than in the last century. Intermediate water masses cooled by 0.9°C from the Medieval Climate Anomaly to the Little Ice Age. These changes are significantly larger than the temperature anomalies documented in the instrumental record. The implied large perturbations in OHC and Earth’s energy budget are at odds with very small radiative forcing anomalies throughout the Holocene and Common Era. … The records suggest that dynamic processes provide an efficient mechanism to amplify small changes in insolation [surface solar radiation] into relatively large changes in OHC.”
However, they do not admit that the glaring lack of a post-1950 leap in temperature change depicted in their graphs seriously calls into question the dominance of anthropogenic forcing on ocean temperatures relative to natural variation and unforced net ocean heat changes.


Smoothing data obviously reduce its variation rate. As far as I remember, averaging n values reduces the variance by the square root of n. It one of the reasons why Mann should never have superimposed instrumental data at the end of its reconstruction. Whether willingly or not it is a deception.
Paul Aubrin wrote:
“Smoothing data obviously reduce its variation rate. As far as I remember, averaging n values reduces the variance by the square root of n.”
Sorry, but no. In fact, your scenario doesn’t even make sense. The variance of n values is the same before and after averaging it.
“So how did Rosenthal et al. leap to their conclusion? By oddly deciding that it is scientifically defensible to directly compare an 8,000-year-long trend to a 55-year trend (1955-2010) — which, statistically, is much like comparing an 8-month-long El Niño-dominated temperature anomaly to a 37-year-long temperature trend.”
It is funny, that you would mention this example. Because nobody thinks that anything is wrong with that el nino comparison here!
And this article obviously does the vary same, by painting arrows on graphs showing 10000 years of data, that seem to show that a 40 year change is not large.
That is total garbage.
The people writing these scientific articles have studied the subject. They could tell you, how long it takes for 700 m depths of water to show massive warming.
For those with little education, watching a pot of water on the stove should also do….
Tell that to the people that peer reviewed the paper, I’m sure they will take notice of your renowned expertise Sod.
“For those with little education, watching a pot of water on the stove should also do….”
Throw away the encyclopedia, sod is here.
Question for sod: if a pot of water has the heat source(fossil-fuelled)below it, how is it comparable to the oceans, who are heated above by the sun and carbon (sic)?
Thanks in advance.
“For those with little education”
Mirror, mirror.
You have yet to show that you ever proceeded further than junior high school.
@AndyG55
“For those with little education, watching a pot of water on the stove should also do….” – sod
Of course, those with a bit more education realize that there’s a lot more to boiling water than meets the mediocre mind.
https://www.youtube.com/watch?v=sCh2T9axLyY
https://flavourjournal.biomedcentral.com/articles/10.1186/2044-7248-2-5
Sod, the humor guy strikes again!
He ignored this,
“As Rosenthal et al. (2017) note, the total net radiative forcing from all anthropogenic influences since 1750 has been 1.6 W m-2, which leaves almost no room for humans to have had more than a modest (~0.1 W m-2) impact on climate prior to 1950.”
You,as usual fail to notice the missing CO2 driving influence on today’s temperature trends after 1950.
There are other published papers showing that Ocean waters have been cooling since the MWP time, that you will ignore.
Meanwhile you warmists whiners,still have not explained the well known large temperature swings during the Inter glacial period,CO2 levels changed very little over time:
http://c3headlines.typepad.com/.a/6a010536b58035970c01287656565a970c-800wi
Sunsett wrote:
“Meanwhile you warmists whiners,still have not explained the well known large temperature swings during the Inter glacial period,CO2 levels changed very little over time:”
The first thing you need to show is a good, scientific graph, not something cooked up on a Friday night in a basement.
Says the same person who looks at a month or two of “insane” Arctic sea ice anomalies and insists that this represents a “significant change” while simultaneously ignoring the much lower sea ice extent anomalies that took place throughout several decadal- and centennial-scale periods in the last 3,000 years…
https://notrickszone.com/wp-content/uploads/2016/11/NTZ-Arctic-Sea-Ice-Late-Holocene-Human-Influence-768×261.jpg
…and also ignoring the findings that show the Arctic was ice-FREE during the summer as recently as a few thousand years ago (Early Holocene), when CO2 levels were in the “safe” 260 ppm range.
Large relative to what? If “natural” warming and cooling reaches amplitudes and rates that are 10 times greater than what has been observed in the last 40 years, would it not be true that the most recent years of trends are small relative to the much larger (10 times) changes that occurred naturally? Or do you just want us to ignore the past since it doesn’t support the perception that modern warming is unprecedented?
Bova et al., 2016 (as mentioned above) indicate that the 0-1000 m layer can warm naturally at rates that exceed 0.1 C per decade. In contrast, the rate of warming in the 0-700 m layer for the 1971-2010 or 1955-2010 period is between 0.015 and 0.03 C per decade. Which is larger, sod – the historical period (with no CO2 or anthropogenic influence) or the modern period?
Kenneth…. Arctic sea ice has been dropping sharply for at least 35 years now:
http://psc.apl.uw.edu/wordpress/wp-content/uploads/schweiger/ice_volume/BPIOMASIceVolumeAnomalyCurrentV2.1.png
David….Antarctic sea ice has been rising sharply for at least 35 years now: https://notrickszone.com/wp-content/uploads/2016/10/Holocene-Cooling-Antarctica-f-SH-Sea-Ice-Extent-Jones16-copy.jpg
And the Southern Ocean SSTs have been dropping for 35 years now: https://notrickszone.com/wp-content/uploads/2016/10/Holocene-Cooling-Antarctica-e-Southern-Ocean-SST-Jones16.jpg
Does bringing up the short-term trend in Arctic sea ice have something to do with the subject at hand?
Appell STILL hasn’t figured out the NATURAL cycle of the AMO and its effect on Arctic sea ice.
It STILL ignores history that shows that 1979 was a year of EXTREME Arctic sea ice, up with the EXTREMES of the LIA.
Just keep IGNORING THE FACTS, appell-grub… Its what you do.
Arctic sea ice extent for last 10 years since the AMO topped out.
https://s19.postimg.org/umq1x3h4j/Arctic_ice_area_trend.png
Kenneth Richard wrote:
“David….Antarctic sea ice has been rising sharply for at least 35 years now”
That’s absolute garbage, Keith. Shame on you.
In fact, recorded Antarctic SIE has never been lower for this time of year:
data source:
latest values (v2)
ftp://sidads.colorado.edu/DATASETS/NOAA/G02135/south/daily/data/SH_seaice_extent_nrt_v2.csv
older:
ftp://sidads.colorado.edu/DATASETS/NOAA/G02135/south/daily/data/SH_seaice_extent_nrt.csv
David, can you explain why it is that you believe monthly anomalies make 35-year trends disappear?
Edinburgh and Day, 2016
http://www.the-cryosphere.net/10/2721/2016/tc-10-2721-2016.pdf
In stark contrast to the sharp decline in Arctic sea ice, there has been a steady increase in ice extent around Antarctica during the last three decades, especially in the Weddell and Ross seas. In general, climate models do not to capture this trend
http://phys.org/news/2016-11-antarctic-explorers-discovery100-years-epic.html
[T]he [Antarctic sea ice] levels in the early 1900s were in fact similar to today.
Hobbs et al., 2016
http://www.sciencedirect.com/science/article/pii/S0921818116300364
Over the past 37 years, satellite records show an increase in Antarctic sea ice cover that is most pronounced in the period of sea ice growth.
Comiso et al., 2016
http://journals.ametsoc.org/doi/abs/10.1175/JCLI-D-16-0408.1
The Antarctic sea ice extent has been slowly increasing contrary to expected trends due to global warming and results from coupled climate models. After a record high extent in 2012 the extent was even higher in 2014 when the magnitude exceeded 20×106 km2 for the first time during the satellite era. … [T]he [increasing] trend in sea ice cover is strongly influenced by the [decreasing] trend in surface temperature.
Meehl et al., 2016
http://www.nature.com/ngeo/journal/vaop/ncurrent/full/ngeo2751.html
Antarctic sea-ice extent has been slowly increasing in the satellite record that began in 1979. Since the late 1990s, the increase has accelerated, but the average of all climate models shows a decline.
Hobbs et al., 2016
http://onlinelibrary.wiley.com/doi/10.1002/2016JC012111/abstract
Observations show that Southern Ocean sea ice extent has increased since 1979, whereas global coupled climate models simulate a decrease over the same period. It is uncertain whether the observed trends are anthropogenically forced or due to internal variability, and whether the discrepancy between models and observations is also due to internal variability or indicative of a significant deficiency in the models. ….The Ross Sea is a confounding factor, with a significant increase in sea ice since 1979 that is not captured by climate models; however, existing proxy reconstructions of this region are not yet sufficiently reliable for formal change detection.
—–
Purich et al., 2016
http://www.nature.com/ncomms/2016/160204/ncomms10409/full/ncomms10409.html
Despite global warming, total Antarctic sea ice coverage increased over 1979–2013. However, the majority of Coupled Model Intercomparison Project phase 5 models simulate a decline. Mechanisms causing this discrepancy have so far remained elusive.
Purich et al., 2016
http://journals.ametsoc.org/doi/abs/10.1175/JCLI-D-16-0440.1
A strengthening of the Amundsen Sea Low from 1979-2013 has been shown to largely explain the observed increase in Antarctic sea ice concentration in the eastern Ross Sea
How to explain all the natural coolings that took place inbetween the warmings? It could hartly be CO2 that forced it.
Svend Ferdinandsen wrote:
“How to explain all the natural coolings that took place inbetween the warmings? It could hartly be CO2 that forced it.”
{Eye roll} There was no manmade CO2 back then.
Some of you still can’t understand that natural variability still runs underneath AGW warming.
So what year did natural variability stop being the dominant factor in producing temperature trends in the ocean? In other words, what year did humans take over as the cause of ocean temperature changes?
Natural cycles of warming and cooling are always going to VASTLY over-ride the essentially zero effect of any CO2 warming.
You still haven’t proven that CO2 causes any warming in a convective atmosphere..
And please don’t use that farce of a paper that starts at the base of a La Nina and ends at the top of an El Nino. That was so funny 🙂 !!
“{Eye roll} There was no manmade CO2 back then.”
What, No human CO2 from 1940 – 1970 when the “global cooling” scare was rampant.
Wow !!!
Between 1940 and 1970, human CO2 emissions more than tripled: 1 GtC/yr in the 1940s, 4.5 GtC/yr in the 1970s. So why did the globe cool by -0.3 C, and the Arctic by -1.5 C during that same period? What caused that cooling David?
And why, despite there being almost zero atmospheric moisture over the Antarctic…
and despite the aCO2 level climbing to over 400ppm.
there is ZERO warming (actually slight cooling) in the Antarctic for the whole of the satellite record.
Why is it that in places and periods which are not directly influenced by El Ninos and ocean oscillations..
…there is NO WARMING !!
David Appell 16. December 2016 at 2:21 AM | Permalink | Reply
Svend Ferdinandsen wrote:
“How to explain all the natural coolings that took place inbetween the warmings? It could hartly be CO2 that forced it.”
“{Eye roll} There was no manmade CO2 back then.”
That was my point. (Went right over your head.)
Your point wasn’t made. What caused the cooling between 1850 and 1910? CO2 was rising. And yet it cooled. Why?
““{Eye roll} There was no manmade CO2 back then.””
No, man made “global warming™” started with Jim Hansen et al, and continued with NOAA and Schmidt et al
Other than that, the ONLY warming as come from El Nino and ocean cycles driven by the 4 strongest cycles in some 700 years.
Kenneth: It’s not the last 10,000 years of ocean heat content that are the problem.
It’s the last several decades, which of course barely show up on your poor-choice-of-scale graphs.
https://www.nodc.noaa.gov/OC5/3M_HEAT_CONTENT/
Can you explain why you have decided that “the last several decades” of ocean heat content changes (a whopping +0.18 C between 1955 and 2010 in the 0-700 m layer) are “the problem” when ocean temperatures are still -0.65 C colder now than they were during the Medieval Warm Period, and just +0.3 C above what they were during the 1800s?
Ocean temperatures naturally warm and cool at rates of 0.1 C per decade in the 0-1000 m layer (Bova et al., 2016). Since 1955, net ocean temperature change is less than 1/3rd of that rate (0.03 C per decade) in the 0-700 m layer (Levitus et al., 2012). So why are the last few decades “the problem” when there hasn’t even been a change in the last few decades that comes close to falling outside the range of natural variability?
Kenneth, measuring ocean heat content by degrees of warming C is the wrong way to go.
You seem to think +0.17 C in the ocean is like +0.17 C in the atmo. Absolutely wrong,
Q: What is the heat capacity of the ocean compared to that of the atmosphere?
Rosenthal et al. (2013, 2017) and Levitus et al. (2012) and the IPCC (AR5) all routinely convert joules to degrees C. I cited the values they claimed in their peer-reviewed papers. Do you prefer joules?
No, I don’t think that. It is very rude to make up ridiculous statements and then claim others have thought/written them.
Volumetric heat capacity of water = 4.1796 J•cm−3•K−1
Volumetric heat capacity of air = 0.00121 J•cm−3•K−1
It takes 3,454 times more energy to heat up 1 liter of water than it does to heat up 1 liter of air.
Volume of the world’s oceans = 1.338 billion km3
Volume of the world’s atmosphere = 4.177 billion km3
It would take 1,106 times more energy to raise the temperature of the earth’s oceans by 1°C than it would to raise the temperature of the earth’s atmosphere by 1°C.
Q. Please cite a scientific paper that demonstrates that raising or lowering CO2 concentrations in volumes of parts per million (0.000001) is the dominant cause of heat changes in bodies of water. The last time I asked you this, you responded by citing Feldman et al., 2015, which does not even come close to addressing this question. It doesn’t even mention ocean heat.
“You seem to think +0.17 C in the ocean is like +0.17 C in the atmo. Absolutely wrong”
You really are an absolutely moronic and IGNORANT twerp.
Tell the truth, you NEVER did any physics did you. !!! Its all a self-aggrandising fantasy of yours, isn’t it.
The ocean temperature controls at least 70% of the atmospheric temperature. To think anything else is the most ignorant thing even you have ever said.
“What is the heat capacity of the ocean compared to that of the atmosphere?”
Finally you are starting to learn… amazing !!!!!
That is why ocean temperatures that CANNOT be influenced by CO2 drive the tiny rise in atmospheric temperatures via EL Nino ocean COOLING and natural ocean cycle.
Your comments really are being GREAT HELP.. Thanks DA. 🙂
“which of course barely show up on your poor-choice-of-scale graphs”
ROFLMAO..
That’s because they are such TINY, INSIGNIFICANT values.
Second decimal place temperature stuff.
I know you get scared when someone uses joules and scientific notation, and you get BIG numbers, but that is your child-mind play games with you.
“It’s the last several decades, which of course barely show up on your poor-choice-of-scale graphs”
Absolute RUBBISH.. as usual
That is because any change in ocean temperature is basically IMMEASUREABLE
You have to use some microscopic scale to see any change whatsoever.
You have YET AGAIN shown your absolute and total IGNORANCE of mathematics, resorting to the very depths of propaganda misrepresentation.
But that is all you have to try and push you CHILDISH propaganda, isn’t it , rotten-appell.