Two fundamental tenets of the anthropogenic global warming narrative are (1) the globe is warming (i.e., it’s not just regional warming), and (2) the warming that has occurred since 1950 can be characterized as remarkable, unnatural, and largely unprecedented. In other words, today’s climate is substantially and alarmingly different than what has occurred in the past….because the human impact has been profound.
Well, maybe not. Scientists are increasingly finding that the two fundamental points cited above may not be supported by the evidence.
In 2016, an examination of the peer-reviewed scientific literature has uncovered dozens of paleoclimate reconstructions that reveal modern “global” warming has not actually been global in scale after all, as there are a large number of regions on the globe where it has been cooling for decades. Even if it was warming on a global scale, the paleoclimate evidence strongly suggests that the modern warm climate is neither unusual or profoundly different than it has been in the past. In fact, today’s regional warmth isn’t even close to approaching the Earth’s maximum temperatures achieved earlier in the Holocene, or as recently as 1,000 years ago (the Medieval Warm Period), when anthropogenic CO2 emissions could not have exerted a climate impact.
In fact, there is a growing body of evidence that the warming in recent decades is not even unprecedented within the context of the last 80 years. That’s because the amplitude of the 1930s and 1940s warm period matched or exceeded that of the warmth in the late 20th and early 21st centuries in many regions of the world. Furthermore, between the warmth of the 1930s and ’40s and the warmth of the 1990s to present, there was a very widely publicized cooling period (late 1950s to early 1970s) that was heavily discussed in the peer-reviewed scientific literature.
Today’s instrumental datasets curiously do not reflect this 20th century warming-cooling-warming oscillatory shape, however, as doing so would not lend support to the modeled understanding that climate is shaped by anthropogenic CO2 emissions, which have increased linearly, not cyclically. In fact, not only has the high amplitude of the 1930s and 1940s warmth been “adjusted” down or depressed in global-scale representations of instrumental temperatures by NASA or the MetOffice, the substantial cooling (-0.5°C in the Northern Hemisphere, including -1.5°C cooling in the Arctic region) that occurred in the 1960s and 1970s has all but disappeared from today’s temperature graphs.
Scientists, meanwhile, keep on publishing their results. And their results don’t lend support to the narrative that the globe has been synchronously warming, or warming in linear fashion and in concert with the rise in anthropogenic CO2 emissions. Indeed, in many regions of the world, decadal-scale cooling has occurred since the mid-20th century.
Listed below are a collection of 60 peer-reviewed scientific papers published within the last year (2016) undermining the “consensus” position that modern warming patterns are global in extent and synchronization, and that today’s warmth is both unusual and unprecedented. The first section (1) identifies the regions of the world where there has been no net warming in recent decades. The second section (2) puts modern climate into its much larger Holocene context, revealing just how insignificant and unremarkable this current (regional) warming trend has been relative to history.
(1) ‘Global’ Warming? No Net Warming In These Regions Since Mid Or Late 20th Century
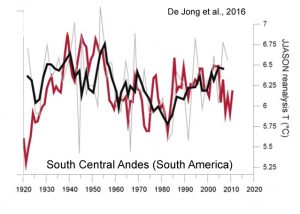
De Jong et al., 2016 (Andes, South America)
[T]he reconstruction…shows that recent warming (until AD 2009) is not exceptional in the context of the past century. For example, the periods around AD 1940 and from AD 1950–1955 were warmer. This is also shown in the reanalysis data for this region and was also observed by Neukom et al. (2010b) and Neukom and Gergis (2011) for Patagonia and central Chile. Similarly, based on tree ring analyses from the upper tree limit in northern Patagonia, Villalba et al. (2003) found that the period just before AD 1950 was substantially warmer than more recent decades.
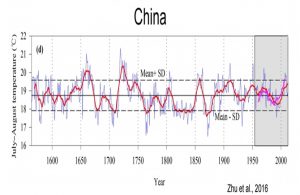
Zhu et al., 2016 (China)
[W]e should point out that the rapid warming during the 20th century was not especially obvious in our reconstructed RLST.
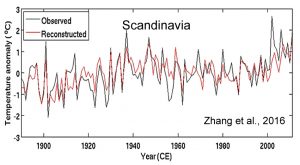
Zhang et al., 2016 (Scandinavia)
[P]resent-day global mean air temperatures may have been equally high around 1000 years ago during the so-called Medieval Climate Anomaly (MCA; Lamb, 1969; Grove and Switsur, 1994). However, since regional temperature reconstructions display large variability in the timing and magnitude of the MCA (PAGES 2k Consortium, 2013), this issue has not yet been adequately settled. Hence, there is still a great need to produce and improve empirical proxy data to further our understanding of near and distant climate changes.
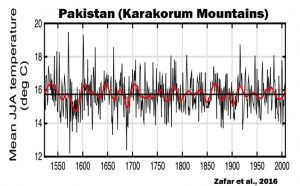
Zafar et al., 2016 (Pakistan, Karakorum Mountains)
[O]ur results indicate that Karakorum temperature has remained decidedly out of phase with hemispheric temperature trends for at the least the past five centuries
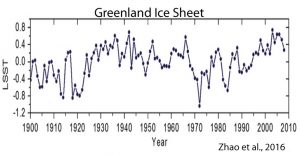
Zhao et al., 2016 (Greenland Ice Sheet)
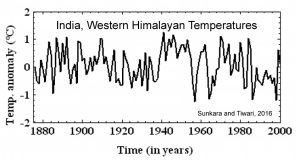
Sunkara and Tiwari, 2016 (India, Western Himalayas)
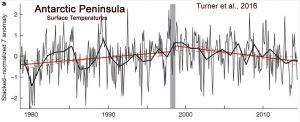
Turner et al., 2016 (Antarctic Peninsula)
Absence of 21st century warming on Antarctic Peninsula consistent with natural variability
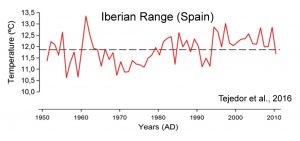
Tejedor et al., 2016 (Iberian Range, Spain)
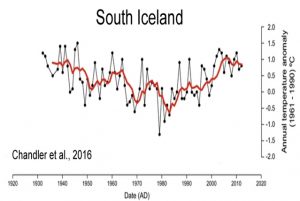
Chandler et al., 2016 (South Iceland)
Analysis of climate data for SE Iceland also indicates that the three periods of ice-frontal retreat [1936-’41, 1951-’56, and 2006-’11] identified are associated with similar summer air temperature values, which has previously been shown to be a key control in terminus variations in Iceland. We, therefore, demonstrated that the coincidence of the most recent phase of ice-frontal retreat at Skálafellsjökull (2006–2011) and warming summer temperatures is not unusual in the context of the last ~80 years. This highlights the need to place observations of contemporary glacier change in a broader, longer-term (centennial) context.
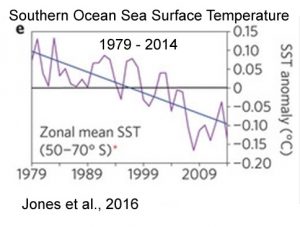
Jones et al., 2016 (Southern Ocean)
[C]limate model simulations that include anthropogenic forcing are not compatible with the observed trends.
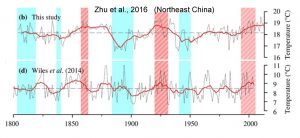
Zhu et al., 2016 (Northeast China)
We identified four major cold periods (1839–1846, 1884–1901, 1906–1908 and 1941–1958) and three major warm periods (1855–1880, 1918–1932 and 1998–2013) in the past 211 years. The multi-taper method spectral analysis revealed significant cycles at 48.8, 11.5, 8.9, 3.9, 3.5 and 2–3 years, which might be associated with global climate oscillations and land-sea thermal contrasts, such as the sea surface temperatures, El Niño-Southern Oscillation, Atlantic Multidecadal Oscillation and solar activity.
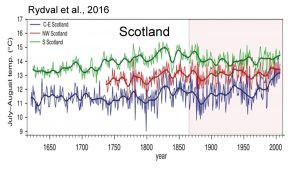
Rydval et al., 2016 (Scotland)
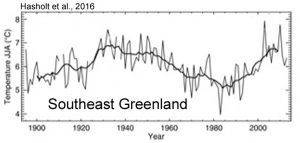
Hasholt et al., 2016 (Southeast Greenland)
We determined that temperatures for the ablation measurement periods in late July to early September were similar in both 1933 and the recent period [1990s – present], indicating that the temperature forcing of ablation within the early warm period and the present are similar.
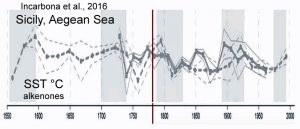
Incarbona et al., 2016 (Sicily, Aegean Sea)
Solar activity modulates patterns in surface temperature and pressure that resemble NAO phases, through dynamical coupling processes between the stratosphere and the troposphere that transmit the solar signal to the Earth’s surface.
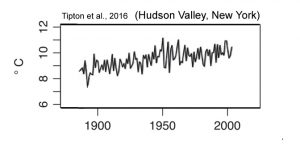
Tipton et al., 2016 (Hudson Valley, New York)
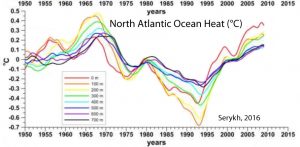
The very fast climate warming of the Euro-Asian continent that began in the 1970s may be associated with the enhanced heat transport from the North Atlantic in this period. This is evident from the fields and time series obtained in the present paper. The hiatus of this warming after 1999 may be due to the decreased heat transfer from the North Atlantic Ocean to the Eurasian territory.
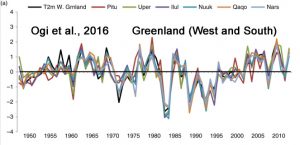
Ogi et al, 2016 (Greenland, West and South)
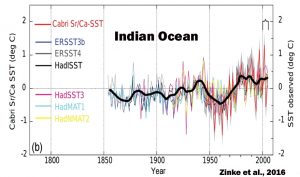
Zinke et al., 2016 (Indian Ocean)
We calibrate individual robust Sr / Ca records with in situ SST and various gridded SST products. The results show that the SST record from Cabri provides the first Indian Ocean coral proxy time series that records the SST signature of the PDO in the south-central Indian Ocean since 1945. … Marked negative Sr /Ca anomalies (warmer) are observed during the first half of the 20th century centred at 1918/19, 1936–1941 and in the period 1948–1951 that exceed anomalies in the 1961 to 1990 reference period.
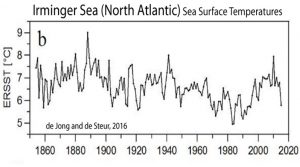
de Jong and de Steur, 2016 (North Atlantic)
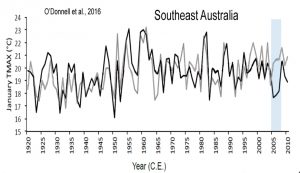
O’Donnell et al., 2016 (Australia SE)
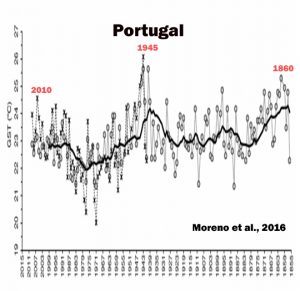
Moreno et al., 2016 (Portugal)
The major external forcing of the climate system derives from the Sun. A solar signature has been found in global mean surface temperatures, with evidence directly related to two noticeably different features of the Sun’s dynamics: its short-term irradiance fluctuations and secular patterns of 22-year and 11-year cycles (Scafetta and West, 2008). … [I]t is recognized that solar forcing manifestations denote a strong spatial and seasonal variability (Usoskin et al., 2006), and this would be the reason why it might be illusive to seek a single global relationship between climate and solar activity (de Jager, 2005). Thus, Le Mouël et al. (2009) stated that a regional approach may allow one to identify specific forms of solar forcing, where and when the solar input is most important. … [S]olar footprints on terrestrial temperatures [are] due to the strong non-linear hydrodynamic interactions across the Earth’s surface, and the accepted longerterm solar activity influence creating temperature oscillations for tens or even hundreds of years (Scafetta and West, 2003, 2007, 2008). … These spectral analysis results appear to support a solar forcing with regards to Minho GHD [grape harvest dates]
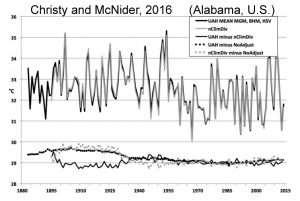
Christy and McNider, 2016 (Alabama, U.S.)
The time frame is 1883-2014. … Varying the parameters of the construction methodology creates 333 time series with a central trend-value based on the largest group of stations of -0.07 °C decade-1 with a best-guess estimate of measurement uncertainty being -0.12 to -0.02 °C decade-1. This best-guess result is insignificantly different (0.01 C decade-1) from a similar regional calculation using NOAA nClimDiv data beginning in 1895. … Finally, 77 CMIP-5 climate model runs are examined for Alabama and indicate no skill at replicating long-term temperature and precipitation changes since 1895.
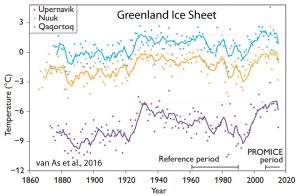
van As et al., 2016 (Greenland Ice Sheet)
We conclude that at our study sites annual net ablation is likely to be larger in recent years than during any previous period in the instrumental era, covering up to 150 years. … [I]n southern Greenland ablation peaked significantly around 1930. While most of Greenland underwent relatively warm (summer) conditions in the 1930s (Cappelen 2015), this was most notable at the more southern locations, resulting in amplified ablation values according to our estimates. JJA [summer] temperatures were higher in 1928 and 1929 than in any other year of the Qaqortoq record, both attaining values of 9.2°C. This suggests that ablation in those years may have exceeded the largest net ablation measured on the Greenland ice sheet ( 2010).
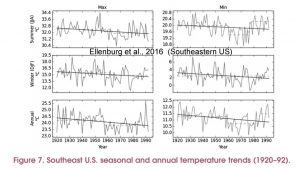
Ellenburg et al., 2016 (Southeastern U.S.)
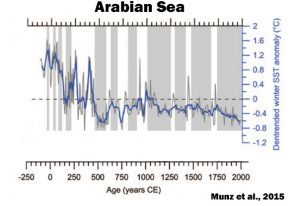
Munz et al., 2015 (Arabian Sea)
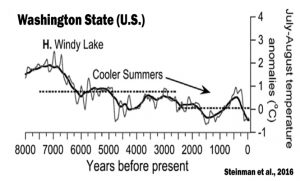
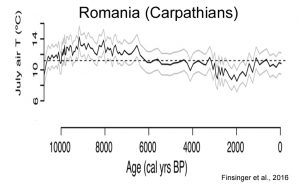
(2) Today’s Climate Still Colder Than Most Of The Last 10,000 Years
Present >
Fudge et al., 2016 (West Antarctica) 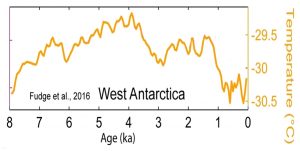
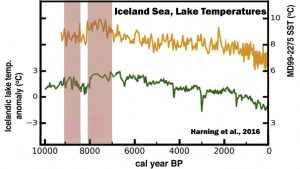
Harning et al., 2016 (Iceland)
Distal lakes document rapid early Holocene deglaciation from the coast and across the highlands south of the glacier. Sediment from Skorarvatn, a lake to the north of Drangajokull, shows that the northern margin of the ice cap reached a size comparable to its contemporary limit by ~10.3 ka. Two southeastern lakes with catchments extending well beneath modern Drangajokull confirm that by ~9.2 ka, the ice cap was reduced to ~20% of its current area.
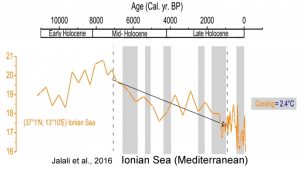
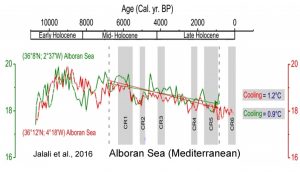
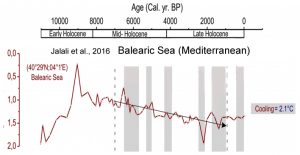
Jalali et al., 2016 (Mediterranean Sea)
Several proxy records have documented surface water variability of the Mediterranean Sea during the Holocene (Kallel et al., 1997a, b, 2004; Cacho et al., 2001; Guinta et al., 2001; Rohling et al., 2002; Emeis et al., 2003; Essalami et al., 2007; Frigola et al., 2007; Castañeda et al., 2010; Boussetta et al., 2012; Martrat et al., 2014). Most of them reveal that Mediterranean Sea surface temperatures (SSTs) have undergone a long-term cooling punctuated by several cold relapses (CRs; Cacho et al., 2001; Frigola et al., 2007). While orbital forcing likely explains this long-term tendency, solar activity and volcanism contribute to forced variability (Mayewski et al., 2004; Wanner et al., 2011) together with internal variability (i.e. Atlantic multi-decadal variability (AMV), North Atlantic Oscillation; NAO) all together embedded in the multi-decadal scale variability seen in paleorecords.
Steinman et al., 2016 (Washington State, US)
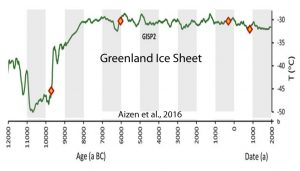
Aizen et al., 2016 (Asia, Greenland Ice Sheet)
[R]ecent air temperatures (1993–2003) are, on average, 0.5 °C lower than air temperatures estimated during the MWP [Medieval Warm Period] and Holocene Climate Optimum. … [P]eriods warmer than modern periods occurred for ∼6.5 ka [6,500 years] including during the HCO and Medieval Warm Period.
Finsinger et al., 2016 (Romania, Carpathians)
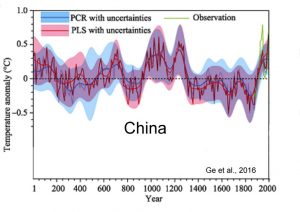
Ge et al., 2016 (China)
Results of this study show that warm intervals over the last 2000 years were in AD 1-200, AD 551-760, AD 951-1320, and after AD 1921, while cold intervals were in AD 201-350, AD 441-530, AD 781-950, and AD 1321-1920. Interestingly, temperatures during AD 981-1100 and AD 1201-1270 were comparable to those of our Present Warm Period, but have an uncertainty of 0.28°-0.42°C at 95% confidence level. Temperature variations over the whole of China are typically in phase with those of the Northern Hemisphere (NH) after AD 1000, the period which covers the Medieval Climate Anomaly, the Little Ice Age (LIA), and the Present Warm Period.
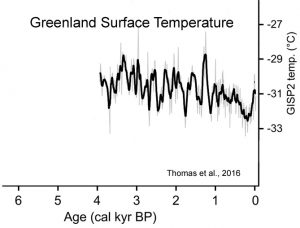
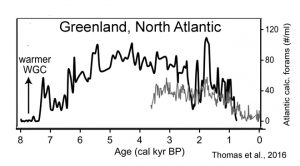
Thomas et al., 2016 (Greenland, West)
Paired climate and ice sheet records from previous warm periods can elucidate the factors influencing GrIS mass balance on time scales longer than the observational record [Briner et al., 2016]. During the middle Holocene, temperature on Greenland was ~ 2°C higher than present [Cuffey and Clow, 1997; Axford et al., 2013].
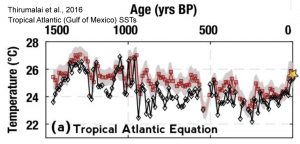
Thirumalai et al., 2016 (Tropical Atlantic, Gulf of Mexico)
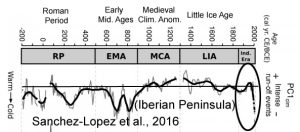
Sanchez-Lopez et al., 2016 (Iberian Peninsula)
The dominant warm and arid conditions during the MCA [Medieval Climate Anomaly, 900-1300 CE], and the cold and wet conditions during the LIA [Little Ice Age, 1300-1850 CE] indicate the interplay of the NAO+, EA+ and NAO- , EA- [positive/negative North Atlantic Oscillation, East Atlantic phases], respectively. Furthermore, the higher solar irradiance during the [“warm conditions”] RP [Roman Period, 200 BCE – 500 CE] and MCA [Medieval Climate Anomaly, 900-1300 CE] may support the predominance of the EA+ [positive East Atlantic] phase, whereas the opposite scenario [“colder temperatures”] during the EMA [Early Middle Age, 500-900 CE] and LIA [Little Ice Age, 1300-1850 CE] may support the predominance of the EA- [negative East Atlantic] phase, which would favour the occurrence of frequent and persistent blocking events in the Atlantic region during these periods.
Lyu et al., 2016 (China)
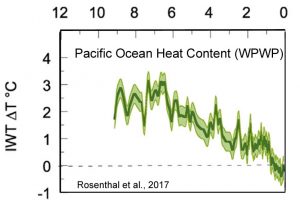
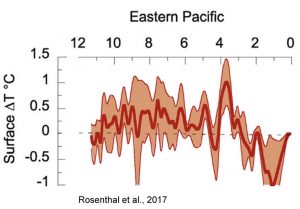
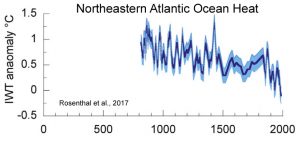
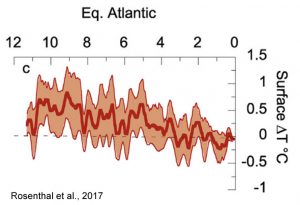
Rosenthal et al., 2017 (Pacific, Atlantic Oceans)
Here we review proxy records of intermediate water temperatures from sediment cores and corals in the equatorial Pacific and northeastern Atlantic Oceans, spanning 10,000 years beyond the instrumental record. These records suggests that intermediate waters [0-700 m] were 1.5-2°C warmer during the Holocene Thermal Maximum than in the last century. Intermediate water masses cooled by 0.9°C from the Medieval Climate Anomaly to the Little Ice Age.
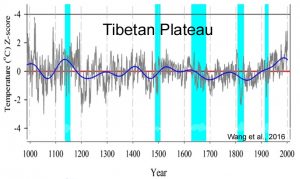
Wang et al., 2016 (Tibetan Plateau)
.
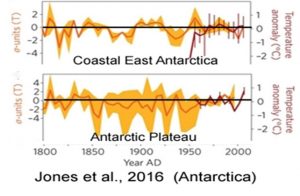
Jones et al., 2016 (East Antarctica, Antarctic Plateau)
Over the 36-year satellite era, significant linear trends in annual mean sea-ice extent, surface temperature and sea-level pressure are superimposed on large interannual to decadal variability. Most observed trends, however, are not unusual when compared with Antarctic palaeoclimate records of the past two centuries.
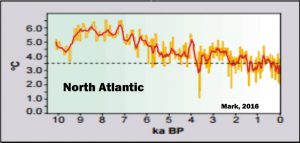
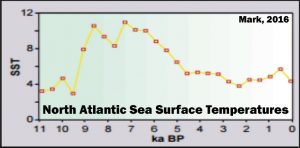
Mark, 2016 (North Atlantic)
Much of the North Atlantic shows a maximum between 5000-8000 years B.P. Bradley et. al (2003) compiled a number of marine and terrestrial paleoclimatic proxies from throughout the Holocene which show fairly consistent broad trends in the climatic history of the North Atlantic region. Drawing from isotopic concentrations in ice cores, diatoms, pollen, and dendrochronological analyses, a clear period of elevated temperature, beginning at about 10,000 B.P and concluding at about 6,000 B.P precedes a slow and steady trend of cooling until present day
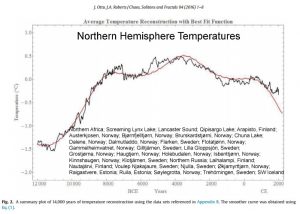
Otto and Roberts, 2016 (Northern Hemisphere)
In addition to temperature records limited to the past 4000 years, data for the past few thousand years were tested. When the data were explored over the past 10,000 years, greater fluctuations in the temperature can be seen with a significant rise in temperature beginning at about 11,000 BCE and ending at 2000 CE with a maximum at about 5,000 BCE.
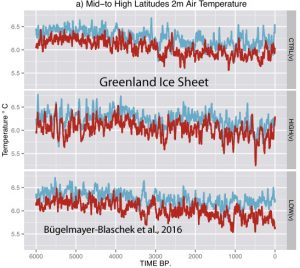
Bügelmayer-Blaschek et al., 2016 (Greenland Ice Sheet)
Present <
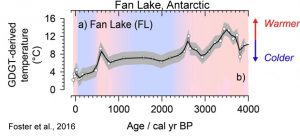
Foster et al., 2016 (Fan Lake, Antarctic)
The Antarctic and sub-Antarctic GDGT–temperature reconstruction for Fan Lake showed the warmest conditions between c. 3800 to 3300 cal yr BP with additional peaks in temperature at c. 2600 and 600 cal yr BP.
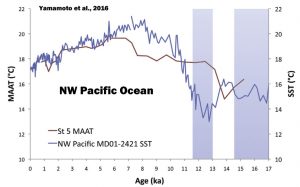
Yamamoto et al., 2016 (NW Pacific)
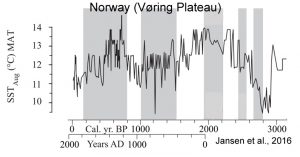
Jansen et al., 2016 (Norway)
We suggest that deviations in ELA fluctuations between Scandinavian maritime and continental glaciers around 7150, 6560, 6000, 5150, 3200 and 2200 cal. yr BP reflect the different response of continental and maritime glaciers to drops in total solar irradiance (TSI).
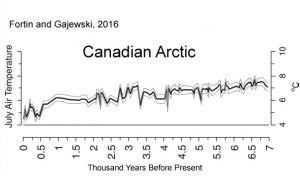
Fortin and Gajewski, 2016 (Canadian Arctic)
A study of chironomid remains in the sediments of Lake JR01 on the Boothia Peninsula in the central Canadian Arctic provides a high-resolution record of mean July air temperatures for the last 6.9 ka …. Biological production decreased again at ~ 2 ka and the rate of cooling increased in the past 2 ka, with coolest temperatures occurring between 0.46 and 0.36 ka [460 and 360 years ago], coinciding with the Little Ice Age. Although biological production increased in the last 150 yr, the reconstructed temperatures do not indicate a warming during this time. … Modern inferred temperatures based on both pollen and chironomids are up to 3°C cooler than those inferred for the mid-Holocene.
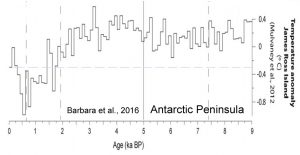
Barbara et al., 2016 (Antarctic Peninsula)
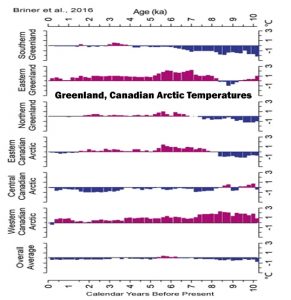
Briner et al., 2016 (Greenland Ice Sheet)
The temperature decrease from the warmest to the coolest portions of the Holocene is 3.0 ± 1.0 °C on average (n = 11 sites). The Greenland Ice Sheet retracted to its minimum extent between 5 and 3 ka [5,000 and 3,000 years ago], consistent with many sites from around Greenland depicting a switch from warm to cool conditions around that time.
The temperature record, which integrates all seasons, shows rapid warming from the onset of the Holocene until ~9.5 ka [9,500 years ago], relatively uniform temperature at the millennial scale until ~7 ka [7,000 years ago], followed by ~3.5 °C temperature decline to the Little Ice Age [1250-1850 C.E.], followed by ~1.5 °C warming to today. [Today’s Greenland Ice Sheet temperatures are 2.0 °C colder than the Early and Middle Holocene] . The record also shows centennial-scale variability on the order of 1-2 °C, and a ~3 °C temperature oscillation during the 8.2 ka event.
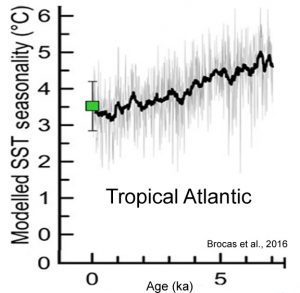
Brocas et al., 2016 (Tropical Atlantic)
[W]ithin the mid-LIG [Last Interglacial, ~125,000 years ago], a significantly higher than modern SST seasonality of 4.9°C (at 126 ka) and 4.1°C (at 124 ka) is observed. These findings are supported by climate model simulations and are consistent with the evolving amplitude of orbitally induced changes in seasonality of insolation throughout the LIG, irrespective of wider climatic instabilities that characterised this period.
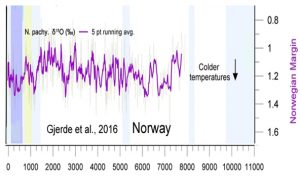
Gjerde et al., 2016 (Norway)
The resulting Pw record is of higher resolution than previous reconstructions from glaciers in Norway and shows the potential of glacier records to provide high-resolution data reflecting past variations in hydroclimate. Complete deglaciation of the Ålfotbreen occurred ~9700 cal yr BP, and the ice cap was subsequently absent or very small until a short-lived glacier event is seen in the lake sediments ~8200 cal yr BP. The ice cap was most likely completely melted until a new glacier event occurred around ~5300 cal yr BP, coeval with the onset of the Neoglacial at several other glaciers in southwestern Norway. Ålfotbreen was thereafter absent (or very small) until the onset of the Neoglacial period ~1400 cal yr BP. The ‘Little Ice Age’ (LIA) ~650-50 cal yr BP [1350 to 1950] was the largest glacier advance of Ålfotbreen since deglaciation, with a maximum extent at ~400-200 cal yr BP, when the ELA was lowered approximately 200 m relative to today.
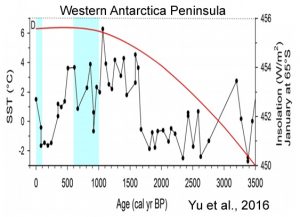
Yu et al, 2016 (Western Antarctica Peninsula)
The period at 900–600 cal B.P. was coldest as indicated by ice advance, abundance of kill ages from ice-entombed mosses exposed recently from retreating glacial ice, and apparent gap in peatbank initiation. Furthermore, the discovery of a novel Antarctic hairgrass (Deschampsia antarctica) peatland at 2300–1200 cal B.P. from the mainland Antarctic Peninsula suggests a much warmer climate than the present. … [T]he sea surface temperature record from Palmer Deep off Anvers Island suggests a pronounced climate warming of ~3°C at 1600–500 cal B.P. [Shevenell et al., 2011].
Solomina et al., 2016 (Caucasus Mountains)
The climate was warmer and glaciers were likely receding in the beginning of the past millennium CE (the “Arkhyz break in glaciation”). … In this pass, remains of wood radiocarbon dated to 700 ± 80 BP (1180–1420 CE) were buried in a 1.5-m-thick layer of alluvium (Kaplin et al., 1971; Kotlyakov et al., 1973). Currently, the upper tree limit is located 800–900 m below this elevation. … According to indirect estimates based on pollen analyses, the upper tree limit in the “Arkhyz” period was 200–300 m higher than today (Tushinsky, Turmanina, 1979). The remains of ancient buildings and roads were also found in the Klukhorsky pass at an elevation of 2781 a.s.l. [above sea level] (Tushinsky et al., 1966), and the glacier was still present at this elevation in the mid 20th century. … [I]n Central and East Transcaucasia, there are artificial terraces at elevations where agriculture is not currently possible and that there are remnants of forests in places where forests have not grown since the 16th century CE. ...
Turmanina (1988), based on pollen analysis, suggested that, in the Elbrus area, the climate during the “Arkhyz” time was dryer and warmer than in the late 20th century by 1–2 °C. … Solomina et al. (2014) determined the Medieval warming in the Caucasus to be approximately 1 °C warmer than the mean of the past 4500 years. According to the Karakyol palynological and geochemical reconstructions, the warm period was long and lasted for five centuries. Considering the suggestion of Turmanina (1988) that it was also less humid, the likelihood that many glaciers, especially those located at relatively low elevation, disappeared is very high. … The maximum glacier extent in the past millennium was reached before 1598 CE. The advance of the 17th century CE, roughly corresponding to the Maunder Minimum, is recorded at Tsey Glacier. … General glacier retreat started in the late 1840s CE and four to five minor readvances occurred in the 1860s–1880s CE. In the 20th century CE, the continued retreat was interrupted by small readvances in the 1910s, 1920s and 1970s–1980s.
Bolch et al., 2016 (Himalayas, Karakoram)
Glaciers in the Hunza Catchment (Karakoram) are in balance since the 1970s … Previous geodetic estimates of mass changes in the Karakoram revealed balanced budgets or a possible slight mass gain since the year ~ 2000. Indications for longer-term stability exist but no mass budget analyses are available before 2000. Here, we show that glaciers in the Hunza River basin (Central Karakoram) were on average in balance since the 1970s based on analysis of stereo Hexagon KH-9, SRTM, ASTER and Cartosat-1 data. Heterogeneous behaviour and frequent surge activities were also characteristic for the period before 2000.
Lundeen and Brunelle, 2016 (Idaho, United States)
Together, the proxies suggest that the early Holocene experienced larger than average snowpacks but very warm summers. Warmer than modern summer temperatures were maintained through much of the mid-Holocene, but snowpacks decreased dramatically, creating the most extreme xeric conditions in the Holocene between ~7100 and 6000 BP.
Spolaor et al., 2016 (Arctic Ocean, Region)
Researchers have found that 8000 years ago the Arctic climate was 2 to 3 degrees warmer than now, and that there was also less summertime Arctic sea ice than today.
MacGregor et al., 2016 (Greenland Ice Sheet)
[T]he interior of the GrIS [Greenland Ice Sheet] is flowing 95% slower now than it was on average during the Holocene [the last 9,000 years].
Sun et al., 2016 (China)
Comparing the climate between the mid-Holocene and present in the Xi’an area, the MAT [mean annual temperature] was about 1.1°C higher than today and the AP [annual precipitaion] was about 278 mm higher than today, similar to the modern climate of the Hanzhong area in the southern Qinling Mountains.
Paus and Haugland, 2016 (Scandinavia)
Around [9,500 years ago], pine suddenly established vertical belts of at least 200 m. These represent the highest pine-forests during the Holocene, ca. 210–170 m higher than today when corrected for land uplift. By this, summer temperatures at least 1–1.3°C warmer than today are indicated for the early Holocene thermal maximum around [8,500 to 9,500 years ago].
Easterbrook, 2016 (Greenland)



Tour de force Kenneth. However “the science is settled” as we know, and politicians will not believe anything that conflicts with the central meme, even though it is so well researched and annotated.
This is necessary ammunition all the same and on the drip, drip, principle, your posts have to be having an impact and they are also an excellent resource.
“Climate science is settled *enough*” Raymond Pierrehumbert, Slate 10/1/14
http://www.slate.com/articles/health_and_science/science/2014/10/the_wall_street_journal_and_steve_koonin_the_new_face_of_climate_change.html
““Climate science is settled *enough*” ”
… for generating low-end propaganda pap.
lap up rotten appell.
dennisambler wrote:
“Tour de force Kenneth.”
Surely ready for publication in Nature.
Kenneth, let me know when this is about to come out there. Thanks. — David
No, the work he quotes is published in MANY journals..
…. or are you purposely avoiding all the PEER-REVIEWED papers he cites.
For a global mean to be meaningful all regional temperature time series must correlate positively. Your contribution shows they do not because we may have warming in one region and cooling in another. The global mean is therefore a meaningless quantity.
“For a global mean to be meaningful all regional temperature time series must correlate positively.”
no. A mean is a mean. It is a mathematical term. Please google it and start finishing that primary school!
Giving random graphs around the globe is utterly useless for the subject at hand. It shows absolute nothing.
Only people who love fake news will look at these graphs, notice that the endpoint (quite often decades ago) is not the highest point on the graph and then will draw utterly false conclusions about the globe.
Another way of putting this: Scientific information that contradicts my beliefs is fake. Scientific information that affirms my beliefs is real. In this way, I am always right.
” Scientific information that contradicts my beliefs is fake.”
The problem is, the information you present contradicts nothing. You can not contradict claims about global warming by looking at regional data. It is impossible.
It is fake science .
“You can not contradict claims about global warming by looking at regional data.” – resident idiot sod
Sorry, sod, by you misstate the issue yet again, and so get it completely wrong, as usual. You cannot build any picture of global behavior without looking at an aggregate of many regions of the globe.
HOWEVER – generating a hockey stick from data acquired at only one location on the earth…
http://barentsobserver.com/sites/barentsobserver.com/files/styles/grid_8/public/main/articles/Yamal.SouthTambey.jpg?itok=HPVaaaFs
…is NOT a legitimate way to characterize what is going on globally.
http://algorelied.com/?p=2875
I’ve heard of talking out of both sides of one’s mouth, but sod takes it to the next level, and hasn’t a clue what an idiot he reveals himself to be.
Another dead on arrival comment from Sod,who has no data,No counterpoint,no cogent argument to make.
Micheal Mann’s paper claim a hockey stick in the 20th century in the Northern Hemisphere with a mostly flat blade for nearly 1,000 years. Meanwhile many charts you ignore shows the very OPPOSITE,with flat to a cooling trend.
When will stop your drive by toe nibbling silliness?
yon: Sod is exactly correct.
Advice: When you’re in a hole, stop digging.
“Advice: When you’re in a hole, stop digging.”
Advice you have never taken, is it rotten appell.
You must be down well below your sewer by now, and yet you keep digging deeper through your own crap.
“yon: Sod is exactly correct.” – D.Appell
Don’t just say it, prove it.
This will be amusing if you try, but you won’t, because you can’t.
sod 22. December 2016 at 10:21 PM | Permalink | Reply
“” Scientific information that contradicts my beliefs is fake.”
The problem is, the information you present contradicts nothing. You can not contradict claims about global warming by looking at regional data. It is impossible.
It is fake science .”
Now here come the smug warmunists throwing around the word CONTRADICT when it suits them. When their entire science is NOT crisp clear cut logical calculations but always throwing around PROBABILITIES.
So how PROBABLE is it that it snows for the first time since 1979 in that place between morocco and Algier when there’s now been 37 years of relentlessly rising CO2, relentlessly rising warming IR backradiation, allegedly, and relentlessly rising global average temperature, allegedly.
Now obviously not enough to make one flying rats crap of a difference.
So let’s defund all the warmunist leeches and let’em pay for their wind turbine hobby out of their own pocket.
“…their entire science is NOT crisp clear cut logical calculations but always throwing around PROBABILITIES.” – DirkH
Yes,”probabilities,” or at least the illusion of same. But not real probabilities, because for a chaotic system you can’t assign a probability to a given event. I.e., you can’t associate an event with a point in any well defined probability space. What they have are fuzzy probabilities, which constantly require updating based on new data. It’s like playing with weighted dice where the weighting is constantly being randomly altered.
But they make such pretty graphs, though, don’t they? It’s almost as if they knew what they are doing. Hmm, well, I guess THEY know what they are doing. They just hope we don’t.
@DirkH
Here’s a more in depth analysis on why sod’s and applell’s (and apparently nearly everyone else’s) views on probabilities in Climate Science are TOTALLY W_R_O_N_G!
https://judithcurry.com/2011/02/10/spatio-temporal-chaos/
Kenneth, you simply aren’t publishing convincing science.
Serious question: do you know what a Gish Gallop is?
Serious question #2: do you know how to incorporate results from all over the world, or disparate time periods, to come to conclusions about GLOBAL changes?
Your “challenges” (“It’s Gish Gallop!” and “But, but, they’re not GLOBAL!”) to the collection and presentation of peer-reviewed scientific papers presenting data that do not conform to your beliefs are, in my opinion, not all that serious. In fact, I truthfully find them rather feeble and hackneyed. Everything you write I have seen before…many, many times.
For the record, I didn’t (and don’t) have “convincing” you in mind here. I realize you won’t change your mind no matter the information is presented. And that’s OK with me.
“you simply aren’t publishing convincing science.”
David, you have NEVER published any convincing science.
EVER !!
You have been torn apart at every attempt.
Yes we know what gish-gallop is.. all we have to do for a prime example is to read your inane anti-science posts.
Again.. REAL DATA hurts you doesn’t it , you poor sop.
Bwahahahahahahahahahaha!!!
You have NOTHING,Sod! Nothing!
Not a single comment on the many papers posted here showing Hockey Sticks don’t exist in many regions of the world,thus a “Global” hockey stick claim becomes impossible.
…especially when, after being closely examined, even local “hockey sticks” fall apart.
Germany has three sods and the USA seven hockey sticks. So their mean wealth is five items. Thanks for the google tip.
Thanks sop.. you have just stated that the Global Average Temperature is meaningless.
WELL DONE
There has been regional warming in some areas from AMO and El Nino effects..
These feed into the meaningless calculation of the Global Mean Temperature.
But there has been NO “GLOBAL” WARMING.
continued… pressed send too soon..
“But there has been NO “GLOBAL” WARMING.” over the last 70+ years.
There was an obvious world-wide COLD period called the LIA, and before that it is obvious that the whole planet was warmer than it is now for most of the first 3/4 of the current interglacial.
The Hockey stick graphs were nothing but an anti-science political stunt to try and erase these facts.
If the Arctic temperature increase has been +1.0 C since 1979, but the Antarctic temperature decrease has been -0.7 C since 1979, we have a net change of +0.3 C when combining the two polar regions.
But is it accurate to say that “polar amplification” has caused +0.3 C of warming since 1979 if one of the two regions actually cooled?
That’s what’s going on here when it’s called “global” warming.
Riser et al., 2016
http://www.nature.com/articles/nclimate2872.epdf
Most regions of the world ocean are warmer in the near-surface [0-700 m] layer than in previous decades, by over 1° C in some places. A few areas, such as the eastern Pacific from Chile to Alaska, have cooled by as much as 1° C, yet overall the upper ocean has warmed by nearly 0.2° C globally since the mid-twentieth century.
This is what I am referring to here. Some regions of the ocean have cooled by 1° C since the 1950s, but since they combine all the regions that are cooling with the regions that are warming and come up with an average that shows a few tenths of a degree of warming, they can then say the “globe” is, and has been, warming. Even though the globe hasn’t.
Sod,
As anyone with a family (say 2 generations or more) that has lived in a region for any length of time understands climate is LOCAL and regional.
Climate is never global! Climate affects on regions and particular localities with observed changes due to the local and regional geography, topology, etc.
It is part of the great scam to inaccurately aggregate and homogenize the temperatures across the globe and insinuate that this implies some sort of global climate change. It does not and it can not! By removing the local and regional effects, the real climate information has been smooth away, glossed over and hidden.
Does climate change globally, in some hugely smooth way — NO — It changes regionally and incrementally, in a series of stops and starts. To say otherwise is to deny all we know in the history of changes to weather and climate.
Can it indicate trends in temperature change, yes but only if it is done carefully and without the unjustified changes to historical records. Can good temperature data indicate possible climate trends — yes, but only in a very general sense. A good understanding of local changes are all that matter for real climate change trend information.
E.g. It is said 2016 has been the hottest year ever by some. This may or may not be true. Overall globally there have been a few small localities with very high temperatures but regionally there are vast areas that are experiencing significantly cooler winters. So does the ‘global temperature’ tell us whether our climate is warming or cooling? Neither as it is too blunt a tool to show such fine detail.
tom wrote:
“Climate is never global!”
Pierre, where do you find these numbskulls?
“where do you find these numbskulls?”
You are always here.
No, it means a supposed CHANGE (or so-called “trend”) in the global mean is a meaningless quantity. My 2010 Venus/Earth temperature-vs-pressure comparison showed the century-old Standard Atmosphere is a true representation of the global mean Earth troposphere, because that comparison with Venus confirms it precisely. As I have written over and over again, the mean surface temperature on Earth as indicated in the Standard Atmosphere model is 288K, and that has been unchanged in the model for a century and more–and it is also HIGHER, by a few tenths of a degree, than the currently claimed global mean surface temperature, despite the supposed century of global warming. And my Venus/Earth comparison shows the Standard Atmosphere agreed with the detailed temperature-pressure curve on Venus on one day in 1991, which again shows that between the development of the Standard Atmosphere a century ago and that day in late 1991, there has been no global warming (else the Standard Atmosphere would have become obsolete, and could not match the much later Venus, due to that warming).
The “trends”, or changes, in the global mean temperature records are scientifically worthless. The whole science is built upon incompetence, in both the theories used and in the construction of the global mean temperature. (So I guess you and I can agree that the global mean, AS CALCULATED AND TRACED BY THE “EXPERTS”, is meaningless, and that’s probably what you meant…so never mind.)
Huffman is so dim he calculated Venus/Earth comparisons without including planetary albeoes.
That is really, really, stupid.
PS: Huffman also disputes the existence of tectonic plates. WHy? He is sure he is a genius.
Rotten Appell doesn’t understand HDH’s work
No surprise in that.
His scientific abilities are renowned as being basically non-existent
But at least they have know their statistics. //s//
https://curryja.files.wordpress.com/2014/08/50-cartoon.png
Mindert Eiting wrote:
“For a global mean to be meaningful all regional temperature time series must correlate positively.”
For god’s sakes, learn a little mathematics, would you???
Poor David, the only thing he comprehends is very basic maths. Anything comprehension above junior high level seems to be beyond him,.
Those who claim the science is settled are the ones in denial. Great work!
And keep in mind these are only the papers published within the last year. There are another 100+ papers like this that have been published in the last few years.
Wrong, Kenneth.
The most important parts of the science have been known since Manabe and Wetherald, 1967.
http://www.davidappell.com/EarlyClimateScience.html
So if the most important parts of the science have been “known” since 1967, why is it that climate sensitivity estimates are no narrower now than they were 50 years ago? The ECS range is still 1.5 C to 4.5 C for a CO2 doubling to 600 ppm according to the latest IPCC report, which is the exact same range as it was in 1990 (FAR). Why is there still a factor-of-3 difference between the top and bottom thresholds if the science is so well known that it has been “settled” for 30-50 years?
And why did 114 of 117 CMIP5 models fail to simulate the 1998-2012 “hiatus” in global warming according to the last IPCC report? That’s a 97% model failure rate.
[…] blog of the day is NoTricksZone, with a post on the “Hockey Stick” […]
I do not understand sod’s comment about “fake news” , which is not a phrase he has used until recently, when some lobbyists in Washington started chanting it Far from being fake many of the papers so assiduously collected are peer reviewed and from prestigious sources sch as Nature , GeoPhys Res Letters , Elsevier geophysical journals , American meteorological Soc , etc, exactly the sources that we sceptics are accused of ignoring , but now Sod is doing exactly that.
I can understand him/her /it not commenting in depth because there is a lot of info there to be digested, but to dismiss it so quickly is premature one would have thought.
The comment about randomness is also puzzling because it demonstrates the exact opposite of his/hers/it’s comments. If the results which cast doubt on the global warming meme came from just a local region , say Eurasia or Central America one could dismiss it as not representing a global phenomenon , but to manifest in so many different , and yes , random, places suggests that the current consensus (if it exists) on global warming is coming under serious scrutiny.
sod always dismisses articles appearing here (and elsewhere) if they don’t pander to his beliefs. Complete denial without reading more than the title is likely, and certainly no attempt to read and comprehend the contents.
‘start finishing that primary school!’
Insulting people’s level of education appears to be an up-and-coming insult for closed minds to use world-wide. I’ve seen it from a bunch of know-nothings many times in the past several weeks.
He just wishes he had !!! 🙂
When I had not yet finished my primary school, I worked during holydays in a small factory in my village. There was also a mentally handicapped man employed, who was quite nice as a colleague. One day the director gave us the order to repair a small part of the factory for which we had to make a plank of fifty centimeters. I took a ruler and put the number fifty at the beginning of the plank and made a mark at zero. No no, he said, you make an error, you should put zero at the beginning of the plank and make a mark at fifty. I ignored him and took the saw. He started laughing and screaming that I was the stupidest guy he had ever seen. He did not want to insult me, of course.
So you ended up with a plank negative 50 centimetres long.
Is that right ? 😉
“Insulting people’s level of education appears to be an up-and-coming insult for closed minds to use world-wide. I’ve seen it from a bunch of know-nothings many times in the past several weeks.”
Why not quote all i said and the sentence i was replying to:
““For a global mean to be meaningful all regional temperature time series must correlate positively.”
no. A mean is a mean. It is a mathematical term. Please google it and start finishing that primary school!”
here is my simple challenge to you:
please quote the definition of a mean or give an example of a mean that requires all numbers to increase, if the mean does increase.
Calculating a mean is possible with the stuff you learn at primary school.
if the points you score in the first year were 7 and 9 while in the second year you scored 6 and 12 your mean would increase from 8 to 9, even though one of the scores decreased. This is really basic math.
You are trying to demonstrate you are capable of 5th grade arithmetic?
barely capable.!!
Poor sop, 5th grade, very basic maths, seems to be his limit.
He needs to progress a few years, so he can comprehend when a mean is meaningful, or when a mean is meaningless.
You have a VERY LONG path of basic maths ahead of you, sop !!!
Time to start learning, you poor mathematically illiterate little child-mind.
OT. some COOL vids of snow in Saudi Arabia
https://www.iceagenow.info/camels-standing-snow-several-videos/#more-19496
and
http://www.telegraph.co.uk/news/picturegalleries/worldnews/9793865/Snow-blankets-parts-of-Israel-Syria-and-the-Middle-East.html?frame=2448473
In other news.
http://junkscience.com/2016/12/court-dismisses-michael-mann-defamation-lawsuit-against-national-review/
CHEERS ALL ROUND !!!
Merry Xmas, Mickey Moose 🙂
Whats the redshift of a charging….
MOUSE MOUSE mmoouussee mmoouussee?
http://i.imgur.com/hGtfL23.gif
Here’s a better (more complete) gif of the moose (not mouse, sorry) in my last post.
http://vgif.ru/gifs/143/vgif-ru-18314.gif
Global Warming has warmed up the planet like never before. So much so that it now snows for the first time since 1979 in the Algerian Sahara town Ain Sefra.
https://mic.com/articles/160420/here-s-what-this-sahara-desert-town-looked-like-after-its-first-snow-since-1979
You are unable to distinguish an unusual weather event from climate change. (I’m not surprised.)
Unlike you, to whom everything is “climate change”
Otherwise you wouldn’t rabbit on about the weather in the Arctic etc
We are never surprised by your alarmist idiocy, rotten-one.
And so, so stupid that you can’t see that Dirk is just poking fun at the idiotic AGW meme, where a slight warm patch is “climate change™”, but cooling and snow etc is only ever weather, unless it is also blamed on “climate change™”
DOH.. your appell-pip brain is working even less than usual.
The perfect example of why you are a reality denier of the first order.
PS: When will you be submitting your claims to Nature?
PPS: Afraid of doing so?
PPPS: Find posting only on reality-denying blogs so much easier?
Oooh, name-calling is certainly persuasive in this case, David.
Tell me, when scientists publish their results in peer-reviewed scientific journals, do the results themselves cease to be “reality” as soon as you discover they don’t conform to your beliefs?
Kenneth, you totally misunderstand what peer reviewed papers are.
Even while you are afraid to do so yourself.
Warmunistas place such a heavy emphasis on the importance of peer review, and then when confronted with it, run away. It seems that you are the one cowering in fear.
Appell has always been a COWARD, unable to back up anything he says with anything except crap that he KNOWS is just propaganda pap junk science.
Yeah, it’s obvious, Andy. When he gets scared he PPP’s himself.
You posted three times as of this comment I make,that contains ZERO counterpoints to the blog post.
All you have done is post insults,whine about cherry picks and what the difference is between climate and weather.
You have yet to address the blog post itself,which indicate that you have NOTHING of value for the readers to dwell on.
You are behaving like a troll.
“PPPS: Find posting only on reality-denying blogs so much easier?” – D.A. (DOA?)
Yeah, that’s the ticket. Put it behind a pay wall, and leave the blog field open to activist schmucks like yourself. LOL
BTW How many and where are YOUR warmunist publications, may we ask?
All cherry-picked, individual locales or regions. Very misleading.
No attempt whatsoever to construct the global averages. Why not? (Others have done so.)
“Very misleading.”
No, not at all misleading, unless you have a brain the size of a pea. !
Oh , it you …. brain the size of an Appell pip.
Data from around the world showing the fraudsters he supports are wrong is “cherry picked,” but the hockey stick carefully crafted with bad statistics and a flawed computer program from a few pine trees in an arctic peninsula representative of a world wide phenomenon?
Yeah, he’s definitely got some gray matter “issues.”
Yes, cherry picked — if the data aren’t analyzed in both time and space.
That was the key work done by Mann, Bradley and Hughes.
See here…
https://andymaypetrophysicist.com/a-disgrace-to-the-profession/
Jonathan Jones, Oxford U.
Everyone, that is, except for DOA D.Appell, who remains a blithering idiot.
Curious, David. How many locations did Mann, Bradley, and Hughs (MBH98/99) select trees from so as to “calculate” a temperature reconstruction for the entire Northern Hemisphere?
Wrong! Climate is ONLY local and regional.
To say otherwise is unproven, crass, illogical, nonsense based on little more that a superstition about CO2 and its effects.
Ha ha,Appel does it again.
Ignores over FIFTY published science papers here,showing ZERO hockey stick in them,to favor a long discredited paper showing a deliberately created H.S. based on a dribble of data,some of it from remote areas that are not even close to being representative climate impact of the region.
He also ignores other areas of study from History to Botany to agriculture to architecture to archaeology to personal science and farm journals,that make clear the existence of a profound MWP and the LIA that was much bigger in scale than what Mann allows for in his laughable paper.
Grow up David.
Which 50 papers?
Appell… Pay attention, or forever remain at the very back of the class where you belong.
Sod writes: “You can not contradict claims about global warming by looking at regional data.”
You got that right!
All the results are made in some regions! spot on!
For example the Arctic and Antarctic etcetc.
So what region did not for example have MWP and LIA ?
And can you explain how come the region you refer to can show other trends than the grater development in temperature than seen for example in Arctic/Antarctic ?
Funny how climate models doesnt show some regions avoiding general trend.
Frank Lansner wrote:
“So what region did not for example have MWP and LIA ?”
Answer your own question — plenty of data are available.
Start with PAGES 2k.
So, you are unable to provide any references of any relevance, is that what you are saying ??
Sod writes: “You can not contradict claims about global warming by looking at regional data.”
Ah, so if I put my finger in hot water.. my whole body warms up.. is that the new story ???
“Ah, so if I put my finger in hot water.. my whole body warms up.. is that the new story ???”
no. You got that one totally wrong.
A good example would be: you r pool is in the sun and starting to warm. and start adding heat. But when you stick the thermometer at exactly the right spot (deep down), it wont show that the water has warmed so far. So the water is not warming in the sun?
Yawn.. you are so [-snip]!!!
Pierre, how can I get emails of comments to each and every post?
Without this, it is nearly impossible to keep up with your blog.
For someone interested in the science, it isn’t worth trying.
“For someone interested in the science, it isn’t worth trying.”
Especially your comments.
Continued baseless propaganda pap.
“For someone interested in the science,”
And please, STOP PRETENDING….
You are not the slightest bit interested in real science..
You are ONLY interested in low-end AGW propaganda lies and mis-information.
Your life’s sole pathetic legacy..
So, every year I have had to plow more snow here where I am than the year previous. My question to the global-warming “experts” is, when can I expect my workload to decrease?
In ten years. 🙂
Slightly Off Topic
sot keeps telling us that (un)renewables are economically competitive.
No, snotty, government mandates do NOT constitute a free economy.
“…renewable energy must by law have priority in supplying the grid,…”
http://www.telegraph.co.uk/comment/9559656/Germanys-wind-power-chaos-should-be-a-warning-to-the-UK.html
He’s dumb as a post, and far more useless.
Yep, remove the subsidies and feed-in mandate, and wind/solar would be nothing but a tiny niche non-market.
They CANNOT deliver on schedule or on demand.
“No, snotty, government mandates do NOT constitute a free economy.
“…renewable energy must by law have priority in supplying the grid,…””
sorry, but you are wrong as always. The principle that gives priority to renewables is called “merit order” and it is not specific to renewables.
by the way, the horrible article you linked to is from 2012 and the sky did not fall. Even though Germany massively expanded its use of renewables. The telgraph was wrong, as always.
“…not specific to renewables…” – sod the dim bulb
From your pals at “Clean Technica” we have this…
“The German Law on Priority for Renewable Energy says in Article 8 that electricity from renewable sources needs to be bought with priority, irrespective of price.
That is a very simple order with only two elements. Renewable beats everything else.”
Which is what I wrote, you socialist donkey!
[…] Because of the enormous volume of new papers available that support a skeptical position on anthropogenic climate change alarm, the list of 500 scientific papers with links has been divided into 3 sections, each with its own page (Part 1, Part 2, Part 3). There are 68 graphs included in the volume, most of which are used to demonstrate that “hockey-stick” reconstructions of past temperatures and sea levels relative to today are not supported by available evidence. […]
[…] von Temperaturen und Meeresspiegel in der Vergangenheit im Verhältnis zu heute nicht durch verfügbare Beweise gestützt […]