The sun in December 2016, and a look ahead
By Frank Bosse and Fritz Vahrenholt
(Translated/summarized by P Gosselin)
In December solar activity was rather quiet, with the sunspot number at only 19.5. The sun was spotless over 6 days, and already this month there have been 10 spotless days so far.
In December solar activity was only 35% of what the mean is for this month into a cycle.
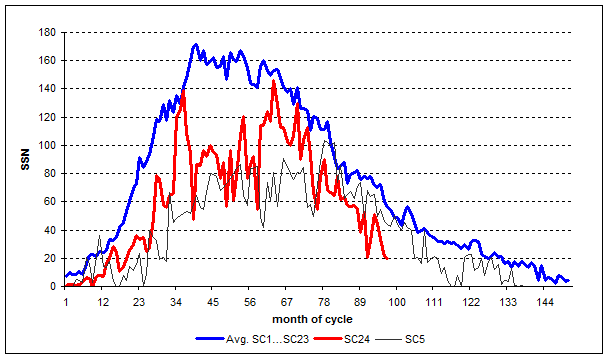
Figure 1: Sunspot activity for solar cycle (SC) 24 (red) compared to the mean cycle (blue) and the comparatively very similarly behaving SC 5 (black) from the year 1798 to 1810.
We are now 97 months into SC 24 since it started in 2008. It is very clear just how much weaker than normal it has become. And it is in fact the third weakest cycle since observations began in 1755.
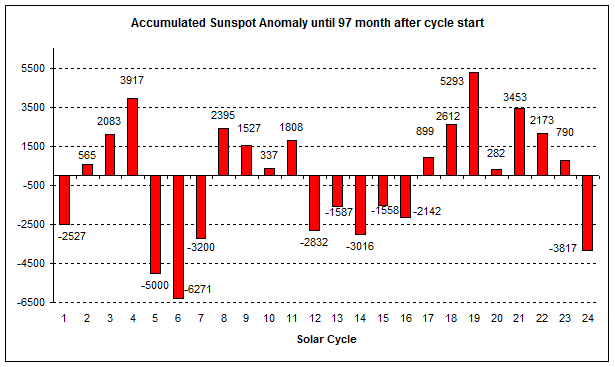
Figure 2: Comparison of all the solar cycles. The chart shows the accumulated sunspot number anomaly from the mean value.
No year of the current cycle reached the mean value:
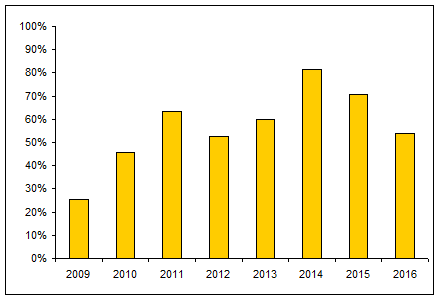
Figure 3: The relative sunspot activity for each year of SC 24.
So far SC 24 has reached only 56% of the average activity of all cycles occurring since 1755.
For estimating what may be in store for SC 25, which is expected to begin around 2020, it is of great interest to look at the polar fields of the sun. The following chart of the arithmetic mean of the fields of both poles:
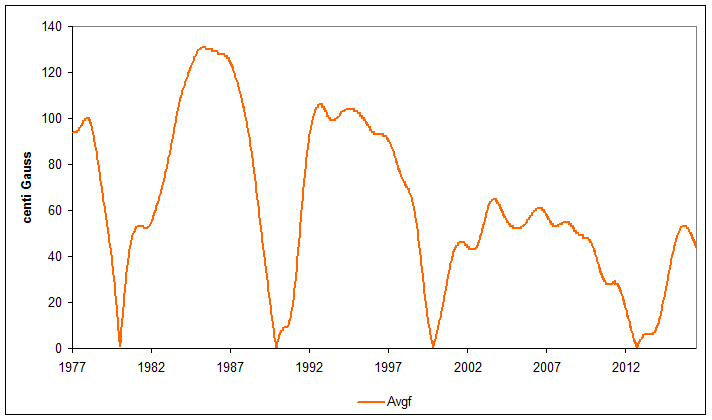
Figure 4: Plot of the solar polar field since 1977.
Here we see that both the polar fields and sunspots reached their maximum value fairly early in the cycle, approximately 3 years after reaching the zero-point and that the decline takes place until the 11th year on average. The current cycle reached its peak at about March 2013. The height of the maximum is a strong indicator of how strong the next cycle will be. From Figure 4 we see it will be about as strong as the current one, possibly a bit weaker.
The current weak activity is no one-time outlier, and also SC 25 will be a weak one. That means that the period after 2005 will be considerably different from the the strong activity period of SC 18-23.
Another observation in relation to the polar fields is interesting: The field strengths of both poles are in fact not completely independent of each other, but asymmetries can occur:
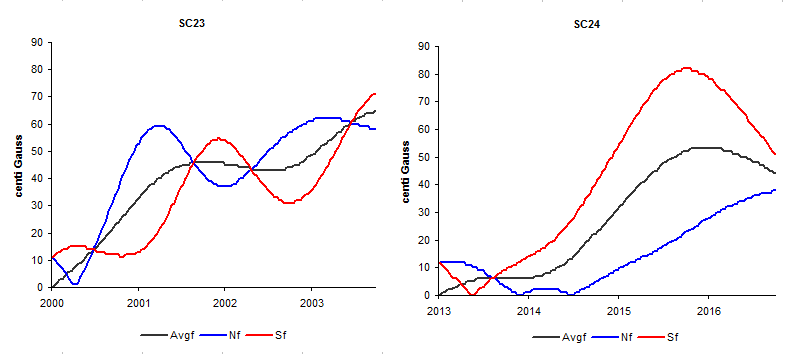
Figure 5 : Comparison of both polar fields. The smoothed field of the northern pole (blue) and the southern pole (red) are shown as values, as is the mean value (black).
In solar cycle 23, there was a switch in solar fields, which is normal. But during the current cycle there has been no switch in strength as the southern pole was the stronger pole over the entire time. This has never happened since satellite observations began in 1977, and means that the fields appear to be quite decoupled.
What does this decoupling mean? Could it be a sign for SC 25? The answer to this question is unknown because the satellite observations began only in 1977.
Yet, recently the results of a new study by Kalevi Mursula et al of the University in Oulu in Finland allow us to look back 100 years. Here the authors looked at the strength of coronal holes in order to get information about the polar fields since 1910. Coronal holes, like solar flares, are sources of plasma discharges from the sun and act to strengthen solar winds, which in turn impact the earth’s magnetic fields. What follows is an example image made by a space craft:
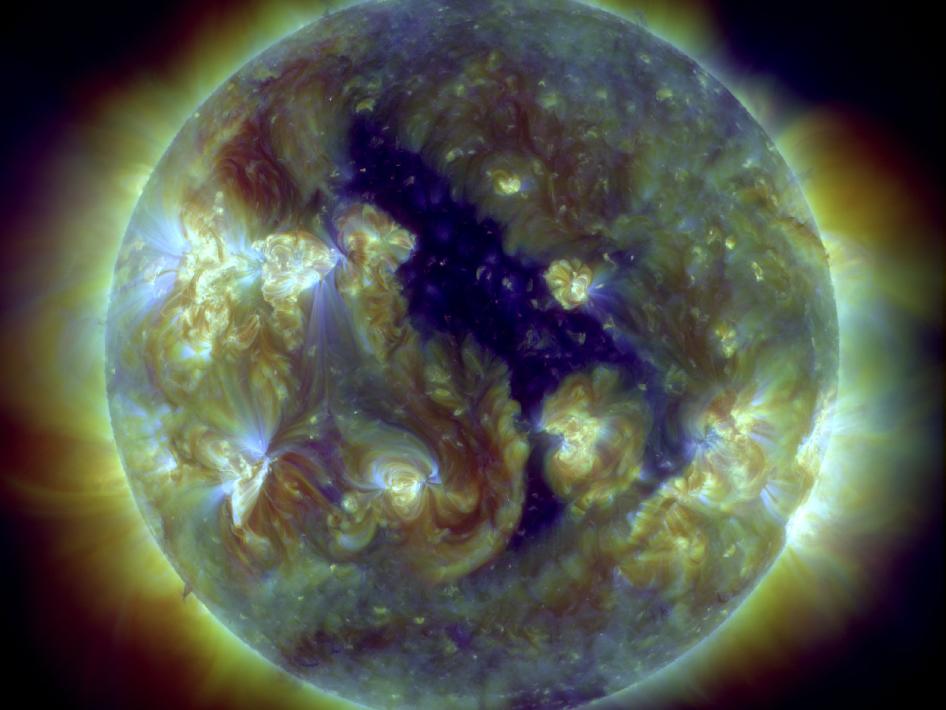
Figure 6: A huge central coronal hole (dark area) on the sun, Source: NASA
Examining archives on polar lights, which are caused by flares and coronal holes, the authors were able to trace back the strengths of the solar polar coronal holes. The result: they were predominant on the downside of the SC 18 and SC 19, with the peak in 1957 – and then followed the most active cycle of the systematic observation record.
The situation was entirely different after the peak of solar cycle 23, starting at about 2002. The authors conclude that both events mark records for the period since 1910 and are at the start and end of the long-term maximum of solar activity (see Figure 2) in the second half of the 20th century. With regards to the polar fields, solar activity shifted up a gear in the 1950s and then shifted down at the end of the century.
This is confirmed by the results of the study.
Stratospheric radiation up 11% over past 2 years
And the sun impacts the earth through its non-activity: The diminishing solar winds means the earth gets hit by more cosmic rays, which leads to opper atmospheric reactions which ultimately lead to the generation of gamma and X-rays — to which we are subjected to a greater extent than at times of a more active sun. We’ve reported frequently on the possible effects of cosmic rays on cloud formation. A comprehensive measurement program has been started to determine which dosage man receives and how much it changes with little solar winds. Here are the first results:

Figure 7: Radiation into the stratosphere during the course of diminishing solar activity, Source.
The solid gain of 11% growth in radiation clearly shows the effect of diminishing solar winds. Moving up into the stratosphere means increasing the dose of radiation by 80 times than that at sea level. A flight at 12,000 meters elevation impacts the the human body 50 times more than being at sea level. Such an increase on the earth’s surface would normally activate a variety of emergency responses. But the effects on the body of course depend on the exposure time. A ten-hour transcontinental flight has the same impact as about 20 days at the earth’s surface.
Therefore over the course of one’s life, over time an infrequent flier is far more effected by the much lower radiation at the surface that he is up in the atmosphere, and so there is no need to panic about flying.
Just how much will the present X-ray and gamma ray radiation rise until the solar minimum is reached? We will keep you up to date on this here as well!


In RSS, December 2016 was 9th December out of 38
(1987 was 3nd warmest after the El Nino 2015 and 2003)
In UAH December was 5th warmest
(1987 was eq2nd with 2003, after 2015)
Actually, the current forecast for cycle 25 is for it to be slightly stronger than cycle 24 but not as strong as cycle 23 but that forecast can change as it is based on only one of several indicators (other indicators won’t come into play until this cycle comes closer to its end).
We were warned!! The CO2 level has gotten so high it’s effecting the sun!! /sarc
All nice and dandy but we still not have the energy value(and in what medium) that arrives from the Sun to Earth. The energy that are blocked by atmosphere/clouds etc etc.
Indeed it is the sun and all it’s energetic output that controls events that move our weather systems and ultimately our controls our climate.
As you point out the sun’s output includes the spectrum of the electromagnetic spectrum and of the energetic particles.
The coronal hole currently on the sun has initialized the Northern Hemisphere cooling (against any expectations of warming), as this hole is the origin of very high energy particles, an enhanced solar wind can damage satellite electronics, warm the upper stratosphere initially, and if fast and dense enough can warm it to such a degree that the effects filter down disrupting the ionosphere, lighting up the aurora, and down further disrupting the jet-stream movement.
The current cold snap over the Northern Hemisphere was initialized by such an event back in early November http://www.cbsnews.com/news/giant-hole-in-the-sun-is-50-earths-wide-will-release-solar-wind/).
Another similar (weaker) event is forecast (by many weather models) for mid-February from recent enhanced solar wind impacts on earths upper atmosphere.
How that pans out we have to wait and see. Hopefully not too much more cooling.
This weather obsessive from gavsweathervids.com shows how the weather models react to the recent solar wind variation on https://www.youtube.com/embed/sy0t8eEk7YI
As Harald Yndestad explains here https://hifast.wordpress.com/2017/01/17/the-planets-have-control-of-solar-variability/
“Modern climate: We have had a modern maximum period (1940-2015) with radiation.
Prognosis: We are entering a period with less radiation, a “colder” sunny, with a calculated at a minimum of Dalton-level of approximately (2040-2065).”
[…] Current Solar Cycle 3rd All-Time Weakest …Next Cycle Likely To Be Weaker! […]
[…] Full post […]
[…] to Top. Current Solar Cycle 3rd All-Time Weakest …Next Cycle Likely To Be Weaker! The sun in December 2016, and a look ahead By Frank Bosse and Fritz Vahrenholt […]