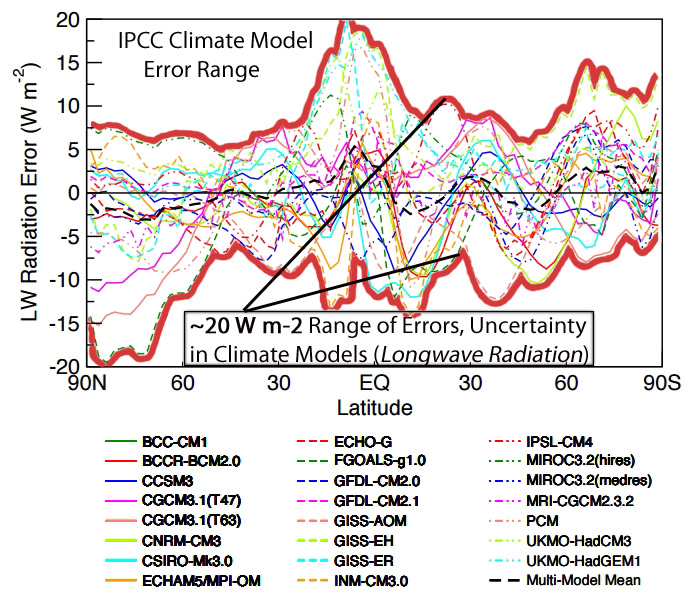
Climate Model Errors = 20 W m-2
CO2 Climate Forcing = 0.2 W m-2
Scott Pruitt, the new head of the U.S. Environmental Protection Agency, has recently been characterized as a climate science “denialist” by world news organizations. A UK Guardian headline, for example, has claimed that “EPA head Scott Pruitt denies that carbon dioxide causes global warming“.
The “denialist” characterization stems from an interview with CNBC’s Joe Kernen in which Pruitt was asked whether he believes that CO2 has been proven to be the climate’s “control knob”. Pruitt replied that “we don’t know that yet” and that “there’s tremendous disagreement about the degree of impact.” But he also said, no, he doesn’t think CO2 is a primary contributor to climate change. Apparently that is all it takes to unleash the climate “denialist” name-calling.
Scott Pruit: “No. I think that measuring with precision human activity on the climate is something very challenging to do, and there’s tremendous disagreement about the degree of impact. So no, I would not agree that it’s a primary contributor to the global warming that we see. But we don’t know that yet. … We need to continue the debate and continue the review and the analysis.”
In a Washington Post analysis of Pruitt’s comments entitled “EPA Chief’s Climate Change Denial Easily Refuted…”, the host’s reply to Pruitt’s last statement about the need to continue debating the degree of human impact was included:
“That’s the whole point of science. You keep asking questions.”
Responding to this rather fundamental point, Washington Post political journalist Philip Bump seemingly agreed with the need to keep questioning and debating the science (since that is indeed the “whole point of science”). But then he immediately contradicted himself.
“Well, sure. But the point of science is also to accept the answers to those questions once determined. And in the scientific community, the answer to the question of the link between greenhouse gases and warming has been determined.”
So apparently because it “has been determined” that CO2 causes warming or cooling when increased or decreased, therefore we should not question the degree to which the climate models accurately record the effect of increasing or decreasing CO2, or how much warming or cooling is caused by CO2 fluctuations relative to other climate-forcing factors.
And why should we refrain from asking questions about the relative influence of CO2 forcing on the climate? Because those questions have not been determined…or answered. Not even close. After all, the uncertainty and error margins associated with modeling the radiative energy changes in the Earth system are 10 to 100 times greater than the entirety of the forcing attributed to CO2 changes.
1. CO2 Radiative Forcing Effect Just 0.2 W m-2 For 2000-2010
As the Intergovernmental Panel on Climate Change (IPCC) has indicated, “global climate is determined by the radiation balance of the planet.” If the balance in the radiative energy budget (incoming vs. outgoing energy) tips positive (as expressed in Watts per square meter, or W m-2), warming occurs. If it dips negative, cooling occurs. The IPCC presumes that positive energy balances have been ongoing for decades, driven almost exclusively by the increase in anthropogenic CO2 emissions.
According to climate models, the total climate forcing effect of the roughly 120 parts per million (ppm) increase in atmospheric CO2 during the ~165 years since 1750 is 1.8 W m-2.
As assessed in a 2015 paper published in the journal Nature, the CO2 concentration increased by 22 ppm during the first 10 years of the 21st century. The radiative forcing (warming) effect of this 22 ppm CO2 increase was modeled to be 0.2 W m-2. So of the 1.8 W m-2 of total radiative forcing since 1750, 0.2 W m-2 was added during the first decade of this century.
Feldman et al., 2015 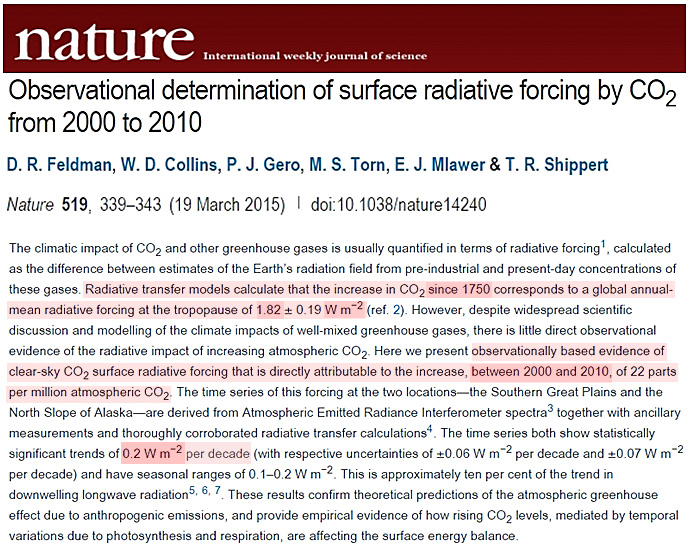
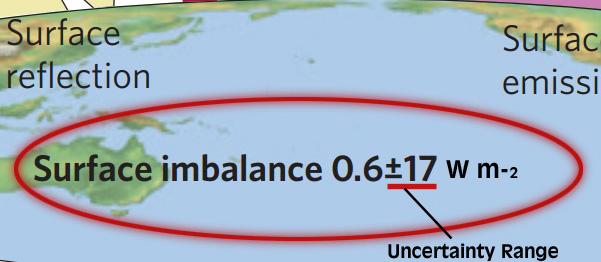
2. The Radiative Energy Imbalance For 2000-’10 Was 0.6 W m-2
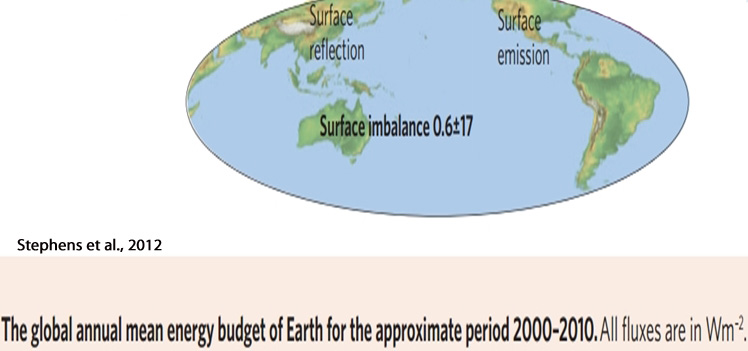
In a 2012 Nature Geoscience paper entitled “An update on Earth’s energy balance in light of the latest global observations” by Stephens et al. (2012), the radiative energy imbalance for the 2000-2010 decade was determined to be positive, as expected. Interestingly, though, the positive energy balance of 0.6 W m-2 was 3 times larger than the forcing value (0.2 W m-2) attributed to the CO2 increase during the same period.
Stephens et al., 2012
“The current revised depiction of the global annual mean energy balance for the decade 2000–2010 is provided … For the decade considered [2000-2010], the average imbalance is 0.6 Wm–2 when these TOA fluxes are constrained to the best estimate ocean heat content (OHC) observations since 2005.”
3. 67% (0.4 W m-2) Of The 2000-’10 Energy Increase Not From CO2
If the imbalance in the energy budget was 0.6 W m-2 during 2000-2010, and the modeled CO2 radiative forcing estimate was 0.2 W m-2 during the same period, that means that there was a positive forcing of 0.4 W m-2 that was not due to the increase in CO2 concentration. What this indicates is that the IPCC’s conclusion that all or nearly all of recent global warming is due to the increase in anthropogenic CO2 emissions is not supported by the surface energy imbalance estimates. Two-thirds of climate forcing must be due to some unknown mechanism or mechanisms that the IPCC has somehow failed to identify in etiological analyses. And if only 33% of recent climate forcing is anthropogenic, and 67% cannot be accounted for, where does the certainty that humans are driving climate change come from?
4. Energy Change Uncertainty 10-100 Times Larger Than CO2 Forcing
Speaking of certainty — or, more appropriately, uncertainty — in climate forcing or energy imbalance values, Stephens and colleagues emphasize the requisite uncertainty in the estimates of the energy imbalance for 2000-2010: an enormous ±17 W m-2.
A 17 W m-2 uncertainty range in the energy balance estimate (0.6 W m-2) means that the actual energy balance could be anywhere from -16.4 W m-2 to +17.6 W m-2. This range of uncertainty effectively renders the 0.2 W m-2 CO2 forcing estimate meaningless, as the uncertainty in the volume of energy change during 2000-2010 is 85 times greater than the forcing attributed to CO2 for the same period.
Stephens et al., 2012
“This small imbalance [0.6 W m-2] is over two orders of magnitude [100 times] smaller than the individual components that define it and smaller than the error of each individual flux.”
“The net energy balance is the sum of individual fluxes. The current uncertainty in this net surface energy balance is large, and amounts to approximately 17 Wm–2. This uncertainty is an order of magnitude [10 times] larger than the changes to the net surface fluxes associated with increasing greenhouse gases in the atmosphere.”
“The quoted value of the sensible heat flux is a combination of the land and ocean sensible heat fluxes with a simple weighting based on land/ocean surface area. The flux value of 24 Wm–2 is also larger than previously assumed and remains highly uncertain, as exemplified by the range of 14–34 Wm–2 that results from different land flux estimates. No definitive measure of the uncertainty of this flux exists and the uncertainty range given merely reflects a judgement on where the value most likely lies.”
Even the IPCC acknowledges that the uncertainty in heat flux estimates reaches up to 20 W m-2, and that this uncertainty dwarfs the less than 2 W m-2 of total radiative forcing attributed to anthropogenic CO2 emissions during the last few centuries.
IPCC AR4 (2007)
“Unfortunately, the total surface heat and water fluxes are not well observed. Normally, they are inferred from observations of other fields, such as surface temperature and winds. Consequently, the uncertainty in the observational estimate is large – of the order of tens of watts per square metre [20 W m-2] for the heat flux, even in the zonal mean.”
IPCC AR5 (2013)
“The overall uncertainty of the annually averaged global ocean mean for each term is expected to be in the range 10 to 20%. In the case of the latent heat flux term, this corresponds to an uncertainty of up to 20 W m–2. In comparison, changes in global mean values of individual heat flux components expected as a result of anthropogenic climate change since 1900 are at the level of <2 W m–2 (Pierce et al., 2006).”
Frank, 2008
“It turns out that uncertainties in the energetic responses of Earth climate systems are more than 10 times larger than the entire energetic effect of increased CO2.”
5. IPCC Hides Uncertainty, Errors In Radiative Energy Change
Advocates of the position that CO2 is the climate’s “control knob” would like to divert attention away from the uncertainties and errors in climate modeling, of course. Likewise, the IPCC has notoriously buried data that might cast doubt on the “consensus” position (which states that most climate changes have been driven by anthropogenic CO2 emissions since the mid-20th century).
To find the uncertainty and error ranges in the climate model estimates of radiative forcing, one must deliberately set out to locate the esoteric “Supplemental Material” documents from each report. The IPCC would not dare publish estimates of massive climate modeling errors and uncertainty in locations where they are most likely to be viewed.
Frank, 2008
“One must go into Chapter 8 and especially Ch 8 Supplementary Material in the recently released IPCC AR4 to find GCM [General Circulation Model] errors graphically displayed in W m-2. Such forthright displays [of error/uncertainty, as shown in the graphs below] do not appear in the SPM [Summary for Policy Makers] or in the Technical Summary; i.e., where public bodies are more likely to see them.“
Supplementary Material from Chapter 8, IPCC AR4
“Figure S8.5 shows that GCM errors in ‘mean shortwave radiation reflected to space’ range across 25 W m-2.”
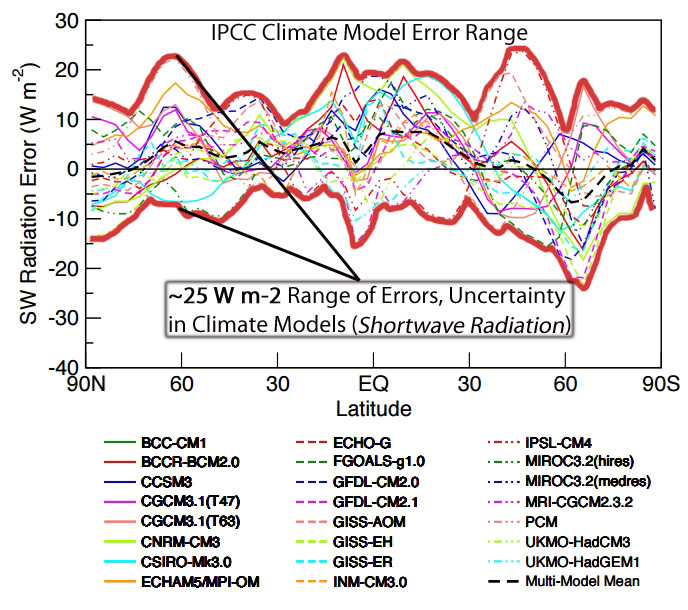
“The errors in outgoing longwave radiation, Figure S8.7, are similarly large [~20 W m-2]…”
6. ‘From Where Comes The Certainty Of A Large CO2 Impact On Climate?’
So if the models are so hopelessly riddled with errors and uncertainty that an anthropogenic radiative forcing signal cannot be distinguished from noise, or if the total magnitude of the warming attributed to humans is one-tenth to one-hundredth of the error or uncertainty ranges, why are those who dare question the degree to which humans affect the Earth’s climate branded as “deniers” of science?
Exactly what is the truth that climate “deniers” are actually denying?


[…] Uncertainties, Errors In Radiative Forcing Estimates 10 – 100 Times Larger Than Entire Radiative E…. Scott Pruitt, the new head of the U.S. Environmental Protection Agency, has recently been characterized as a climate science “denialist” by world news organizations. A UK Guardian headline, for example, has claimed that “EPA head Scott Pruitt denies that carbon dioxide causes global warming“. The “denialist” characterization stems from an interview with CNBC’s Joe Kernen in which Pruitt was asked whether he believes that CO2 has been proven to be the climate’s “control knob”. […]
If anyone wants to see an advertisement for a curve fitting exercise just read AR5 chapter 2 starting on page 181 (2.3.1) and read through to page 184. This deals with global radiation budgets. The uncertainties are off the scale. May as well be throwing darts. A total farce.
http://www.climatechange2013.org/images/report/WG1AR5_Chapter02_FINAL.pdf
Imagine you have a sine curve from 0 to 2*PI. The average is 0, correct? What is 1 sigma for this curve? Sqrt(0.5). 2 sigma? Sqrt(2) or 1.4142.
Now you add a line y=x/10 to the sine curve and you have a trend going on … detrend the curve and you get your sine curve as the anomalies with a bigger uncertainty as the trend and yet you can’t deny that there is a trend because you just added it to the sine curve.
A total farce?
Yep, your comments are a total farce, seb.
SebastianH: “yet you can’t deny that there is a trend”
Whether or not a trend exists isn’t the issue here. What factors contribute to that trend, how much they contribute, and how does one distinguish between a contribution from forcing and a contribution from stochastic variability when measuring the latter is riddled with uncertainty and errors…is the issue here.
Indeed. But the conclusion that big uncertainties make a trend disappear or counteract a trend is just wrong. It’s also wrong to view the uncertainty of 17 Wm² in Stephens 2012 as error since as the author writes himself (and you didn’t quote):
It’s like using an uncalibrated thermometer … you can see that it’s warmer or colder than before, you just don’t know exactly by how many degrees.
I am also skeptic about your conclusion that 67% of the 0.6 W/m² are not caused by humans. There are lots of feedback mechanisms in the atmosphere and lag is involved too. Those additional 0.4 could very well be feedbacks and I wouldn’t rule out increase of CO2 concentration as root cause.
Again you are stuck on the idea of a “trend” disappearing or being counteracted. That’s not what this article is about. It’s about detection. It’s about distinguishing between a forcing and a random variability. It’s about how uncertainties in defining the Earth’s energy budget — which ranged between a negative imbalance of -16.4 W m-2 to a positive imbalance of +17.6 W m-2 during 2000-2010 — are so large that the contending that an anthropogenic signal of 0.2 W m-2 could be detected somewhere amidst the 34 W m-2 span is beyond guesswork. It’s wishful thinking.
During 2000-2010, satellite observations have atmospheric temperatures cooling slightly…
http://www.woodfortrees.org/plot/rss/from:2000/to:2010/plot/rss/from:2000/to:2010/trend
Obviously, this is not consistent with the positive energy imbalance of 0.6 W m-2 for the same period. Nor is it consistent with the alleged 0.2 W m-2 forcing from CO2, or the other 0.4 W m-2 forcing from some other mechanism that has not been identified.
Additionally, a newer paper than Feldman et al. (2015), Song et al. (2016), has the greenhouse effect for CO2 experiencing a hiatus, or no positive forcing at all during the years 1992-2014, as shown here:
—
https://notrickszone.com/wp-content/uploads/2016/09/NTZ-Greenhouse-Effect-Hiatus.jpg
—
Song, Wang & Tang, 2016
“In the 1980s, a significant increasing Gaa [atmospheric greenhouse effect] tendency exists with a linear estimate of 0.19 W m−2 yr−1. However, this uprising trend pauses starting in circa 1992, when Gaa [atmospheric greenhouse effect] begins to slightly decrease at a rate of −0.01 W m−2 yr−1. This statistically non-significant trend indicates that the enhancing global atmospheric greenhouse effect is slowed down. Moreover, the atmospheric greenhouse effect hiatus can be found over both sea and land.”
“The oceanic Gaa [atmospheric greenhouse effect] exhibits a notable increasing trend with a rate of 0.21 W m−2 yr−1 in 1979–1991, whereas its rate of change (−0.04 W m−2 yr−1) during 1992–2014 is not statistically significant.”
—
I assume you’d prefer to ignore Song et al., 2016, as you’d like to at least have some positive CO2 effect from the gigantic increase in CO2 emissions rates since the early 1990s.
The paper specifically mentions OHC and the correlation of those net flux measurements with this data. See quote from that paper in my previous comment.
And as explained with the sine curve example identifying a (small) trend is no problem even if the standard deviation is big.
Comment in spam? Did I use another trigger word?
Most of your comments are just AGW spam.
Its all you have.
Certainly absolutely nothing to back up the very basis of your anti-human AGW religion.
But just keep “pretending”.. it obviously helps you get through the day .
You have been asked several times to stop posting these “Where did my comment go?” worries, SebastianH. And yet you continue to do so again and again and again. I have no idea what “trigger words” put some comments in queue. You are no more entitled to have your posts go straight to the thread than anyone else who happens to trigger the WordPress filter. Please stop posting these comments.
Kenneth R.,
Thank you for this. Well done and useful information.
“… what is the IPCC talking about?” [Pat Frank]
As you show in this post and previous ones, the IPPC makes things up.
They are a mouthpiece of the UN, and created to help justify the goals of the UN. The leaders believe the wealth of the better-off nations is unjustified, and therefore needs to be redistributed to the less well-off. The UN will handle the money.
What amuses me is that warmists hang onto SURFACE temperature data so much,generally ignoring the Satellite temperature data. Satellite temperature data is far more relevant to the AGW conjecture, since it is about the ATMOSPHERE that matters most.Where CO2 is supposed to do its magic in,the same region Satellite covers.
Since Satellite temperature data fails to support the AGW conjecture,with NO “hotspot” being visible,that the IPCC said it would be there. It is a failure that warmists keep ignoring,which is why they try hard to play down the Satellite data,saying it is bad and so on.
Yet these same goofballs say Surface temperature data is GOOD,but deliberately ignore the many known holes in the coverage,the corrupted siting of instruments and UHI bias. It is clear to me that warmists are irrational and stupid, to be keeping this whole CO2 magic molecule scam going on and on,long past its credibility.
Even NASA agrees climate models lack the precision to be useful.
http://isccp.giss.nasa.gov/role.html#COMP_MODS
“A doubling in atmospheric carbon dioxide (CO2), predicted to take place in the next 50 to 100 years, is expected to change the radiation balance at the surface by only about 2 percent. If a 2 percent change is that important, then a climate model to be useful must be accurate to something like 0.25%. Thus today’s models must be improved by about a hundredfold in accuracy, a very challenging task.”
Two problems:
1. Claim: Uncertainty makes small trends irrelevant. I will give you an Example.
Funny, i play the lottery and our house could burn down anytime.
I could still give you a pretty solid estimate of my earnings next year (or the trend of it), even though lottery wins and huge fires could easily add a +-1000000 error range.
2. Claim: huge uncertainty counteracts the trend.
This is a totally garbage idea, that i read between the lines here all the time.
Let us assume for a second, that the article got its numbers about right. The extra is less than 1 watt m^-2 per decade, while the error is +-20 watt.
the rising CO2 would still add up to a pretty solid number AND the error range could of course fall on the positive side, so the numbers would ADD UP to 25 to 30 watt.
Poor sob.. fantasy imaginings yet again
There is absolutely no proof that CO2 causes any warming a convective atmosphere (as seb keeps showing us all)
Convection through the gravity/pressure gradient immediately compensates for any warming.
There is NO CO2 warming signature in either satellite data set.
There is NO CO2 warming signal anywhere.
IT JUST ISN’T HAPPENING.
End of Story.
You obviously have told this yourself often enough for it to become true in your fantasy physics world … and by using capslock you can make sure that everyone else understands that you really mean it this time.
I have asked this before, but are you in any way related to Donald Trump? Or are you his Twitter ghostwriter?
You have CONSTANTLY FAILED to provide one iota of proof that CO2 causes warming in a convective atmosphere. NONE.. You remain TOTALLY EMPTY. !!!
It is you that lives in a fantasy world, bereft of all real data or physical comprehension, you poor little brain-washed AGW shill/troll.
Sod, you are not making sense at all.
You have been shown in various ways that the range of uncertainty is way too big, to allow for CO2 to have that much impact on the climate. You have been given sources that show this over and over,shown what the IPCC says about it too.
You need to make a cogent case against what Kenneth has posted. Otherwise you are going nowhere with your unsupported babble.
“You need to make a cogent case ”
Neither sob or seb have a clue what that means
Neither can produce even one paper that shows CO2 causes warming in a convective atmosphere.
Guess what guys…..
NO SUCH PAPER EXISTS, even after 30+ year of this BS !!
Its all based on fantasy!
Indeed, it could be a way larger impact! OMG!
10 times NOTHING is still NOTHING, seb
And that’s all you have ever been able to produce to prove that CO2 causes warming in a convective atmosphere.
You can LIE to yourself, its all you have, but anyone can see you are totally EMPTY. !!
Sebastian, don’t you bother to read the post?
It makes clear that CO2 has so little warm forcing impact against the internal uncertainty range of the components that are found in it:
“This small imbalance [0.6 W m-2] is over two orders of magnitude [100 times] smaller than the individual components that define it and smaller than the error of each individual flux.”
“The net energy balance is the sum of individual fluxes. The current uncertainty in this net surface energy balance is large, and amounts to approximately 17 Wm–2. This uncertainty is an order of magnitude [10 times] larger than the changes to the net surface fluxes associated with increasing greenhouse gases in the atmosphere.”
“The quoted value of the sensible heat flux is a combination of the land and ocean sensible heat fluxes with a simple weighting based on land/ocean surface area. The flux value of 24 Wm–2 is also larger than previously assumed and remains highly uncertain, as exemplified by the range of 14–34 Wm–2 that results from different land flux estimates. No definitive measure of the uncertainty of this flux exists and the uncertainty range given merely reflects a judgement on where the value most likely lies.”
The IPCC says:
““The overall uncertainty of the annually averaged global ocean mean for each term is expected to be in the range 10 to 20%. In the case of the latent heat flux term, this corresponds to an uncertainty of up to 20 W m–2. In comparison, changes in global mean values of individual heat flux components expected as a result of anthropogenic climate change since 1900 are at the level of <2 W m–2 (Pierce et al., 2006).”
You can't properly detect the CO2 warm forcing impact,when it is swamped by the assigned amount of uncertainty range known in the models.
You appear to have no credible argument against it Seb.
And yet (from one of the papers):
How does the small positive unbalance compare with the warming of the Globe. Some say that the surface temperature now is 1.5K hotter than at 1900, so according to Stefan Boltzmann it must radiate at least 5W/m2 more than before.
Does that mean that the Earth receives 4.5W/m2 more than before or does it radiate 4.5W/m2 less than before.
Or has the internal up and down radiation just increased with 5W/m2 without changing the TOA balance.
Anyway these balances are more like an accountaint balance sheet than real science.
That one.
Pruitt is attacked for his utterly false claims about CO2:
““This is a conclusion based on the comprehensive assessment of scientific evidence. It is based on multiple independent lines of evidence that have been affirmed by thousands of independent scientists and numerous scientific institutions around the world,” the American Meteorological Society wrote in a letter to Pruitt on Monday.
“We are not familiar with any scientific institution with relevant subject matter expertise that has reached a different conclusion.””
http://nypost.com/2017/03/13/meteorologists-debunk-epa-chiefs-climate-change-denial/
But hey, he has his own alternative facts…
Scientific institutions (actually the heads of the institutions/societies) giving statements on “consensus” views is pure politics and a disgrace in terms of real science. Judith Curry has a scientific take on this media frenzy about Pruitt’s statements and the scientific societies AGW-politics:
https://judithcurry.com/2017/03/11/scott-pruitts-statement-on-climate-change/
I dispute the notion of radiative balance. The Earth absorbs large amounts of solar energy and binds it to the planet in the molecular bonds of organic compounds. Therefore the radiation received from the Sun is always greater than the radiation returned to space. The process that causes this retention of energy is called photosynthesis. Every plant on the planet takes in solar energy and uses it to create sugars from carbon dioxide and water, which are used to create even more complex carbon compounds that constitute the substance of the plants. Even after death and putrefaction of the plants a substantial amount of this energy is still retained in organic matter which forms topsoils and peat bogs etc.This is why relics of the past are always buried below the surface.
You’re not alone. Check out this (unanswered) question from physicists from the American Physical Society’s framing document:
http://www.aps.org/policy/statements/upload/climate-review-framing.pdf
Reliable climate hindcasts and projections therefore require that the state of the oceans (current, temperature, salinity …) be known well on long timescales. Yet, as illustrated in WG1 AR5 Figure 3.A.2, good observational coverage has been available for less than a decade. With uncertainty in ocean data being ten times larger than the total magnitude of the warming attributed to anthropogenic sources, and combined with the IPCC’s conclusion than it has less than 10% confidence that it can separate long-term trends from regular variability, why is it reasonable to conclude that increases in GMST are attributable to radiative forcing rather than to ocean variability?
If that were the case over long periods of time, then Earth would simply warm up until both fluxes are equal again.
OMG, poor seb thinks that the Sun’s energy isn’t used on the Earth,s surface.
Dumb, dumber, dumbest… then many more downward steps to find seb.
I am sure you think filling you car with gasoline and using it to drive somewhere is somehow uses up the energy and it magically vanishes? All it does is increase the entropy, there is no using up energy in this universe.
And seb reinforces his dumbness.
Well done seb. !!
Hey Seb.
How many times can you burn your gasoline in your merc?
Seb H,
Is our sun a finite, or infinite source of energy?
Can you run your car on entropy?
Since seb likes little analogies..
If you move 2 million tons of sand from point A to point B one day..
and the next day move that 2 million tons of sand back from point B to point A.
How has the entropy changed?
Where has the energy gone that was used in that movement of 4 million tons of sand?
Are you really questioning thermodynamics and conservation of energy? That explains a lot …
Certainly questioning your practical common sense Seb.
Rob, please explain how you think energy is being “used up” when doing work. It just gets converted into other forms increasing the entropy. If your “practical common sense” doesn’t allow that conclusion then you are living in a fantasy physics world …
I notice that you are TOTALLY UNABLE to answer my question.. YET AGAIN !
Keep going seb.. it is hilariously funny !! 🙂
Have you ever answered a question, And?
SebH says
“I am sure you think filling you car with gasoline and using it to drive somewhere is somehow uses up the energy and it magically vanishes? All it does is increase the entropy, there is no using up energy in this universe.”
and
“Rob, please explain how you think energy is being “used up” when doing work. It just gets converted into other forms increasing the entropy. If your “practical common sense” doesn’t allow that conclusion then you are living in a fantasy physics world …”
SebH, I live in the real world, one where when your fuel tank is empty, it must be filled again before your engine can do any more work. Entropy is irrelevant, it can not make more petrol.
When the energy in our sun is all “consumed” who will be bothered whether entropy is increased.
Once again Seb, show us how you can extract energy from fuel more than once.
SebH.
Could you give me a brief description of the universe at the point maximum entropy is reached?
Hi Seb.
When you release the energy stored in your tank of fuel, firstly into heat, do you think you could somehow recapture its new form and find another way to use it. If you could and experience zero losses you would have a perpetual source, wouldn’t you?
Deflection and cowardice, avoiding answering questions yet again seb.
Also avoiding presenting papers that show that CO2 causes warming in a convective atmosphere.
Poor little avoidance prone, seb !!
I’ll ask seb the question again, because it will be amusing to watch him weaving and ducking and sidetracking and blustering as always
If you move 2 million tons of sand from point A to point B one day.. and the next day move that 2 million tons of sand back from point B to point A.
How has the entropy changed?
Where has the energy gone that was used in that movement of 4 million tons of sand?
Waiting, waiting ! 🙂
That was the original statement. Energy isn’t “used” on Earth, it is just converted into another form resulting in increased entropy. This has nothing to do with gasoline cars, but in those cars energy is also converted into a different form. That’s all that is happening.
You could imagine a lonely planet with no sun and a temperature close to 0 K. If a sun suddenly appears then energy is “used” on the planet to warm it up. When equilibrium is achieved the planet will emit as much energy as it receives. Simple physics …
You didn’t get the part with the chemical bonds, just admit it.
“Uncertainties, Errors In Radiative Forcing Estimates 10 – 100 Times Larger Than Entire Radiative Effect Of Increasing CO2”
Climate Unbeliever!
Up with the subsidies! Crush capitalism! Onwards!
We should really put a billion or so into the creation of the New Man who will be uncapable of doubting computer models. That would allow much better control of society.
Wait. We already have two of them here. The prototypes, they are around us!
Denier! Unbeliever! And ugly, ugly!
It gets a lot worse than that:
Climate “Science” on Trial; Temperature Records Don’t Support NASA GISS
https://co2islife.wordpress.com/2017/03/12/climate-science-on-trial-temperature-records-dont-support-nasa-giss/
Climate “Science” on Trial; How Does Ice Melt In Sub-Zero Temperatures?
https://co2islife.wordpress.com/2017/03/05/climate-science-on-trial-how-does-ice-melt-in-sub-zero-temperatures/
Climate “Science” on Trial; The Criminal Case Against the Alarmists
https://co2islife.wordpress.com/2017/02/21/climate-science-on-trial-the-criminal-case-against-the-alarmists/
OT, in New York state near Rochester.. pretty cool, hey !!
http://media.breitbart.com/media/2017/03/ice-house-640×480.jpg
Breitbart isn’t cool at all …
Nope .. Breitbart is HOT.
and getting hotter as people wake up to REALITY.
Maybe in 20-30 years, poor seb’s gullible child-mind will also grow up enough to wake up to reality.
Nobody will bother holding their breath waiting for that very unlikely event to happen, that is for sure.
I’m a long time reader and first time poster and I’m only posting because I have a question on the topic of CO2. This blog has a list of 60 scholarly papers showing CO2 to have low or no climate forcing. The publishing dates on these papers can go back decades, but many are recent. Are there this many papers out there showing the opposite, that CO2 has a large forcing effect? Still, with this many papers showing low CO2 forcing, why is it so many people still focus on CO2 like they do? I think this is a legitimate question, at least in my mind. Thanks!
Definitely a legitimate question. Climate sensitivity to CO2 changes is, after all, the heart of the issue here.
As for the volume of papers suggesting a high climate sensitivity for CO2 doubling (generally, above 2.0 C is considered “high”), there were 18 papers referenced by the IPCC in their last report (2013), and another 15 referenced in the 2007 report. Of the 18 from 2013, 12 had equilibrium climate sensitivity (ECS) estimates that extended to 1.5 C or below in their ranges, including Lindzen and Choi (2011), which has an ECS value of 0.7 C for CO2 upon reaching 560 ppm. Here’s the graph of 18 papers (some are repeated) from the 2013 report:
http://www.climatedialogue.org/wp-content/uploads/2014/05/Lewis-fig-1.jpg
So that may give you an idea about how many higher-end sensitivity estimates there are. The IPCC is obviously going to favor the higher estimates, so more than likely there are not many more than that out there that were published since the 2001 report.
On the other hand, that list of 60 low climate sensitivity estimates on that NoTricksZone compilation you referenced were all under 1.0 C. Here are over 20 more with ECS or TCR values between 1 and 2 degrees C, allowing the “low” estimates to reach into the 80s. Hopefully the links below still work. I haven’t updated them since 2014.
http://www.nature.com/ngeo/journal/v6/n6/full/ngeo1836.html +2.0 C (17 scientists, 14 of them IPCC Lead Authors)
http://link.springer.com/article/10.1007%2Fs00382-012-1375-3?LI=true +2.0 C
http://folk.uio.no/gunnarmy/paper/aldrin_env_2012.pdf +2.0 C
http://www.klimatupplysningen.se/wp-content/uploads/2014/01/Bengtsson-Tellus.pdf +2.0 C
http://www.sciencedirect.com/science/article/pii/S0304380014000404 +1.99 C
http://link.springer.com/article/10.1007%2Fs00382-013-1770-4 +1.98 C (median)
http://www.int-res.com/articles/cr2003/23/c023p001.pdf +1.9 C
http://www.earth-syst-dynam-discuss.net/4/785/2013/esdd-4-785-2013.html +1.8 C
http://www.iac.ethz.ch/doc/publications/Chylek-Lohmann-GRL2008-comment.pdf +1.8 C
http://www.earth-syst-dynam.net/5/139/2014/esd-5-139-2014.html +1.8 C
http://file.scirp.org/Html/24283.html +1.7 C
http://link.springer.com/article/10.1007/s00382-014-2342-y +1.64 C
http://www.princeton.edu/~gkv/papers/Padilla_etal11.pdf +1.6 C (TCR)
http://www.earth-syst-dynam-discuss.net/5/529/2014/esdd-5-529-2014.html +1.6 C (TCR)
http://onlinelibrary.wiley.com/doi/10.1029/2011GL050226/abstract +1.55 C (TCR)
http://journals.ametsoc.org/doi/abs/10.1175/JCLI-D-12-00473.1 +1.6 C
http://people.duke.edu/~ns2002/pdf/EARTH_1890.pdf +1.5 C
http://arxiv.org/pdf/1307.3706.pdf +1.35 C
http://link.springer.com/article/10.1007/s13143-014-0011-z +1.3 C
http://www.clim-past-discuss.net/8/4923/2012/cpd-8-4923-2012.pdf +1.1 C
http://www.ecd.bnl.gov/steve/pubs/HeatCapacity.pdf +1.1 C
http://www.pas.rochester.edu/~douglass/papers/published_E&E%20douglass_christy.pdf +1.1 C
Thanks Richard! I find it odd that so many studies exist showing ECS/TSR values to be low to nonexistent, yet a certain portion of scientists and certainly the mainstream media patently ignore them all. Additionally, it seems like we do a poor job of highlighting this long list of studies showing CO2 to be as far away from the temperature “control knob” as it apparently is. Visit most mainstream media sites and they’re screaming in rage about how President Trump is going to defund the Paris Agreement, which is all about controlling and decreasing CO2. There seems to be enough evidence from the plethora of studies showing how innocuous CO2 is that we have enough doubt/skepticism to defund the Paris Agreement without a twinge of guilt. We need to do a much better PR job in highlighting these studies and push back against the people screaming that we need to decrease our CO2 “polution”.
“Are there this many papers out there showing the opposite, that CO2 has a large forcing effect?
Still, with this many papers showing low CO2 forcing, why is it so many people still focus on CO2 like they do?
I think this is a legitimate question, at least in my mind. Thanks!”
I will answer from the last question up.
this is a legitimate question. As you have been supplied with fake news here, it is no surprise that you are wondering about this kind of things.
Scientists focus on CO2, because the effect is real. It can be directly measured, but it is complicated to model the full effect on the full globe. This is the tiny space for “doubt”, which is totally abused by sceptics.
There are of course much more papers which show a higher climate effect for CO2. the factor would be in the thousands, as you also have to count the papers that implicitly accept the higher forcings.
This is a good example to understand the effect: You could easily find more new papers stating that earth is flat, than those which argue the other way, simply because it is an established fact that it is not flat.
What Kenneth does is a misleading form of analysis. counting papers might look good, but it is not. He is simply counting every paper that somehow mentions something that he likes or wants to show. He completely ignores the limits and vagueness often expressed in the papers.
The value of these studies is dubious. Just take a look at the last paper on the list he published above (with a +1.1°C result, one of the lowest in the “medium” papers)
It is written by Christy, one of a handful of “sceptic” scientists and published in the infamous E&E journal.
To understand the impact of papers, you would want to look at the authors, the journals and citation numbers. Such an approach would turn numbers upside down at once.
PS: Comparing a number from a list (specifically collecting all low estimate papers) to the number of citations in the IPCC report (with no claim of being a full list in any way) is obviously a cheap trick!
Really? Show us the list, then, sod. I’ve actually done extensive research on this. But you go right ahead and support your contention with evidence. Let’s see what you’ve got.
I’d like to see the ‘new papers stating that earth is flat’ too!
“I’d like to see the ‘new papers stating that earth is flat’ too!”
you did not understand the analogy, please try again.
Or simply show me a new paper that demonstrates that the earth is not flat as its main purpose.
“Really? Show us the list, then, sod. I’ve actually done extensive research on this. ”
you mean papers like this one?
http://www.nature.com/nclimate/journal/v6/n5/full/nclimate2913.html
Yes, sod. You have one single paper that merely says transient climate response estimates range anywhere from 1 to 5°C:
“Ensemble mean regional TCRE values range from less than 1 °C per TtC for some ocean regions, to more than 5 °C per TtC in the Arctic”
Such a range of estimates, different from one another by a factor of 5, only goes to bolster the point that even those on your side don’t really know what the effects of doubling CO2 to 560 ppm will do to planetary temperatures. And again, you have provided a link to ONE paper. You’ve claimed there are many more high sensitivity estimates than low sensitivity estimates. Support your claim with actual evidence. Let’s see if you can.
Just one paper you can find?
Here is what you missed in the Abstract:
“Using an ensemble of twelve Earth system models, we present a novel application of pattern scaling5, 6 to define the regional pattern of temperature change per emission of CO2. Ensemble mean regional TCRE values range from less than 1 °C per TtC for some ocean regions, to more than 5 °C per TtC in the Arctic, with a pattern of higher values over land and at high northern latitudes.”
Snicker……
roflmao…
…and sob puts forward an EMPTY model based nothing. ZERO EVIDENCE.
sob’s idea of real science. 🙂
AndyG55, do you realize that the majority if not all papers listed by Kenneth are “model based”?
Of course they are model-based. That’s what happens when we have no observational/experimental/scientific evidence that shows that CO2 causes the oceans to warm or cool when varied up or down in volumes of 0.000001.
The no-feedback climate sensitivity for doubled CO2 is 1.2 C. This calculation is based upon models.
All that’s being pointed out here is that even the models have trouble producing catastrophic warming with doubled CO2.
“Yes, sod. You have one single paper that merely says transient climate response estimates range anywhere from 1 to 5°C:”
No. I found this one paper within a minute by doing a fast google scholar search (Co2 sensitivity…) in the year 2016. It shows up on the first page of results.
The paper also does not show a “range”, it shows that the global effect will show differently in certain regions. (something completely different)
Harde, 2016
http://downloads.hindawi.com/journals/ijas/aip/9251034.pdf
Including solar and cloud effects as well as all relevant feedback processes our simulations give an equilibrium climate sensitivity of CS = 0.7 °C (temperature increase at doubled CO2) and a solar sensitivity of SS = 0.17 °C (at 0.1 % increase of the total solar irradiance). Then CO2 contributes 40 % and the Sun 60 % to global warming over the last century.
—–
Bates, 2016
http://onlinelibrary.wiley.com/doi/10.1002/2015EA000154/pdf
Estimates of 2xCO2 equilibrium climate sensitivity (EqCS) derive from running global climate models (GCMs) to equilibrium. Estimates of effective climate sensitivity (EfCS) are the corresponding quantities obtained using transient GCM output or observations. The EfCS approach uses an accompanying energy balance model (EBM), the zero-dimensional model (ZDM) being standard. GCM values of EqCS and EfCS vary widely [IPCC range: (1.5, 4.5)°C] and have failed to converge over the past 35 years. Recently, attempts have been made to refine the EfCS approach by using two-zone (tropical/extratropical) EBMs. When applied using satellite radiation data, these give low and tightly-constrained EfCS values, in the neighbourhood of 1°C.
—–
Evans, 2016
http://www.sciencedirect.com/science/article/pii/B9780128045886000203
[W]e find that the equilibrium climate sensitivity is most likely less than 0.5°C, increasing CO2 most likely caused less than 20% of the global warming from the 1970s, and the CO2 response is less than one-third as strong as the solar response. The conventional model overestimates the potency of CO2 because it applies the strong solar response instead of the weak CO2response to the CO2 forcing.
—–
Gervais, 2016
http://www.sciencedirect.com/science/article/pii/S0012825216300277
http://climat-sceptiques.org/wp-content/uploads/2016/02/1-s2.0-S0012825216300277-main.pdf
Conclusion: Dangerous anthropogenic warming is questioned (i) upon recognition of the large amplitude of the natural 60–year cyclic component and (ii) upon revision downwards of the transient climate response consistent with latest tendencies shown in Fig. 1, here found to be at most 0.6 °C once the natural component has been removed, consistent with latest infrared studies (Harde, 2014). Anthropogenic warming well below the potentially dangerous range were reported in older and recent studies (Idso, 1998; Miskolczi, 2007; Paltridge et al., 2009; Gerlich and Tscheuschner, 2009; Lindzen and Choi, 2009, 2011; Spencer and Braswell, 2010; Clark, 2010; Kramm and Dlugi, 2011; Lewis and Curry, 2014; Skeie et al., 2014; Lewis, 2015; Volokin and ReLlez, 2015).
that “one paper” also is in nature climate change, with an impact factor of about 17.
while energy and environment from your list above is 0.3 …
so yes, that one paper could beat 50 of yours…
Of the 22 papers listed in the 1 to 2 degree range (above), just two came from Energy and Environment. Otto et al., 2013 was also published in Nature, was co-authored by 14 IPCC Lead Authors, and was included among the 18 papers from the last IPCC report.
So the response to my question is no, sod doesn’t have any more than one single paper he can reference…and that paper even suggests TCR ranges from “below 1.0 C” to 5 C, meaning that (a) the low sensitivity is not ruled out, and (b) your side really has no idea what kind of an impact doubled CO2 might have, given the factor-of-5 difference/range between the low and high values.
One paper vs. 82 papers. You have once again failed to support your claim with evidence, sod.
Oh dear. seb shows he doesn’t the know the difference between a DATA driven model and a speculative/agenda driven one.
Quite funny how you keep bringing your base-level ignorance to the fore, for everyone to see… seb.. well done.
Only to be expected from a far-left, anti-science, anti-life socialist troll.
“Of the 22 papers listed in the 1 to 2 degree range (above), just two came from Energy and Environment. Otto et al., 2013 was also published in Nature, was co-authored by 14 IPCC Lead Authors, and was included among the 18 papers from the last IPCC report.”
yeah, but that paper is also at 2°c and the upper end of your “low estimates”. That is fine for me and a sign that the science is working.
This is really far from the claims being made here about the number being about or below zero!
B#y the way, the paper with the highest effect (2°C) was in a high impact journal, the paper with the lowest effect (on that list) was in E&E with basically no impact. For you folks that is typically the way to plot a trendline….
“and that paper even suggests TCR ranges from “below 1.0 C” to 5 C, meaning that (a) the low sensitivity is not ruled out…”
NO! you are still making false claims. those numbers are the effect in different regions, not different levels of CO2 effect. you are wrong!
“But you go right ahead and support your contention with evidence. Let’s see what you’ve got”
Come on K, this is sob you are talking to.. or is it seb.. (its easy to mis up dumber and dumbest)
There is absolutely NO WAY that which ever it is will ever produce any actual evidence.
They DON’T HAVE ANY !!
All their whimpering , running and hiding from actually producing any is exactly what is causing so, so many people to wake up to the FACT that people in general are waking up to the FCAT that the AGW agenda is nothing but a SCAM.
And they are too dumb to realise it. 🙂
darn , where did that extra half sentence come from !! 🙂
“Scientists focus on CO2, because the effect is real.”
So what excuse do some scientists use for not focusing on the many other very real natural affects? CO2 is only a minor to perhaps a bit moderate factor. CO2 sensitivity studies are increasingly showing this.
“Scientists focus on CO2, because the effect is real”
A LIE from the start.
Neither you, nor seb, nor anyone else has been able to produce one single paper that proves CO2 causes warming in a convective atmosphere.
There is NO PROVEN EFFECT from CO2. END OF STORY !!
They concentrate on CO2 because it gives them access to the climate trough funds. !!
Oh come on, doesn’t it get boring to repeat this over and over? You can measure the radiation of CO2 (and other greenhouse gases) from the ground therefor it has an effect on the surface. You are asking for a paper that proves what exactly? That physics and math work?
I am asking for a paper that proves that CO2 causes warming in a convective atmosphere.
You are still EMPTY.
You have NOTHING!
You cannot support the very basis of your anti-CO2 , anti-science, superstitious, heathen AGW scam religion.
END OF STORY!!
And yep, your inability to post a paper link has got way past the hilarious stage, and is getting to the tedious, boring stage.
Its like having to watch a clown act over and over and over again.
Your last sentence is nailing it … well said. A clown you are.
P.S.: You can measure the radiation and still are convinced it has no effect on the surface? Can you at least quantify the amount of energy that convection is transfering from the surface in W/m²? How much transfer is due to evaporation? How much radiation is getting through the atmospheric window? And how much radiation is emitted by the surface? What is the net radiation surface to atmosphere?
“I am asking for a paper that proves that CO2 causes warming in a convective atmosphere.”
You are using terms that you do not understand and you asking for an impossible experiment.
you do not understand science at all.
“There is NO PROVEN EFFECT from CO2.”
there is. The CO2 effect can be directly measured and also demonstrated in experiments.
the most simple of these experiments can be done at home.
https://www.youtube.com/watch?v=kwtt51gvaJQ
It is exactly the same with gravity. The basics are clear for quite some time. Now show me the experiment that demonstrates what happens when i start shaking an apple tree.
https://www.youtube.com/watch?v=YLJMuA8rBSA
good luck!
The effect is very small,Sod.
Remove CO2 from the heat budget,barely changes the amout of heat in the budget:
What would the temperature of the Earth be without CO2 in the Atmosphere?
“If CO2 were removed, the change in energy transfer would be 3.3 W/m^2 which is 2.75% of the total. That change corresponds to a total change to the GHE of 0.9 °C which I will consider 1 °C as the ozone transfer really takes place in the stratosphere.
Since the Earth’s temperature is ~287K, the temperature of the Earth without CO2 would be ~286K.”
http://theinconvenientskeptic.com/2012/08/what-would-the-temperature-of-the-earth-be-without-co2-in-the-atmosphere/
CO2 is a tiny player in the system.
“The CO2 effect can be directly measured and also demonstrated in experiments.”
Great! Show us the experiments that shows us how much water bodies cool down when CO2 is decreased by 10 ppm, or how much water bodies warm up when CO2 is increased by 10 ppm. What are the physical measurements, sod? Provide us with the scientific paper.
“Great! Show us the experiments that shows us how much water bodies cool down when CO2 is decreased by 10 ppm, ”
no problem. We just need a container with a couple of square km as base and 15 to 20 km high. Will you finance the experiment?
While i wait for your money transfer, can you show me the experiment that will show exactly where each apple will land when i shake our apple tree?
“The CO2 effect can be directly measured and also demonstrated in experiments.”
That is a absolute and manifest LIE.
And you know it. !! So much so that you PROVE no measured experiment has ever been conducted.
There is no paper that shows that CO2 causes warming or cooling in a convective atmosphere.
Fantasies and LIES is all the AGW scam have left.
Why do you feel that this question wasn’t already answered? Do you think that a body of water behaves differently than rock surfaces or any other surface?
@Sunsettommy: your linked article is so full of errors … who would believe such crap?
1) The author uses some weird form of the net energy transfer between the surface and the atmosphere excluding the sun’s energy and explains that this is why the surface is 33 K warmer than it should be? Why? Because “it is 71% of the total energy that is absorbed by the surface from the Sun”? w tf.
2) The author continues as if the greenhouse effect doesn’t exist and calculates the percentage of each transfer mechanism in order to end up with some value for the influence that CO2 has in the greenhouse effect. This is beyond fantasy physics.
In reality temperature (over long periods of time) is the result of a steady state being reached between energy loss and gain of the surface. The net transfer is then zero W/m². Calculating the influence of CO2 is not as easy as the author tries to demonstrate. Let’s say CO2 is responsible for 10% of the backradiation. So if the CO2 would suddenly disappear the backradiation would decrease from 333 W/m² to about 300 W/m² (values taken from the cited Trenberth chart). So we’d now have an imbalance of 33 W/m² and the surface would cool.
But since the backradiation is depending on the surface temperature, the surface would not just cool until it emits 33 W/m² less energy (460 W/m²), wouldn’t it? Lower surface temperatures also mean lower backradiation which means the surface temperature is lower too. And from here on it gets too complicated for most skeptics, because they don’t understand algorithmic math.
SebastianH: “Why do you feel that this question wasn’t already answered?”
Um, because you’ve never provided a paper that documents observational evidence that varying CO2 up or down over a body of water causes the heat content of that body of water to change. All you’ve done is provide some made-up analogies that have nothing whatsoever to do with this question, or you claim there is no difference between heating water and heating air (which is obviously false).
Why do you think it is that your entire belief system is based on a “principle” that has never actually been subjected to a scientific experiment — as the two most prominent blogs for your side so clearly state (below)? Why do you believe in something that has never been observed? Isn’t that considered faith?
RealClimate: “Clearly it is not possible to alter the concentration of greenhouse gases in a controlled experiment at sea to study the response of the skin-layer. Instead we use the natural variations in clouds to modulate the incident infrared radiation at the sea surface. “
SkepticalScience: “Obviously it’s not possible to manipulate the concentration of CO2 in the air in order to carry out real world experiments, but natural changes in cloud cover provide an opportunity to test the principle.”
It’s about a water surface and a surface of any other material that receives a measurable amount of radiation. There is no evidence at all that energy absorbed by water surfaces has zero effect on the body of water. Instead experiments were made with cloud cover changes showing that water surfaces react to radiation.
Changing the CO2 concentration in the air column above anything turns out to be a bit difficult, so we will never know what magic effect radiation from CO2 molecules are hiding from us (or not). But if you can’t accept this, then you can’t accept either that a ball you kicked behind a high wall (out of sight) will hit the ground. Since you can not see it, the ball might as well be floating behind the wall.
Believing that somehow the laws of physics don’t apply where it is convenient for your theory … that is what I’d call faith.
Right. And no one has ever said that, either. This is just you making up another of your odd straw man arguments.
The “energy absorbed by water surfaces” comes from solar radiation, not CO2, SebastianH. Solar radiation affects the first 200 m of the ocean. Infrared heat (CO2) can’t penetrate past the hair-thin skin layer, and the heat gradient for the skin layer, when subjected to an experiment using clouds (since CO2 has never been tested), was just 0.002 K.
Um, yes, SebastianH. Water surfaces react to solar radiation. No one has disputed this. This isn’t remotely what this has ever been about. It’s about your belief that CO2 concentration changes in volumes of 0.000001 override changes in absorbed solar radiation as affected by albedo changes (cloud cover, aerosols), or changes in the Sun’s irradiance itself.
So if we will never know about the magical properties of CO2 molecules, why do you nonetheless believe that changes in the radiation budget are caused by CO2 anyway? Why do you believe in that which has never been observed? And how is that different than faith?
You and your made-up straw man analogies. Either we believe that CO2 has magical properties to heat the ocean to depths of 1000s of meters via changing the heat gradient in the skin layer by 0.002 K at most, or we don’t believe that a kicked ball will hit the ground when obstructed from view by a wall. That’s no different than saying that if you don’t believe that CO2 is making Mars really, really hot, or you believe in fairies. The two concepts have nothing to do with the other.
But we understand, SebastianH. Irrelevant analogies are all you have left to sustain your belief in the “magic” (your word) of CO2.
“Do you think that a body of water behaves differently than rock surfaces or any other surface?”
Do you actually think they behave the same ??
OMG, you really did miss out on any sort of science at junior high level, didn’t you, seb !!
Kenneth, it doesn’t matter how deep radiation penetrates as long as it gets absorbed. It’s all about the radiation exchanges at the surface. Additional radiation absorbed means more has to be emitted in order get to an equilibrium, resulting in the warming of the surface. Simple physics. How often do we need to repeat this discussion?
You believe that this is impossible to be caused by tiny CO2 variations because water is different from any other surface? I showed to you how much energy gets accumulated every year from a forcing of just 1 W/m². It gets accumulated until the surface (of the oceans) get warm enough to counter the additional forcing from above. Again: simple physics.
Can you scientifically support this claim that the depth that radiative heat penetrates into the ocean “doesn’t matter” when it comes to measuring/observing net changes in 0-2000 m ocean heat content? Because I can’t find any support for this claim of yours in the scientific literature, even though you call it “simple physics.” If it’s “simple physics”, surely you have scientific confirmation that the depth radiation penetrates has nothing to do with net ocean heat changes. Or are you just making stuff up again?
ROFLMAO.. you just keep getting funnier and funnier.
seb thinks the atmosphere is a plastic bottle !!!
Your fantasy realm is COMPLETE seb !!!
And it does explain all your child-minded mis-conceptions of REALITY.
Care to explain? Plastic bottle?
Do you know what happens when your skin can not get rid of excess heat during a hot day? Or assume you could cover the entire ocean with insulating material that still lets through radiation from the Sun. What do you think happens?
Not the same thing at all. Using your logic, you think adding a 5th coat of white paint to the wall will make it 25% whiter. It doesn’t. Seb, you want everyone to think that the climate system and CO2 is a simple system that works like a blanket. This is pure silliness. You can insist it all you want, but it isn’t so.
“Care to explain? Plastic bottle?”
Don’t even watch you own trite video links, hey seb. ! 🙂
Foot in mouth, yet again, you poor, naïve little boy !!
Actually, it was sob that posted the video links.
You really should ask him to not help you, you are quite capable of making a fool of your self with his help.
And it is way too difficult to tell dumber and dumbest apart. You can choose which of those you are. You are both striving to the max to obtain the “est” prize. An interesting contest.
@P Gosselin:
The atmosphere internally works like lots of blankets, but as a whole you can see it as one big blanket. From your paint analogy it’s clear that you do not understand …
One more time: if you absorb energy from the sun in the form of radiation or internally generate heat by combustion, digestion, etc, then you warm up until you are able to shed the same amount of energy. If you bring any form of insulation between you and your surroundings, you will need to overcome that “resistance” (it’s radiating back to you) and therefor get warmer.
That’s a pretty simple system which most skeptics (i talked to) don’t get. They can’t think in algorithms and therefor can’t understand complex systems …
@And:
http://i0.kym-cdn.com/entries/icons/original/000/000/554/facepalm.jpg
“Actually, it was sob that posted the video links.”
yes. so you should address me. you can not admit any error and everything that you say is actually false….
Poor sib, I know you have probably lived in a plastic (metho) bottle all your life….. but
…the atmosphere is NOT a plastic bottle…
.. comprehend??
The plastic bottle experiment just shows that CO2 absorbs infrared. Of course we all know that, even you And as you pointed out the thermalisation of that absorbed radiation multiple times.
And that’s the reason the greenhouse effect works. There are gases in the atmosphere that absorb and emit (portions of) infrared radiation and that’s all that is happening. Instead of radiation directly reaching space it’s interrupted by the atmosphere. As a result the surface needs to have a higher temperature to overcome that interruption.
Please surprise me with another round of “CO2 causes no warming in a convective atmosphere” … however that works when thermalisation is happening and the back radiation is measurable. Or is it about the wording? Atmosphere vs. surface?
“…the atmosphere is NOT a plastic bottle…”
it is an experiment.
Perhaps somebody around you has been to a school once in his lifetime and can tell you how those work.
seb , you could surprise the WHOLE WORLD by producing a paper that shows CO2 causes warming a convective atmosphere.
NOT GOING TO HAPPEN , is it.
I have shown you several papers proving the existence of the gravito/thermal effect
seb: ZERO
AndyG55: many !!
sob, yep an child’s experiment that has absolutely no relationship to anything that happens in the atmosphere.
Guess why, sob…
because the atmosphere is NOT a plastic bottle.
wouldn’t you agree , sob. !!
You said,
“It is written by Christy, one of a handful of “sceptic” scientists and published in the infamous E&E journal.”
The way you wrote what you did about Dr. Christy and emphasizing sceptic the way you did makes the word sceptic seem more like an epithet. How you did that can only be described as tribal signaling. The signal is that he’s a denier, a doubter, and (because I’m an American) a skeptic, while you’re a true believer. Here’s what Richard Feynman had to say about doubting, denying, and skepticism, since they are all the same thing in this context.
Feynman said of science, Of all its many values, the greatest must be the freedom to doubt.
He also said,
…It is our responsibility as scientists, knowing the great progress which comes from a satisfactory philosophy of ignorance, the great progress which is the fruit of freedom of thought, to proclaim the value of this freedom; to teach how doubt is not to be feared but welcomed and discussed; and to demand this freedom as our duty to all coming generations.
Perhaps you should consider holding skeptics in higher esteem. Additionally, I’ve done as much background research on Dr. Christy as I can without being considered a stalker. I like to know what kind of people I’m dealing with, in general. Everything I’ve found on Dr. Christy makes me respect him as a person more and more. He’s not perfect, for sure, and he makes mistakes just like the rest of us, but everything I’ve seen of the man shows him to be someone of high moral and ethical standards. Being a former missionary/teacher doesn’t exactly scream evil scientist, in my book. Everything I’ve found on the man makes me believe he’s an upstanding and trustworthy individual. So, when you “attack” him as a skeptic, you’re attacking him as a person. When you attack him as a person, you automatically lose credibility with me. Bring something to the table other than insults and you might maintain some credibility in a discussion. You’ve already lost any credibility you might have had with me and because you’ve already shown your true colors, there’s really nothing you can do to reverse my opinion of your credibility in this discussion.
Bye bye now
“The way you wrote what you did about Dr. Christy and emphasizing sceptic the way you did makes the word sceptic seem more like an epithet.”
my main point is more simple: having a couple of papers from the same or connected authors is basically useless. It is the same with having papers in the same obscure journals. Counting this kind of stuff gives a false impression.
being “sceptic” is really fine fore me. But the people posting here have denied the relevancy of climate trends under this topic, by making false statements about statistics and tests on this very topic. The same “sceptics” accept an utterly absurd trend line on the next topic (antarctic sea ice).
https://notrickszone.com/2017/03/15/solar-activity-continues-near-200-year-low-and-antarctic-sea-ice-drop-caused-by-natural-factors/
“sceptics” are contradicting their own scepticism. I am just pointing it out.
Good to see you DENYING stats and maths YET AGAIN , sob.
You really are a funny little cretin !!
Look at this graph on Christy and how his estimates of warming have always been below the real number:
https://i.guim.co.uk/img/static/sys-images/Guardian/Pix/pictures/2015/4/3/1428024209007/512cdcb4-5f38-4d94-bf05-5a05ccbf17f9-bestSizeAvailable.png?w=620&q=20&auto=format&usm=12&fit=max&dpr=2&s=879d11d9117715a8d90adcedf54b4e56
What would a sceptic do, when his estimates always have to be corrected in one direction?
roflmao.. and the data against is, what, GISS.. the much fabricated AGW lies.
And from the Gruniad, no less.. the peak of FAKE. !!
You really are a funny , and very gullible little single brain-celled amoeba, sob !!
REALITY shows that there was NO RISE from 2001- 20015.
So it seem Spencer and Christy have overestimated . Thanks for pointing this out sob.
Foot in mouth yet again, you poor child-mind.
But Roy always was a luke-warmer… a partial believer in CO2 warming, DESPITE there being ZERO EVIDENCE.
What was that with credibility and insults again? And is a fun sparring partner, but he can’t be taken seriously …
“roflmao.. and the data against is, what, GISS.. the much fabricated AGW lies. ”
you are a liar. UAH over the last decade.
“east squares trend line; slope = 0.0315664 per year”
http://www.woodfortrees.org/plot/uah6/last:120/plot/uah6/last:120/trend
even the 30 year UAH trend is above the Christy numbers up till 2003…
http://www.woodfortrees.org/plot/uah6/last:360/plot/uah6/last:360/trend
roflmao..
There you go using the El Nino transient to create a non-existent linear trend.
But those El Ninos are the ONLY warming, aren’t they, little sob.
They are nothing to do with CO2 , are they little minded AGW shill.
But you HAVE to use them, because you KNOW that without them, THERE IS NO WARMING between those El Ninos
No warming from 1980-1997.5
No warming from the end of the 1998 El Nino effects in 2001 to the start of the 2015/16 El Nino.
The funny thing is that EVERY time you use that El Nino step and transient to create fictitious trends, you prove me correct… and are just too dumb to realise it.
THANKS again for showing EVERYBODY that the ONLY thing creating any warming is those El Ninos. 🙂
No CO2 warming signal what-so-ever. 🙂