Fake Warming + A Neglected Sun
= Man-Made Climate Change
In late 2015, Soon, Connolly, and Connolly (hereafter SCC15) published a comprehensive (101 pages) analysis of how the modern anthropogenic global warming (AGW) paradigm has been constructed. The paper, published in Earth Science Reviews, is entitled Re-evaluating the role of solar variability on Northern Hemisphere temperature trends since the 19th century.
What follows is a very brief summary of some of the graphical highlights in SCC15 as well as the fully cited conclusion. Succinctly, the paper can be divided into 2 parts.
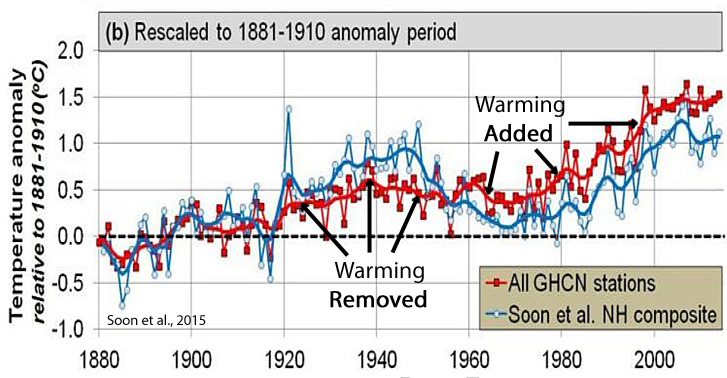
1. The instrumental temperature record has undergone heavy adjustments (a utilization of an urban temperature station siting bias) to allow a better fit with climate models that presume CO2 emissions drive temperature.
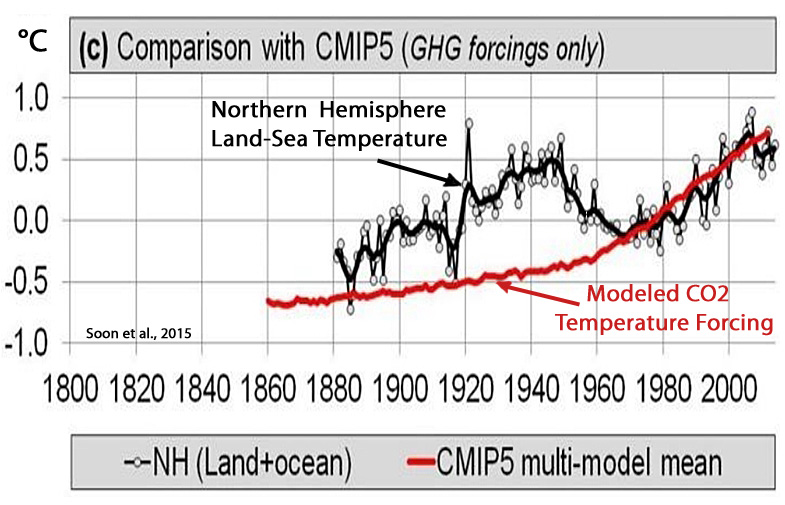
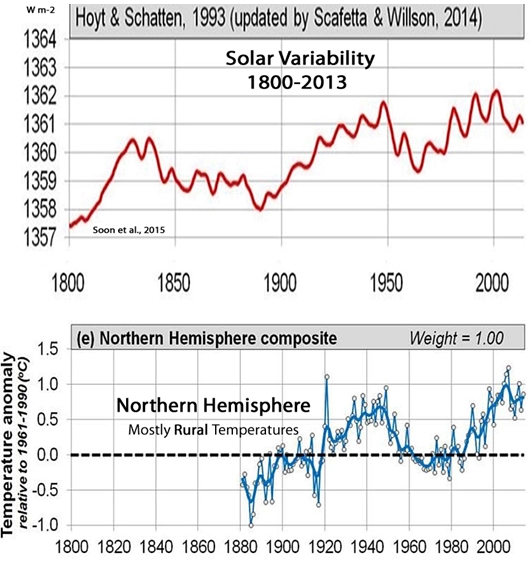
2.. CO2-based climate models do not adequately correlate with Northern Hemisphere (NH) temperature trends of the last 130 years; solar activity changes do correlate well with NH trends — especially when urban bias has been removed from the temperature record.
Urban Bias Artificially Adds ~0.09 °C Per Decade To Land Temperatures
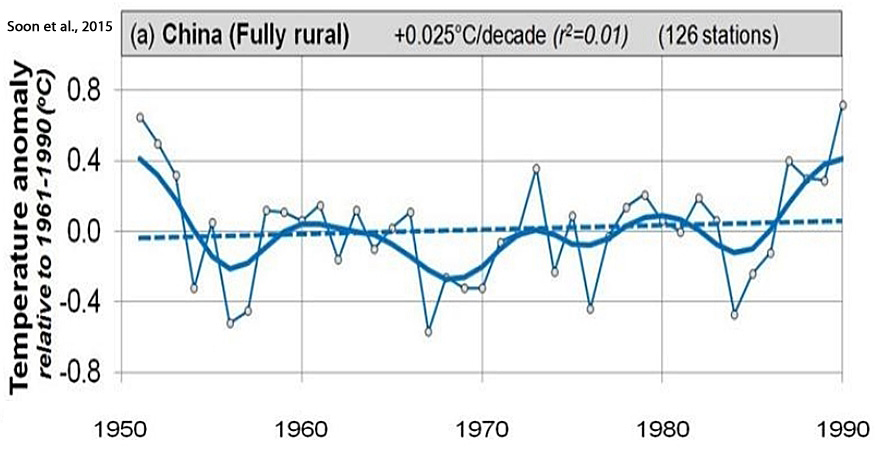
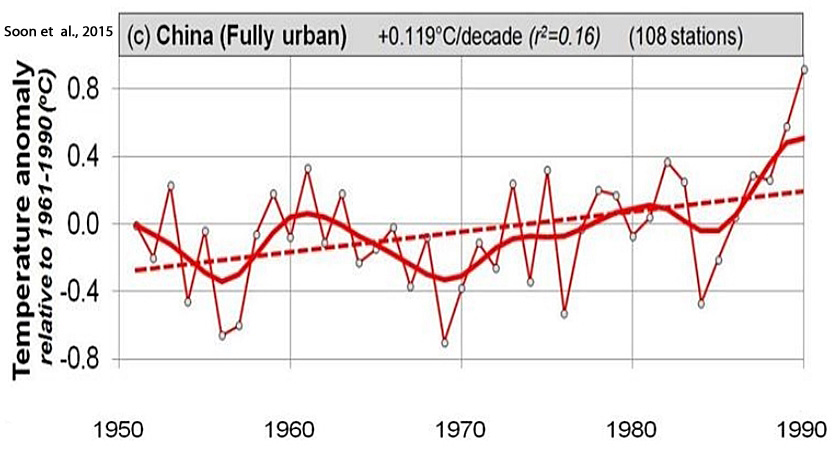
SCC15:
“[A]lthough there are 126 fully rural stations with data during the 1951-1990 period, there are only 13 and 17 fully rural stations during the 1907-1950 and 1991-2014 periods respectively, and none of the stations with records before 1907 are still fully rural. … For individual urban stations and areas in China, the temperature records can be very strongly affected by urbanization bias. For instance, Ren et al. (2007) found that between 65-80% of the apparent warming trend over the 1961-2000 period for the Beijing and Wuhan station records was probably due to increasing urban heat islands. [T]he temperature trends increase from +0.025°C/decade (fully rural) to … +0.119°C/decade (fully urban). … If we assume that the fully rural stations are unaffected by urbanization bias, while the other subsets are, then we can estimate the extent of urbanization bias in the “all stations” trends by subtracting the fully rural trends. This gives us an estimate of +0.094°C/decade urbanization bias over the 1951-1990 period – similar to Wang & Ge (2012)’s +0.09°C/decade estimate.”
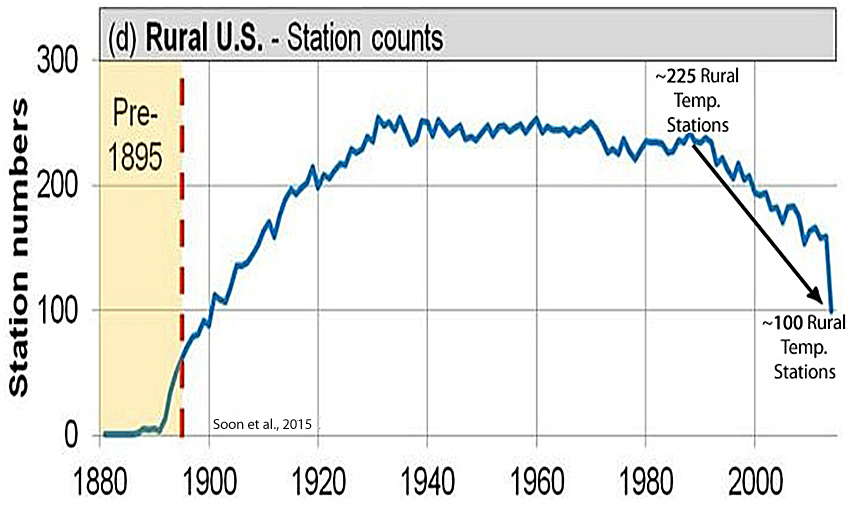
Rural Temperature Stations That Show Minimal Warming Are Removed
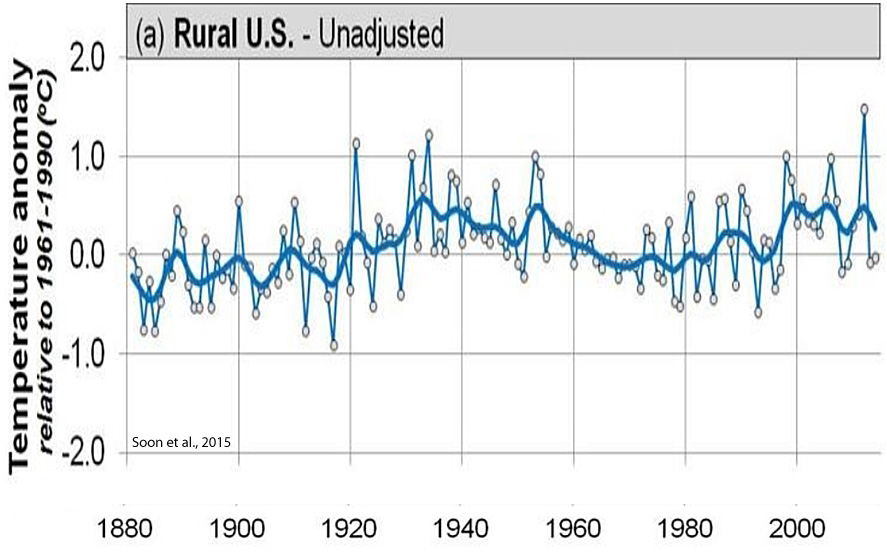
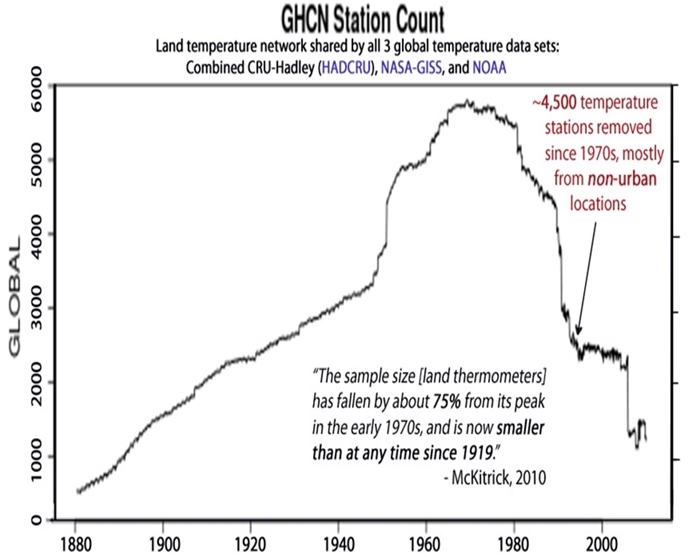
There are now fewer U.S. rural stations contributing to the Global Historical Climatology Network (GHCN) than there were in 1900.
According to McKitrick (2010), 75% of temperature stations across the globe have been removed since the 1970s, mostly from rural or non-urban areas. Temperature stations located in urban areas — where paved roads and industrialized waste heat artificially warm the surface – have been allowed to remain.
McKitrick, 2010
The Consequence Of Urban Bias: Artificial Land Warming Since 1980
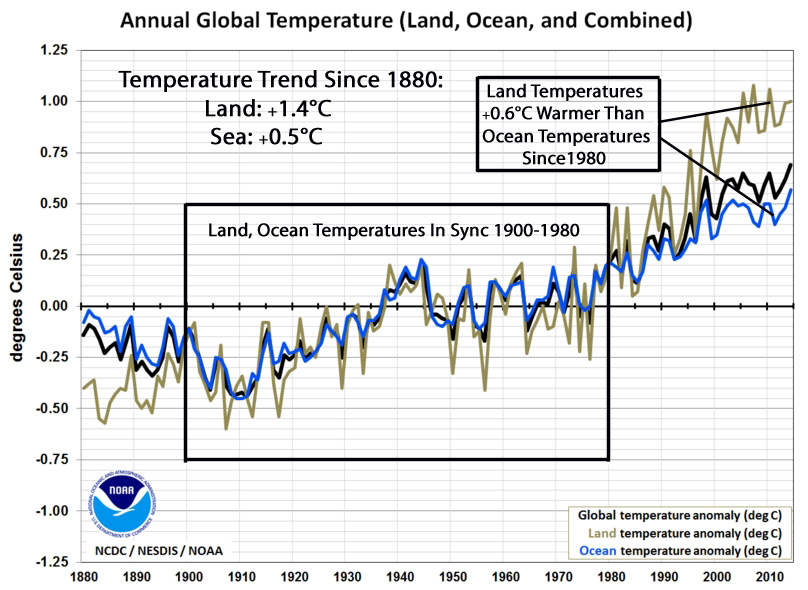
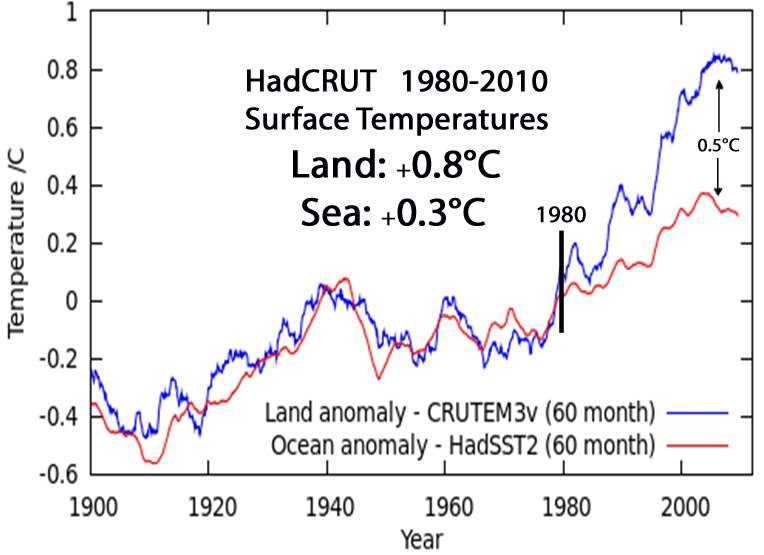
HadCRUT Land vs. Ocean Temperature Anomalies
Warming Since The 1980s On Par With Pre-1950s Warming Using Rural-Only Stations
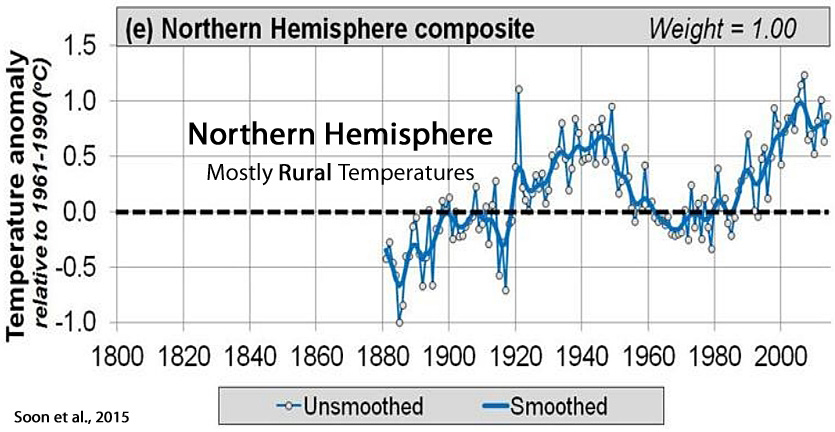
CO2-Based Climate Models Do Not Explain The Pre-1980 Temperature Trends
Pre-1950s Warmth Removed, Post-1950s Warmth Added…To Make The Data Fit The Models
Solar Variability Correlates Well With The 1880s-Present NH Temperature Record

Conclusion/Summary From Soon, Connolly, & Connolly, 2015
1. “We have constructed a new estimate of Northern Hemisphere surface air temperature trends derived from mostly rural stations – thereby minimizing the problems introduced to previous estimates by urbanization bias. Similar to previous estimates, our composite implies warming trends during the periods 1880s-1940s and 1980s-2000s. However, this new estimate implies a more pronounced cooling trend during the 1950s-1970s. As a result, the relative warmth of the mid-20th century warm period is comparable to the recent warm period – a different conclusion to previous estimates. Although our new composite implies different trends from previous estimates, we note that it is compatible with Northern Hemisphere temperature trends derived from (a) sea surface temperatures; (b) glacier length records; (c) tree ring widths.”
2. “However, the recent multi model means of the CMIP5 Global Climate Model hindcasts failed to adequately reproduce the temperature trends implied by our composite, even when they included both “anthropogenic and natural forcings”. One reason why the hindcasts might have failed to accurately reproduce the temperature trends is that the solar forcings they used all implied relatively little solar variability. However, in this paper, we carried out a detailed review of the debate over solar variability, and revealed that considerable uncertainty remains over exactly how the Total Solar Irradiance has varied since the 19th century. When we compared our new composite to one of the high solar variability reconstructions of Total Solar Irradiance which was not considered by the CMIP5 hindcasts (i.e., the Hoyt & Schatten reconstruction), we found a remarkably close fit. If the Hoyt & Schatten reconstruction and our new Northern Hemisphere temperature trend estimates are accurate, then it seems that most of the temperature trends since at least 1881 can be explained in terms of solar variability, with atmospheric greenhouse gas concentrations providing at most a minor contribution. This contradicts the claim by the latest Intergovernmental Panel on Climate Change (IPCC) reports that most of the temperature trends since the 1950s are due to changes in atmospheric greenhouse gas concentrations (Bindoff et al., 2013).”


Once again we see how hyped and exaggerated claimed CO2 effect is.
It was ever thus, Pierre. The State must have its tithe, and to do so, it either creates a crisis or gets its lobby groups to shill for one. The State then says it (and only it) has the solution, and it always – ALWAYS – ends up that the solution is that the State needs more money. A good example of this is the NHS. No matter what the problems are with it the solution is always more money (from the tax-payer). The thing is, CO2 (and now, NOX) is not a problem. It is a revenue stream.
“Once again we see how hyped and exaggerated claimed CO2 effect is.”
… And as seb constantly shows us, TOTALLY UNPROVEN, either in a convective atmosphere or over water.
i really love that global sea water temperature data from 1880.
https://notrickszone.com/wp-content/uploads/2017/02/NOAA-Global-Temperatures-1880-2014-Land-vs-Sea-0.6-C-Added.jpg
So do we all, sob.
The warming out of the COLDEST period of the last 10,000 years has been TOTALLY and ABSOLUTELY BENEFICIAL
Leave your granny’s inner city ghetto basement, and head to Siberia, if you want to go back to those bitterly cold times.
Same here.
Sea temperatures rose by almost 0.75 degC between 1910 and 1945 during a period which even the IPCC acknowledges could not have been influenced by CO2. That change was therefore due to natural factors.
Compare that with the slighltly more than 0.5 deg C temperature rise between 1970 and 2015.
I guess that the take home is that CO2 reduces the amount and rate of warming, or perhaps of course it is simply that CO2 is not the driver of temperature change and temperature changes are down to natural variation.
It is very difficult to explain why the recent warming is less pronounced and at a slower rate if CO2 is a driver and one which is by now dominant over natural variation.
I’m a bit of a surfer.
I have absolutely NO PROBLEM with ocean temperatures above 12C !!! 😉
Bondi in summer.
Yeah baby !!
http://www.surf-forecast.com/sstgraphs/Bondi-Beach.png
IMAGINE if there was a degree or so warming of the oceans.
Soooo much more surfing without a wetsuit.
Of course, those who are trapped in their granny basements in their far-left latte ghettos.. (sob, seb.. that’s YOU) need not apply. !
“I’m a bit of a surfer.
I have absolutely NO PROBLEM with ocean temperatures above 12C”
you are stupid beyond believe.
Check out, how much even a minor change to ocean temperature would do to the globe:
“If you were to transfer enough ocean energy directly to the atmosphere to create 4 degrees of atmospheric warming, how much would that change the average temperature of the Earth’s water?
Would you believe – 0.001 Degrees C of ocean temp change? ”
https://wattsupwiththat.com/2011/04/06/energy-content-the-heat-is-on-atmosphere-vs-ocean/
Poor sob. You really are stuck in his low-level ghetto far from any sort of REALITY !!
You really are some sort of low-life non-intelligence, aren’t you.
How much do you think ocean temperatures change from season to season anywhere in the world.
… and do you REALLY think anyone can measure changes of 0.001 C ?
You are on your meds too much, sob
Get your prescription changed.
And little sob still hasn’t realised that OHC has dropped CONSIDERABLY over the time of the Holocene, and is currently pretty much at its LOWEST for 10,000 years.
But for sob.. IGNORANCE has to be bliss.. because it all that he has.
https://notrickszone.com/wp-content/uploads/2016/11/Holocene-Cooling-Pacific-Heat-Content-Rosenthal13-copy.jpg
It will be HILARIOUS to watch seb/sob as the temperature starts to decline over the next several year.
Actually.. its HILARIOUS to watch their manic incompetence and ignorance of basic physics, even now ! 🙂
“It will be HILARIOUS to watch seb/sob as the temperature starts to decline over the next several year.”
temperature will not fall in a significant way. If you were sure that it would, you would earn a fortune by betting on it.
“Actually.. its HILARIOUS to watch their manic incompetence and ignorance of basic physics, even now ! ”
yeah. That is why your absurd theories are published in the mainstream textbooks of these days.
sod:
“If you were sure that it would, you would earn a fortune by betting on it.”
Please tell us how could I possibly bet on global temperature?
And be sure, as the number of GHCN stations goes down, should I bet on the outcome? No, the looser might not like loosing.
sob shows his ignorance , yet again.
Even if the temperature remains steady, the whole AGW scam has to collapse as the models diverge further and further from REALITY.
But if you follow the scam, you can already see many of the scammers trying to cover their assets, because they also KNOW that there is a cooling period coming, even though they will never admit it to themselves, and certainly not to the MSM and their brain-stupefied cult followers.
A few years ago, the UK met Office (I think that it was Julia Slingo) said that there may be no return to warming before 2030.
The UK Met Office is very pro cAGW, and this statement was made at a time when the PAUSE was accepted as reality, and it was accepted that there had been a significant slow down in the rate of warming notwithstanding every increasing levels of CO2.
It was not entirely clear why the UK Met Office were of that view, but the impression given was that it was related to ocean cycles and a less active sun.
As Andy points out, even if there is no actual cooling, should temperatures not rise, over the coming next 5 to 10 years the divergence between temperatures and model projections will widen.
If there is no further El Nino within the next few years, it is quite conceivable that of the 102 models that Dr Spencer uses in his comparison with satellite data that not one of these models by 2020 will be within 2 SD of temperatures measured by UAH or by balloon data. Every model will be outside 2 SD confident bounds; that is how far the divergence issue is going if there is no return to warming and the 2015/16 strong El Nino temps is only a short lived blip in the data record.
“The UK Met Office is very pro cAGW, and this statement was made at a time when the PAUSE was accepted as reality, and it was accepted that there had been a significant slow down in the rate of warming notwithstanding every increasing levels of CO2.”
well, the pause is pretty much dead.
“If there is no further El Nino within the next few years, it is quite conceivable that of the 102 models that Dr Spencer uses in his comparison with satellite data that not one of these models by 2020 will be within 2 SD of temperatures measured by UAH or by balloon data. ”
the problem here is, that UAH is somewhat of an outlier and that Spencer was wrong a lot lately (for example with his claim that 2016 would not set a new record, which it did of course).
Outlier? The differences between UAH and RSS are essentially imperceptible. And RSS is run by a people who call skeptics “denialists”.
http://www.woodfortrees.org/plot/uah6/from:1998/to:2016/plot/uah6/from:1998/to:2016/trend/plot/rss/from:1998/to:2016/plot/rss/from:1998/to:2016/trend
http://www.klimatupplysningen.se/wp-content/uploads/2015/05/cooling-1998.jpg
In both UAH and RSS, 2016 did not set a record, sod. It was in a statistical tie with 1998.
“well, the pause is pretty much dead. ”
Only if you consider a NON-CO2, solar forced El Nino transient.
But those NON-CO2 El Ninos are all that you have, aren’t they sob.
Apart from those… basically NO WARMING AT ALL.
NO CO2 warming signature in the whole satellite record..
Poor little trollette.. no wonder you are so, so anxious to push the El Ninos. 😉
Well, I don’t know if any of the papers linked above considered global ocean heat content in their studies, but according to https://upload.wikimedia.org/wikipedia/commons/5/5c/Ocean_Heat_Content_%282012%29.png the heat content increased by around 25*10^22 Joules from 1970 until 2013 (43 years ~ 1.36 billion seconds).
So the oceans were heated by a 1.84359*10^14 W heater. The oceans surface area is 361,900,000 km² or 3.919*10^14 m².
So what is the average W/m² that has been added to the ocean heat content instead of surface temperatures? The answer is 0.47 W/m².
Could this explain the observed slower increase in surface temperatures?
According to Levitus et al., 2012, the heat content of the 0-2000 m layer increased by a whopping 0.09 C between 1955 and 2010, even though this was a period in which we enjoyed some of the
highest solar activity since the Medieval Warm Period. According to Rosenthal et al., 2013, the oceans (0-700 m) are still 0.65 C cooler than they were during the Medieveal Warm Period, and just 0.25 C warmer than they were in 1800. And they’re now 2.0 C cooler now than they were during the Holocene Thermal Maximum. In other words, the oceans are still only slightly warmer than the coldest they’ve been in the last 10,000 years.
So where does the magic of carbon dioxide forcing of ocean heat content fit into all of this, SebastianH?
How can the heat content be measured in degrees celsius? Is there at least a volume mentioned somewhere? How many litres are in the entire ocean from 0-2000 m deep?
If the entire ocean warmed by 0.09 C this would equal 5.5803*10^24 Joules or roughly 20 times the amount I mentioned. The average depth is 3688 m, so 10 times the amount maybe? So 4.7 W/m² during that time period? Hmm. “Whopping” indeed.
CO2 and other greenhouse gases radiate towards the surface. The surface has to become warmer to get rid of the energy or it doesn’t become warmer and stores the excess energy internally (heat content increases) or a combination of both.
BTW: that’s what your GHE hiatus paper was saying if you cared to read it 😉 Full quote:
The quote also includes the note you chose to ignore 😉
How can the heat content be measured in degrees celsius? Is there at least a volume mentioned somewhere? How many litres are in the entire ocean from 0-2000 m deep?
If the entire ocean warmed by 0.09 C this would equal 5.5803*10^24 Joules or roughly 20 times the amount I mentioned. The average depth is 3688 m, so 10 times the amount maybe? So 4.7 W/m² during that time period? Hmm. “Whopping” indeed.
CO2 and other greenhouse gases radiate towards the surface. The surface has to become warmer to get rid of the energy or it doesn’t become warmer and stores the excess energy internally (heat content increases) or a combination of both.
Would the numbers have been so difficult for you to look up yourself so as not to demonstrate these calculative deficiencies?
—
Levitus et al., 2012
http://onlinelibrary.wiley.com/doi/10.1029/2012GL051106/abstract
“The heat content of the World Ocean for the 0–2000 m layer increased by 24.0 ± 1.9 × 10²² J (±2S.E.) corresponding to a rate of 0.39 W m−2 (per unit area of the World Ocean) and a volume mean warming of 0.09°C. This warming corresponds to a rate of 0.27 W m−2 per unit area of earth’s surface.”
—
Considering the 0-700 m layer cooled by -0.9°C between ~1000 CE and 1800 CE, what heating source could have caused such a heat/temperature loss? And did that same heating source cease to be a factor in the tiny warm-up since that time (1800 CE), or do you believe that source only causes (dramatic) cooling, but not (modest) warming?
Because they use heat-to-temperature conversion tables. That’s why Levitus et al. (2012) and Rosenthal et al. (2013) use degrees Celsius in their papers on ocean heat content.
So the question remains unanswered. Why did temperatures drop by 0.9 C from the Medieval Warm Period to the Little Ice Age (0-700 m) (while CO2 concentrations rose), and then only increase by 0.25 C (0-700 m) from the Little Ice Age to present (or just 0.09 C in the 0-2000 m layer since 1955 according to Levitus et al. [2012])?
We’ve had some of the highest solar activity (the Modern Grand Maximum) since the Medieval Warm Period during the 20th century to early 21st century, so that could explain the warm up from the Little Ice Age…especially since we know that the Sun provides the heat source for the oceans. So where does CO2 fit into the OHC (converted to temperature) for the last 1,000 years, SebastianH? Why did OHC/temps drop as CO2 rose (dramatically)?
As usual, I expect you will avoid answering this question. Just as you did this time.
Again we see that seb just DOES NOT COMPREHEND the action of LW radiation on the surface of water. Manifest ignorance.
And he wilfully wants to remain that way.
So it’s 0.39 W/m² from 1955 to 2010 and 0.47 W/m² from 1970 to 2013 … sounds about right. 0.27 W/m² or 0.33 W/m² of radiation for the entire surface of the Earth that was “lost” to ocean warming.
Why do you keep asking about the past? What does it matter? Humans weren’t around or produced enough greenhouse gases back then. We now have an increase in stored energy (ocean heat content) and can attribute the stored energy to the likely causes. Since the greenhouse effect didn’t just stop working (see quote from your “hiatus” paper) it’s likely that this surplus is coming from the increased greenhouse effect.
El Nino events would be mechanisms that release some of that stored energy and warm the surface from time to time.
Using your “maths” skills, you had calculated 4.7 m-2, which means your calculations were off by more than a factor of 10. So will you admit this, or does writing that the originally cited numbers “sounds about right” take the place of this acknowledgement?
This is so amusing. Because the (recent) past completely undermines your case that (a) the tiny 0.09 C of heating since 1955 represents a substantial change, and (b) that humans producing “greenhouse gases” is a consequential factor in ocean heat content changes.
Ocean temperatures plummeted by -0.9 C while CO2 concentrations rose from the Medieval Warm Period to the Little Ice Age. This ocean heat/temp change can’t be explained by CO2. So you have to acknowledge that the Sun did that — by both reducing its output (decadal- to centennial-scale minima periods Sporer, Maunder, Dalton) and by successive volcanic eruptions that reduced temperatures on centennial scales (surface solar radiation). Since scientists have found the 20th century (and early 21st century) had some of the highest levels of solar activity for milllennia (called the Modern Maximum), and since we’ve enjoyed one of the more quiescent periods in volcanic activity during the same period, your job (if you were honestly trying to consider other viewpoints than the one you cling to regarding CO2 — and we know you’re not honest or trying to do that at all) would be to eliminate these natural factors as causal agents of OHC changes.
Instead, you have retreated to the pathetic: What does it matter? As if asking you to support your beliefs was something you shouldn’t be asked to do. You start from the position that you have the “truth” on your side, we are “deniers” of this “truth”, and so you are entitled to dismiss any question that challenge this “truth” as not mattering.
—
By the way, your new “discovery” that the greenhouse effect hiatus paper indicates that the greenhouse effect hiatus was induced by natural ENSO events and clouds only serve to further annihilate your case that the GHE is modulated by CO2 concentration changes, and not natural factors. But apparently this irony was lost on you too.
Kenneth, you don’t have to demonstrate you don’t understand math or what I was calculating there … since you only presented a change of temperature of the ocean up to a certain depth I was estimating how much W/m² that might be. Obviously the estimation is wrong, because I don’t know the volume of the oceans for the first 2000 meters.
“Sounds about right” was a remark that both heat contents have the same magnitude … a change by xy * 10^22 Joules.
And you still don’t understand why past changes don’t really matter. The conditions are obviously not the same as today, are they? I also highly doubt that one can determine ocean temperature / heat content for past millenia with great detail … what are the errors in that figure? Nobody actually measured the temperature back then and the Levitus paper you linked to has a graph which includes data coverage since the 50s … not good until the 80s. We basically only have good data for the recent times, wouldn’t you agree?
It’s not a new “discovery” of mine … I mentioned OHC lots of times. Only recently you presented papers confirming this more or less. I still don’t know why you seem to think that the GHE somehow got weaker because temperatures didn’t change. That paper specifically mentions that the additional heat is still trapped on Earth, it’s just not exclusively warming the surface.
I’m having a hard time suppressing my amusement. So you miscalculate the forcing of ocean heat temperature changes by a factor of ten, and then turn around and claim that I am the one who is demonstrating my math deficiencies. You really have a problem, SebastianH.
No, I fully understand why you have to claim that past changes in OHC that completely undermine your beliefs about OHC CO2-forcing “don’t really matter.” Because if you acknowledged that they do matter, then you’d have to admit that your beliefs about CO2 are not supportable.
Correct. For the past 100 years or so, we’ve enjoyed some of the highest solar activity in millennia (the Modern Grand Maximum), far greater solar activity than during the successive minima periods during the 1400-1900 period. We’ve also enjoyed some of the most quiescent periods of low volcanic activity in the last 100 years, which means that more SSR penetrated into the ocean waters to heat them. That’s indeed an indication that the modulation of ocean heat changes are “not the same” as they were during the Little Ice Age, when low solar activity and higher frequencies and intensities of volcanic eruptions led to cooling oceans.
But, of course, you wish to ignore/dismiss these factors. They don’t matter. The only thing that matters is the 1/100th of 1% change in the atmospheric CO2 concentration. Because you believe that that is what changes ocean temperatures despite a chronic inability to support this belief with actual physical measurements/observations.
Another dishonest fabrication from SebastianH. You just can’t help yourself, can you? I have never written that the “GHE somehow got weaker because temperatures didn’t change.”
Yet more evidence that the UN-IPCC power grab has foundations of sand.
sand, surf.. eye candy..
Where is problem with a warmer climate ?????????
Whilst I am sceptical of the science behind so called Climate Science, my biggest gripe is with the fundamental conceptions upon which the scare is based.
This planet is presently way too cold. Heck it is in an ice age, albeit luckily for us was are living in a short lived benign inter glacial, such that the planet is in it second coldest period for the last 500 million years. 500 million years is a long time, especially when you compare this to the period of advanced multicellular life. In fact, I would suggest that advanced life has only been around for about 500 million years and during this period it has almost always been warmer.
The planet has way too little CO2. Plants develioped when CO2 levels were far higher and bio diversity would greatly benefit from seeing CO2 levels back over 1000 ppmv, perhaps more in the region of say 2000 ppmv.
Thus we should be doing our utmost to restore CO2 levels to those of earlier times when life flourished. If by some happy coincidence this leads to some warming then that is a real win win scenario.
Unfortunately there is no compelling evidence that increasing levels of CO2 lead to warming, but even if we cannot obtain the benefits of a warmer world, a CO2 enriched globe would in itself be a blessing as one can see from the way in which the planet is greening. Man is doing his utmost to deforest, but despite this the globe is greener than it has been in the past 50 or so years because of the increased levels of CO2.
Bring on more CO2. Hopefully, lets have some more warming but I suspect that what happens next will simply be a factor of natural variation which we neither know or understand.
Again the interpretation of McKitrick’s graph. Take a village with ten thousand inhabitants by then and five thousand now. The conclusion that five thousand people left the village, makes the tacit assumption that nobody entered the village. Actually, more than ten thousand could have left the village. For 1970-2010 the number of drop-out stations is 10973 and the number of included stations 2932. In 1970 the number of stations on duty was 9644 and in 2010 this was 1603. Do you see that the drop-out exceeds the initial number? Some drop-out applies at the included stations but the overall image is that almost all older stations disappeared, urban or rural does not matter. If there were now an over-representation of urban stations, this must be caused by the introduction of new stations.
BEST data has confirmed the temperature record. You are simply wrong.
http://berkeleyearth.org/
The BEST data uses the very same land database that the other datasets use (GHCN). That doesn’t “confirm” anything other than they “agree” that the same single database contaminated by artificial urban heat is “correct.”
Perhaps you can explain why NASA had the temperatures rising by 0.5 C between 1880 and 1950 in 1987…
https://notrickszone.com/wp-content/uploads/2017/02/NASA-Global-Surface-Temps-1987-0.5C-1880-1950.jpg
…but now they have the increase at about 0.05 C between 1880 and 1950:
https://notrickszone.com/wp-content/uploads/2017/02/NASA-Global-Surface-Temps-1987-1880-1950-0.5C.jpg
Why did NASA remove 0.45 C of warming from the 1880-1950 period, sod?
BEST gets half a million dollars a year in two large “anonymous” donations, + nearly the same from far-left socialist organisations.
I wonder what they have to do to keep the money flowing. 😉
The only thing you have to know for each GHCN station is the first and last year it was in use. The rest is simple bookkeeping. This may also show that since 1970 the 2932 new stations were distributed over latitude as follows: 2 ships, 72 Arctic, 1629 Middle North, 872 Tropic, 336 Middle South, and 21 Antarctic. There was already for years an overrepresentation on NH. While the slaughter of all the older stations was going on, for what reason were so many new stations introduced on NH?
BEST was set up specifically to back up the NOAA/GISS temperature manipulations.
And they hired the right people for the job. 😉
We should always check our hidden assumptions. If we see on a time series graph two adjacent points, we may assume that they are based on the same group of stations, but in the surface record they never are. By drop-out and inclusion the groups have changed, not randomly but systematic. Since 1970 the station changes are that outrageous that for longitudinal purposes the data are beyond repair. If someone promises us to do that and calls his project BEST, he must be a charlatan.
“Since 1970 the station changes are that outrageous that for longitudinal purposes the data are beyond repair.”
this claim is simply false, because since 1979 we have satellites confirming the surface data.
i have NEVER heard sceptics asking for a better grid of stations and funding for better understanding of the station data.
The typical sceptic profits from a lack of stations, real data contradicts his positions, so he does not like it.
It was very clear from the start that Muller was a lying POS. A con-artist at best, driven by his daughter’s ANIC AGW hysteria.
And then they hired Mosher, a faceless “dodgy bros” front-man with almost zero scientific education.
But the money just keeps on flowing to them 😉
ANIC = MANIC !
Really Sod? I have been advocating a complete station overhaul for nearly 10 years. Not only here, but also on WUWT, Notalot, JoNova and other sites. Most recently I posted data collection networks as a good first priority for the Trump administration. I know this will be resisted by the catastrophist because we need 30 years of good continuous records before conclusions can be drawn. That simply will not do! So I lean toward the satellite records for consistency. Milk should be homogenized (and pasteurized- warmed) not temperature data. Properly located and maintained stations should eliminate all statistical fudging to support a prescribed result.
“Really Sod? I have been advocating a complete station overhaul for nearly 10 years. Not only here, but also on WUWT, Notalot, JoNova and other sites. 2
do you have links? i would love to read your arguments!
Any attempt to start now is futile though. Before we get real data (50 years?), the battle will be over already.
From: Tom Wigley
To: Phil Jones
Subject: 1940s
Date: Sun, 27 Sep 2009 23:25:38 -0600
Cc: Ben Santer
Phil,
Here are some speculations on correcting SSTs to partly
explain the 1940s warming blip.
If you look at the attached plot you will see that the
land also shows the 1940s blip (as I’m sure you know).
So, if we could reduce the ocean blip by, say, 0.15 degC,
then this would be significant for the global mean — but
we’d still have to explain the land blip.
I’ve chosen 0.15 here deliberately. This still leaves an
ocean blip, and i think one needs to have some form of
ocean blip to explain the land blip (via either some common
forcing, or ocean forcing land, or vice versa, or all of
these). When you look at other blips, the land blips are
1.5 to 2 times (roughly) the ocean blips — higher sensitivity
plus thermal inertia effects. My 0.15 adjustment leaves things
consistent with this, so you can see where I am coming from.
Removing ENSO does not affect this.
It would be good to remove at least part of the 1940s blip,
but we are still left with “why the blip”.
Let me go further. If you look at NH vs SH and the aerosol
effect (qualitatively or with MAGICC) then with a reduced
ocean blip we get continuous warming in the SH, and a cooling
in the NH — just as one would expect with mainly NH aerosols.
The other interesting thing is (as Foukal et al. note — from
MAGICC) that the 1910-40 warming cannot be solar. The Sun can
get at most 10% of this with Wang et al solar, less with Foukal
solar. So this may well be NADW, as Sarah and I noted in 1987
(and also Schlesinger later). A reduced SST blip in the 1940s
makes the 1910-40 warming larger than the SH (which it
currently is not) — but not really enough.
So … why was the SH so cold around 1910? Another SST problem?
(SH/NH data also attached.)
This stuff is in a report I am writing for EPRI, so I’d
appreciate any comments you (and Ben) might have.
Tom.
http://www.di2.nu/foia/1254108338.txt
Incredible that Jones and Wigley got away Scott-free with their actions. What was the purpose of the alterations if not to manipulate the data? And people still defend this sh1te! lol.
Climate “Science” on Trial; Cherry Picking Locations to Manufacture Warming
https://co2islife.wordpress.com/2017/02/18/a-tale-of-two-cities-cherry-picking-locations-to-manufacture-warming/